Resolving Mismatches Between Band Structure and Density of States in Computational Materials Science
This article provides a comprehensive analysis of the frequent discrepancies observed between electronic band structure and Density of States (DOS) calculations in computational materials science.
Resolving Mismatches Between Band Structure and Density of States in Computational Materials Science
Abstract
This article provides a comprehensive analysis of the frequent discrepancies observed between electronic band structure and Density of States (DOS) calculations in computational materials science. Tailored for researchers and computational scientists, we explore the foundational relationship between these two fundamental representations, identify common methodological pitfalls in DFT calculations, present systematic troubleshooting protocols for result validation, and establish best practices for ensuring computational consistency across different material systems, including emerging biomedical materials.
The Fundamental Relationship Between Band Structure and DOS
In computational materials science, electronic structure calculations are fundamental for predicting and understanding material properties. Density Functional Theory (DFT) is the most widely used method for such calculations, providing two primary outputs: the electronic band structure and the density of states (DOS). While these two representations are derived from the same underlying electronic Hamiltonian, they often appear to present conflicting information, particularly regarding fundamental properties like band gaps. This guide explores the core physics behind these two representations, explains the root causes of apparent discrepancies, and provides methodologies for their correct interpretation and calculation. Understanding why band structure and DOS don't match is not merely a technical detail but a crucial step towards reliable materials design in fields ranging from semiconductor technology to catalyst development [1].
Fundamental Concepts and Physical Meanings
Electronic Band Structure
The electronic band structure describes the relationship between the energy (E) of an electron and its crystal momentum (ħk) within a periodic crystal lattice. It is typically plotted as energy bands along a specific path connecting high-symmetry points in the Brillouin zone [1].
Key Information Contained:
- Direct vs. Indirect Band Gaps: The band structure explicitly shows whether the minimum band gap occurs at the same k-point (direct) or different k-points (indirect).
- Band Dispersion and Curvature: The shape of the bands determines key transport properties, particularly the effective mass of charge carriers, which is inversely proportional to the band curvature [2].
- k-point Specificity: It provides a complete momentum-resolved picture of the electronic states.
Density of States (DOS)
The Density of States represents the number of available electronic states per unit volume per unit energy interval. It is computed by integrating over all k-points in the Brillouin zone and counts how many states are "packed" at each energy level, effectively discarding the momentum information [1].
Key Information Contained:
- Global Band Gap: The DOS reveals the fundamental band gap by showing energy regions with zero states between occupied valence bands and unoccupied conduction bands.
- State Density: Peak areas indicate high concentrations of electronic states at specific energies, which is crucial for understanding optical absorption and conductivity.
- Fermi Level Position: The DOS at the Fermi level determines whether a material is a metal, semiconductor, or insulator [1].
Table 1: Core Differences Between Band Structure and Density of States
| Feature | Band Structure | Density of States (DOS) |
|---|---|---|
| Independent Variable | Crystal momentum (k) along a specific path [1] | Energy (E) [1] |
| Information Retained | Direct/indirect nature of gaps, carrier effective mass [2] [1] | Total number of states at a given energy, global band gap [1] |
| Information Lost | Complete picture of states across the entire Brillouin Zone | Momentum (k-point) information [1] |
| Primary Use Case | Analyzing charge transport, identifying specific band extrema | Assessing overall conductivity, analyzing total state distribution [1] |
Root Causes of Apparent Discrepancies
k-Space Sampling and Integration
The most common source of discrepancy between band structure and DOS plots is inadequate k-point sampling during the DOS calculation.
- Band Structure Calculation: Typically performed along a high-symmetry path in the Brillouin zone using a dense, one-dimensional set of k-points.
- DOS Calculation: Requires a uniform, three-dimensional sampling of the entire Brillouin zone. If this sampling is too coarse, the integration fails to accurately capture the true density of states, leading to an inaccurate band gap [3].
Solution: Significantly increase the k-point density for the DOS calculation. For example, while a primary calculation might use a manageable grid, the DOS may require a much denser mesh (e.g., 200x200 or 300x300 for 2D materials) to converge the results and match the band structure gap [3].
Intrinsic Informational Differences
A discrepancy can also be a true physical reflection of the different information each plot conveys.
- Direct Gap in Band Structure vs. Global Gap in DOS: A band structure plot might show a direct gap at a specific high-symmetry point (e.g., the M point). However, the fundamental (smallest) band gap of the material could be an indirect gap between two different k-points (e.g., between the valence band maximum along the A-Z path and the conduction band minimum at the M point). The DOS reflects this global, indirect gap, which can be smaller than the direct gap observed at a single point in the band structure [4]. This is not an error but a correct representation of the material's electronic properties.
Smearing and Computational Parameters
The choice of computational parameters can artificially smear out the band gap in the DOS.
- Smearing: To improve convergence in metallic systems, a smearing function (e.g., Fermi-Dirac, Gaussian) is often applied. If the smearing width is too large, it can cause states to "bleed" into the gap region, making a semiconductor appear metallic or reducing the apparent band gap in the DOS [4].
- Tetrahedron Method: For DOS calculations on semiconductors and insulators, the tetrahedron method is generally preferred over Gaussian smearing, as it provides a more accurate integration over the Brillouin zone [3].
Methodological Protocols for Consistent Results
Protocol for Converged DOS Calculations
- Initial Calculation: Perform a standard self-consistent field (SCF) calculation with a moderate k-point grid to obtain the converged charge density.
- Non-SCF Restart: Restart from the converged configuration to calculate the DOS in a non-self-consistent calculation [2].
- Increase k-points: In this non-SCF step, use a significantly denser k-point mesh for the DOS than was used for the initial SCF convergence [3].
- Choose Appropriate Method: For semiconductors and insulators, employ the tetrahedron method for DOS integration. For metals, use a small smearing value that is appropriate for the system [3].
Protocol for Identifying the Fundamental Band Gap
- Analyze Band Structure: Examine the entire band structure path to locate the valence band maximum (VBM) and the conduction band minimum (CBM). Do not assume they are at the same k-point.
- Cross-reference with DOS: The gap observed in a properly converged DOS represents the fundamental (global) gap. Use this to verify the indirect gap between the VBM and CBM identified in the band structure.
- Use Analysis Tools: Advanced software (e.g., QuantumATK) can automatically report both direct and indirect band gaps from the band structure data, which should be compared against the DOS gap [2].
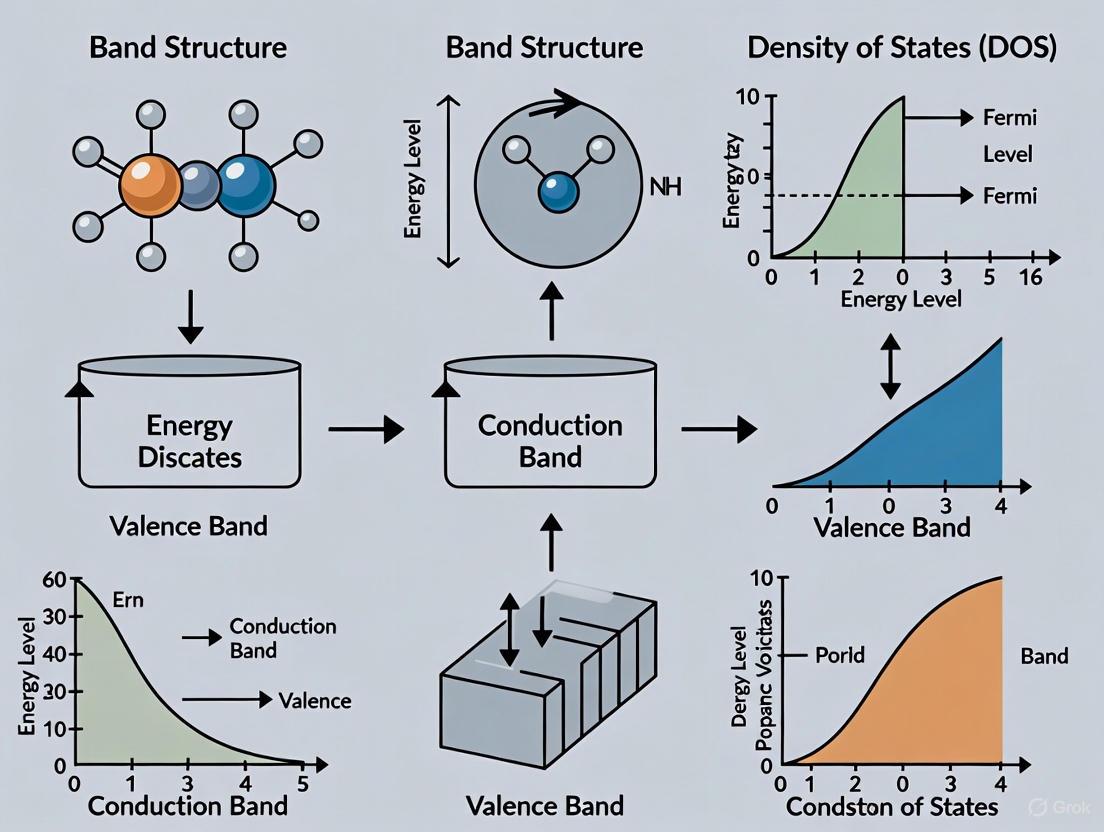
The logical workflow for diagnosing and resolving mismatches is summarized in the diagram below.
Advanced Analysis: Projected Density of States (PDOS)
Going beyond the total DOS, the Projected Density of States (PDOS) is an indispensable tool. It decomposes the total DOS into contributions from specific atoms, atomic shells (s, p, d, f), or orbitals [2] [1].
Key Applications of PDOS:
- Doping Analysis: PDOS can identify the orbital character of dopant-induced states within the band gap, explaining why doped materials exhibit enhanced visible-light absorption [1].
- Bonding Analysis: Overlap in the PDOS peaks of two adjacent atoms at the same energy indicates chemical bonding between them. This is crucial for understanding surface chemistry and adsorption strengths in catalysis [1].
- d-band Center Theory: For transition-metal catalysts, the position of the d-band center (relative to the Fermi level) derived from PDOS is a key descriptor for predicting catalytic activity [1].
Table 2: Essential "Research Reagent Solutions" in Computational Electronic Structure
| Item / Functional | Function | Example Use Case |
|---|---|---|
| PBE-GGA Functional | A standard exchange-correlation functional; computationally efficient but often underestimates band gaps. | Good for initial structural relaxations and metallic systems [4]. |
| HSE06 Hybrid Functional | Mixes a portion of exact Hartree-Fock exchange; significantly improves band gap prediction accuracy. | Achieving quantitative band gaps for semiconductors like Si [2]. |
| HSE06-DDH Functional | A dielectric-dependent hybrid that self-consistently determines the exact exchange fraction. | Accurate modeling of insulators with large band gaps, e.g., SiO₂ (quartz) [2]. |
| Tetrahedron Method | A smearing-free method for Brillouin zone integration. | Calculating highly accurate DOS for semiconductors and insulators [3]. |
| Projected DOS (PDOS) | Decomposes the total DOS into contributions from specific atoms or orbitals. | Identifying dopant states, analyzing chemical bonds, d-band center analysis [1]. |
Emerging Methodologies: Machine Learning for DOS
Recent advancements are leveraging machine learning (ML) to predict the electronic DOS directly from atomic structures, bypassing the computational expense of DFT. Universal ML models, such as PET-MAD-DOS, are trained on diverse datasets and can predict the DOS for a wide range of materials with semi-quantitative accuracy [5]. These models scale linearly with system size, making them suitable for large or complex systems like high-entropy alloys where traditional DFT is prohibitively costly. The predicted DOS can then be manipulated to obtain other properties, such as band gaps and electronic heat capacity, accelerating high-throughput material discovery [5].
How Flat Bands Create Peaks in Density of States
In the analysis of electronic structures, a common point of confusion arises when observations from band structures appear inconsistent with density of states (DOS) calculations. While band structure plots depict energy levels as functions of crystal momentum throughout the Brillouin zone, DOS represents the number of electronically allowed states at each energy level, integrated over all k-points [6]. This fundamental difference in what these two representations measure can lead to apparent contradictions, particularly when specific k-point dependent features in band structures don't manifest clearly in the integrated DOS profile.
The presence of flat bands in electronic band structures provides a crucial bridge between these two representations and represents an extreme case where band topology directly dictates DOS features. Flat bands, characterized by minimal electronic dispersion (E(k) ≈ constant), create intense peaks in the DOS because a large number of electronic states become concentrated within a narrow energy window [7] [8]. This phenomenon occurs because the DOS is inversely proportional to the band velocity (dE/dk) - as bands flatten, their velocity approaches zero, causing the DOS to diverge mathematically [6]. These flat band-induced DOS peaks have profound implications for material properties, enabling emergent quantum phenomena including magnetism, superconductivity, and correlated insulating states [9] [8].
Fundamental Principles: The Direct Relationship Between Flat Bands and DOS Peaks
Mathematical Foundation of the DOS-Flat Band Connection
The fundamental relationship between electronic band dispersion and density of states is mathematically defined by the formula:
[ g(E) = \frac{1}{(2\pi)^d} \int{BZ} \frac{dS}{|\nablak E(k)|} ]
where g(E) represents the density of states at energy E, the integral is taken over a constant energy surface in the Brillouin zone (BZ), dS denotes the surface element, and |∇ₖE(k)| is the magnitude of the band velocity [6]. This equation reveals the inverse relationship between band velocity and DOS - as the band dispersion flattens, |∇ₖE(k)| approaches zero, causing the DOS to diverge toward infinity.
This mathematical divergence manifests physically as sharp peaks in calculated DOS spectra. In experimental contexts, these divergences are known as Van Hove singularities [6]. While all band extrema create Van Hove singularities, flat bands produce particularly intense versions because the minimal dispersion persists across extensive regions of the Brillouin zone, rather than being confined to discrete high-symmetry points.
Physical Origins of Flat Bands in Quantum Materials
Flat bands emerge in specific quantum materials through several distinct mechanisms:
Quantum destructive interference: In frustrated lattices like kagome and Lieb lattices, the electronic wavefunction experiences completely coherent and destructive quantum interference, effectively localizing electrons and preventing their propagation through the crystal [7] [8]. In Nb₃I₈, for instance, this interference occurs in breathing kagome planes where different Nb-Nb distances in triangles create a semiconducting ground state with flat bands [7].
Surface states in topological systems: Rhombohedral graphite with N layers features flat-band surface states even in the infinite layer limit, where the electronic structure at zone corners becomes polarized on the outermost layers [9]. Theoretical work describes these systems as analogous to a Su-Schrieffer-Heeger model with an even number of lattice sites and dominant odd-numbered bonds, guaranteeing boundary-localized states [9].
Moiré superlattices: In twisted van der Waals heterostructures, the moiré potential creates flat bands at specific "magic" angles, as famously demonstrated in twisted bilayer graphene [8].
Table 1: Comparison of Flat Band Types and Their Characteristics
| Flat Band Type | Physical Origin | Material Examples | Key Characteristics |
|---|---|---|---|
| Geometric Frustration | Quantum destructive interference in frustrated lattices | Kagome metals (CsCr₃Sb₅), Nb₃I₈ | Intrinsic to crystal structure, electron localization |
| Topological Surface States | Boundary states in topological systems | Rhombohedral graphite [9] | Surface-localized, exist in macroscopic crystals |
| Moiré Flat Bands | Moiré potential in twisted heterostructures | Twisted bilayer graphene | Tunable by twist angle, require artificial stacking |
Computational Methodologies: Accurately Capturing DOS Peaks from Flat Bands
DFT Protocols for Resolving Flat Band-Induced DOS Features
Proper computational methodology is essential for accurately capturing the relationship between flat bands and DOS peaks. Several key considerations must be addressed:
k-point sampling represents perhaps the most critical parameter. Since DOS calculations integrate over the entire Brillouin zone, insufficient k-point density can artificially broaden sharp DOS features originating from flat bands. For 2D materials like graphene-based systems, calculations may require 200×200 to 300×300 k-point meshes for convergent DOS spectra [3]. This dense sampling is particularly important for detecting small band gaps that might appear in band structure plots but become smeared in DOS calculations with coarser k-grids [4] [3].
The tetrahedron method generally provides superior results for DOS calculations compared to Gaussian smearing, especially for resolving sharp features near the Fermi level [3]. This technique becomes particularly important when studying flat band materials, where traditional smearing methods can artificially broaden the intense DOS peaks.
Post-processing protocols should include band-unfolding techniques for supercell calculations and careful selection of k-path for band structure plots to ensure the computed path contains the actual band extrema [3]. Discrepancies between band structure and DOS gaps often occur when the chosen k-path misses the specific k-point where the minimal gap occurs [3].
Advanced Techniques for Flat Band Characterization
For comprehensive flat band analysis, researchers should employ:
Layer-resolved DOS calculations: In topological systems like rhombohedral graphene, layer-projected DOS reveals surface state contributions [9]. Implementation requires calculating the out-of-plane electric dipole moment per carrier, p/ne = Σᵢ₌₁ᴺ|ψᵢ|²(2i-N-1)/(N-1), where ψᵢ represents the wavefunction amplitude on layer i [9].
Joint density of states (JDOS) calculations: For optoelectronic applications, JDOS combined with dipole transition matrix elements |M꜀ᵥ|² = ⟨c|Hₒₚ|v⟩ predicts optical absorption spectra, explaining why flat band materials like Nb₃I₈ show enhanced infrared absorption beyond what bandgap alone would suggest [7].
Table 2: Computational Parameters for Accurate Flat Band DOS Calculations
| Computational Parameter | Recommended Value/Method | Impact on Flat Band DOS Features |
|---|---|---|
| k-point Density | 200×200 to 300×300 for 2D materials [3] | Prevents artificial smearing of sharp DOS peaks |
| Smearing Method | Tetrahedron method preferred [3] | Better resolves Van Hove singularities from flat bands |
| Band Structure k-path | Ensure path contains true band extrema [3] | Eliminates apparent band structure-DOS discrepancies |
| Exchange-Correlation Functional | PBE-GGA, with possible Hubbard U correction | Affects flat band position relative to EF |
| Spin Treatment | Collinear or non-collinear magnetism as needed | Captures spin-polarized flat bands in magnetic systems |
Experimental Validation: Measuring Flat Band DOS Peaks in Real Materials
Direct Experimental Detection Techniques
Several advanced experimental methods provide direct evidence for flat band-induced DOS peaks:
Angle-resolved photoemission spectroscopy (ARPES) simultaneously measures both band dispersion (E vs. k) and energy distribution curves that reflect the DOS [8]. In CsCr₃Sb₅, ARPES directly visualized flat bands approximately 60 meV below the Fermi level that create pronounced DOS enhancements [8]. These measurements confirmed a ~20 meV downward shift of the flat band below the charge density wave transition temperature (T꜀ᴅᴡ = 54 K), demonstrating how electronic orders affect flat band positions [8].
Scanning tunneling microscopy (STM) and spectroscopy directly probe the local DOS with atomic-scale resolution. While not explicitly discussed in the search results, this technique provides complementary real-space information about flat band-induced DOS variations.
Layer-resolved capacitance measurements in rhombohedral graphene devices directly quantify surface state polarization [9]. The experimental setup applies small finite-frequency excitation voltages to the sample while measuring response currents on top and bottom gates separately, enabling quantification of how electronic states are distributed across different layers [9].
Correlation with Physical Properties
Flat band-induced DOS peaks directly enhance electronic correlations and enable emergent quantum phases:
Superconductivity: In rhombohedral graphene, flat band surface states host superconducting states localized to single surfaces [9]. These superconductors appear on the unpolarized side of density-tuned spin transitions and show strong violations of the Pauli limit, consistent with dominant attractive interactions in spin-triplet, valley-singlet pairing channels [9].
Magnetism: CsCr₃Sb₅ exhibits both charge order and magnetic order simultaneously below 54 K [8]. Resonant inelastic X-ray scattering (RIXS) measurements reveal non-dispersive magnetic excitations that evolve across the phase transition, largely consistent with the observed flat band shift [8].
Optoelectronic response: In Nb₃I₈, the combined high DOS and dipole transition probability from flat bands creates enhanced short-wave infrared absorption with a slow decay of the absorption trend toward the bandgap [7]. This enables unusual photodetection capabilities spanning short-wave to very long-wave infrared regions.
Table 3: Essential Computational and Experimental Resources for Flat Band DOS Studies
| Resource/Technique | Function/Purpose | Key Applications in Flat Band Research |
|---|---|---|
| Density Functional Theory Codes (Quantum ESPRESSO, VASP) | First-principles electronic structure calculation | Calculating band structures and projected DOS for flat band materials [4] |
| ARPES System | Direct measurement of band dispersion and DOS | Experimental verification of flat bands near EF [8] |
| Layer-Resolved Capacitance Setup | Quantifying surface state polarization | Detecting surface-localized flat bands in topological materials [9] |
| RIXS Spectrometer | Measuring magnetic excitations | Probing spin correlations in flat band systems [8] |
| High-k-point DOS Calculations | Accurate DOS integration | Resolving sharp features from flat bands (200×200+ k-points) [3] |
The profound connection between flat bands and DOS peaks provides a fundamental resolution to the apparent paradox between band structure and DOS observations. Flat bands represent an extreme case where specific k-space features directly dominate integrated DOS profiles through their minimal dispersion. This relationship is mathematically rigorous, experimentally verifiable, and physically significant for understanding emergent quantum phenomena in condensed matter systems.
The experimental observations in quantum materials like CsCr₃Sb₅, Nb₃I₈, and rhombohedral graphene consistently demonstrate that flat bands near the Fermi energy create characteristic DOS peaks that drive electronic instabilities toward correlated states including magnetism and superconductivity [9] [7] [8]. Proper computational methodology with sufficient k-point sampling and appropriate smearing techniques is essential for accurately capturing these relationships in theoretical calculations [3].
Understanding this fundamental connection enables researchers to not only reconcile apparent discrepancies between different electronic structure characterization methods but also to strategically design materials with enhanced DOS features for specific applications in superconductivity, optoelectronics, and quantum information science. The study of flat bands and their DOS signatures continues to reveal surprising emergent phenomena in quantum materials and represents an active frontier in condensed matter physics.
Diagrams
Diagram 1: Relationship Between Band Structure and DOS
Diagram 2: Experimental Workflow for Flat Band DOS Verification
Table of Contents
- Introduction: The Critical Role of Band Structure
- Fundamental Concepts: Band Gaps and Density of States
- The Inherent Limitations of DOS in Band Gap Analysis
- Mechanisms for Band Gap Transitions: Insights from Research
- Methodologies for Probing Band Structure and DOS
- Conclusion and Outlook
The electronic band structure is a foundational concept in solid-state physics and materials science, dictating the electrical and optical properties of semiconductors and insulators. The nature of the band gap—whether it is direct or indirect—profoundly influences a material's efficiency in applications such as light-emitting diodes (LEDs), lasers, and photovoltaics [10]. A direct band gap permits efficient radiative recombination of electrons and holes, leading to strong light emission. In contrast, an indirect band gap requires a third particle, a phonon, to conserve momentum, resulting in significantly weaker and less efficient light emission [10] [11].
Despite its importance, interpreting the band gap from a standard computational tool—the Density of States (DOS)—can be misleading. A common challenge in computational research is the apparent mismatch between the band gap value extracted from a band structure plot and that inferred from the DOS diagram [12] [3]. This guide delves into the fundamental reasons for this discrepancy, exploring the physical origins of direct and indirect gaps and how their distinct characteristics are reflected—or obscured—in the DOS. By framing this discussion within the context of advanced materials research, we aim to provide a clear technical framework for accurately interpreting electronic structure calculations.
Fundamental Concepts: Band Gaps and Density of States
Defining Direct and Indirect Band Gaps
The key distinction between a direct and indirect band gap lies in the crystal momentum (k-vector) of the charge carriers.
- Direct Band Gap: The valence band maximum (VBM) and the conduction band minimum (CBM) occur at the same k-point in the Brillouin zone. This allows a direct, vertical transition of an electron from the valence to the conduction band upon photon absorption, and vice-versa for emission.
- Indirect Band Gap: The VBM and CBM occur at different k-points. A photon-assisted transition between these states requires the simultaneous involvement of a phonon (a quantum of lattice vibration) to conserve momentum, making it a second-order process that is less probable.
The following diagram illustrates the fundamental difference in the recombination pathways for direct and indirect band gaps.
The Density of States (DOS)
The Density of States (DOS) describes the number of electronic states per unit volume per unit energy. It provides a wealth of information, including the band gap energy, as seen by a drop in the DOS to zero between the valence and conduction bands. It can also reveal the orbital character of the bands through Projected DOS (PDOS). However, the DOS is an integrated quantity over the entire Brillouin zone; it sums contributions from all k-points. Consequently, it contains no information about the crystal momentum of the electrons [13]. This is the primary source of discrepancy with band structure plots.
Table 1: Key Properties from Band Structure and DOS Analysis [13]
| Property | How to Deduce from Band Structure | How to Deduce from DOS |
|---|---|---|
| Band Gap | Energy difference between CBM and VBM. | Energy range where DOS is zero. |
| Gap Type (Direct/Indirect) | Check if CBM and VBM are at the same k-point. | Cannot be determined. |
| Effective Mass | From the curvature of bands at the CBM/VBM. | Cannot be determined. |
| Orbital Character | Requires projected band structure. | From Projected DOS (PDOS). |
| Metallic/Semiconducting | Bands cross Fermi level? | Finite DOS at Fermi level? |
The Inherent Limitations of DOS in Band Gap Analysis
The core issue of "mismatch" between band structure and DOS often arises from two main technical and conceptual challenges.
The k-Space Integration Problem
The band structure is a plot of energy levels along a specific, high-symmetry path of k-points. To find the fundamental band gap, one must identify the global CBM and VBM across this path. In contrast, the DOS is computed by integrating over a dense, three-dimensional mesh of k-points spanning the entire Brillouin zone [13]. If the k-point mesh used for the DOS calculation is not sufficiently dense, it may fail to sample the precise k-point where the CBM or VBM resides. This can result in a DOS that shows a small but finite value in the gap region or a band gap that appears smaller than the true fundamental gap deduced from the band structure [12] [3].
For example, on a computational forum, a user reported a persistent mismatch even after varying k-points and smearing methods. An expert suggested that the solution might require a significantly increased k-point density (e.g., 200x200 or 300x300 for a 2D material) specifically for the DOS calculation to ensure all critical points are captured [3].
Misidentification of the Band Gap Type
A more fundamental error occurs when researchers attempt to classify a material as direct or indirect based solely on the DOS. Since the DOS integrates over all k-points, it is inherently incapable of providing this information. A material with an indirect gap can have a DOS that looks nearly identical to that of a material with a direct gap of the same magnitude. The definitive classification can only be made by inspecting the band structure plot to compare the k-points of the VBM and CBM [13].
Mechanisms for Band Gap Transitions: Insights from Research
Modern materials engineering has developed multiple strategies to induce a transition from an indirect to a direct band gap, dramatically altering a material's optical properties. These strategies highlight the critical role of specific k-space interactions.
Table 2: Experimental and Computational Methodologies for Band Structure Analysis
| Method Category | Specific Technique | Key Measurable Output | Primary Application |
|---|---|---|---|
| Computational | Density Functional Theory (DFT) | Band structure, DOS, orbital projections [14] [11] [15] | Predictive material design. |
| Hybrid Functionals (HSE06) | Corrected band gap energies [15] [16] [17] | Improved accuracy for excited states. | |
| Maximally Localized Wannier Functions (MLWFs) | Sparse, chemically interpretable TB models [11] | Bonding analysis and interpretation. | |
| Experimental | Photoluminescence (PL) Spectroscopy | Photoluminescence Quantum Yield (PLQY), emission wavelength [10] | Verification of direct gap and efficiency. |
| Ultraviolet Photoelectron Spectroscopy (UPS) | Valence Band Maximum (VBM) relative to vacuum level [10] | Experimental band alignment. | |
| X-ray Diffraction (XRD) | Crystal structure, phase purity, strain [10] | Correlating structure with electronic properties. |
Quantum Confinement and Hybridization
A powerful demonstration comes from a 2024 study on gallium phosphide (GaP), a classic indirect gap semiconductor. Researchers achieved an indirect-to-direct bandgap transition by growing a monolayer-thin GaP "quantum shell" on a ZnS nanocrystal core [10]. This created a reverse-type I heterojunction, confining charge carriers within the GaP shell. Density functional theory (DFT) calculations revealed that the ZnS core hybridizes its electronic states with GaP, modifying the orbital interactions and shifting the conduction band minimum to the Γ point. This transition was confirmed experimentally by a record-high photoluminescence quantum yield (PLQY) of 45.4% at 409 nm, a feat impossible for bulk, indirect-gap GaP [10].
Strain Engineering
Applying external pressure is a clean method to tune band structures without chemical modification. Research on the chiral layered semiconductor SnP₂Se₆ showed a pressure-induced indirect-to-direct bandgap transition at approximately 26 GPa [14]. This transition was driven by enhanced hybridization between Sn-s and Se-p orbitals and distortion of the crystal lattice octahedra under pressure, which selectively shifted the energy levels at different k-points. This change was accompanied by significant enhancements in optical absorption and conductivity [14].
Chemical Functionalization and Doping
Surface chemistry can be used to tailor band structures. A study on TH-BP (a tetrahexagonal boron phosphide structure) demonstrated that surface adsorption of hydrogen or fluorine atoms could trigger a transition from an indirect to a direct bandgap [17]. The adsorption transforms the hybridization of specific atoms from sp² to sp³, breaking double π-bonds and eliminating the energy bands responsible for the indirect gap. Similarly, minor Ga doping (less than 10%) in NaSbS₂ was theoretically predicted to induce an indirect-to-direct transition [18].
Twisting and Stacking in 2D Materials
In van der Waals materials, the interlayer twist angle is a potent degrees of freedom. First-principles calculations on transition metal dichalcogenide (TMDC) homobilayers (e.g., MoS₂, WS₂) have shown that specific "critical" twist angles (e.g., 17.9° and 42.1°) can create symmetric Moiré patterns that lead to direct band gaps, unlike the natural bilayer which may have an indirect gap [15]. Furthermore, constructing heterostructures from different 2D materials, such as the MoSi₂N₄/BP bilayer, can also result in a direct band gap at the K-point, even when one of the constituent monolayers (MoSi₂N₄) is an indirect gap semiconductor [16].
The following workflow summarizes the multi-faceted approach required to correctly characterize and engineer a material's band structure.
Methodologies for Probing Band Structure and DOS
Computational First-Principles Calculations
Density Functional Theory (DFT) is the workhorse for computing electronic structures. The Generalized Gradient Approximation (GGA-PBE) is commonly used but often underestimates band gaps. For greater accuracy, especially for predicting optical properties, hybrid functionals like HSE06 are employed, which mix a portion of exact Hartree-Fock exchange [15] [16] [17]. To interpret the complex band structures of 3D materials, techniques like Maximally Localized Wannier Functions (MLWFs) are used to create sparse, chemically interpretable tight-binding models from DFT outputs. This approach was key to deconvoluting the competition between first and second nearest-neighbor bonds that give silicon its indirect gap [11].
Experimental Verification Techniques
Computational predictions require experimental validation. Photoluminescence (PL) spectroscopy is a direct probe of radiative recombination efficiency. A strong band-edge emission is a hallmark of a direct band gap, as demonstrated by the bright violet emission from ZnS/GaP quantum shells [10]. Ultraviolet Photoelectron Spectroscopy (UPS) measures the energy of the valence band maximum, helping to construct the real-world band alignment of heterostructures [10]. Finally, X-ray Diffraction (XRD) confirms the crystal structure and phase purity, ensuring that the measured properties are not due to impurity phases [10].
Table 3: Essential Research Reagents and Computational Tools
| Item / Code | Function / Description | Example Use Case |
|---|---|---|
| WIEN2k | A software package for electronic structure calculations using the FP-LAPW method. | Calculating electronic properties of solids under pressure [14]. |
| VASP | A package for performing ab initio quantum mechanical calculations using PAW pseudopotentials. | Studying surface functionalization of 2D materials like TH-BP [17]. |
| HSE06 Functional | A hybrid exchange-correlation functional in DFT that provides more accurate band gaps. | Correcting the band gap underestimation in TMDC heterostructures [15] [16]. |
| GaP & ZnS Precursors | Chemical sources for Gallium, Phosphorus, Zinc, and Sulfur for nanocrystal synthesis. | Colloidal synthesis of ZnS/GaP core/quantum shell structures [10]. |
The distinction between direct and indirect band gaps is a cornerstone of semiconductor physics with profound implications for device performance. While the Density of States is a vital tool for assessing the band gap energy and orbital contributions, it is inherently limited because it integrates over momentum space. Relying on it to determine the direct or indirect nature of a gap is a fundamental error that can lead to misinterpretation of a material's potential.
The apparent mismatch between band structure and DOS often stems from inadequate k-point sampling in calculations or a misunderstanding of what information each one provides. Resolving this requires a rigorous computational approach, using sufficiently dense k-point meshes and specialized techniques like Wannier interpolation for accurate DOS. The growing field of band structure engineering—through quantum confinement, strain, chemical functionalization, and the twisting of 2D layers—provides a powerful toolkit for transforming indirect gap materials into direct ones, unlocking new possibilities for high-efficiency optoelectronics. A critical and integrated understanding of both band structure and DOS, complemented by robust experimental validation, remains essential for advancing the design of next-generation semiconductor materials.
The Role of k-space Sampling and Brillouin Zone Integration
In computational materials science, predicting the electronic properties of crystalline materials requires careful sampling of the reciprocal space, known as k-space. The Brillouin zone represents the fundamental unit in this reciprocal space, and its integration is paramount for calculating key electronic properties such as the band structure and the density of states (DOS). A frequent challenge arises when these two fundamental properties appear inconsistent; the band structure may indicate a metallic character while the DOS suggests a semiconductor, or vice versa. Often, this discrepancy does not stem from physical phenomena but from inadequate k-space sampling during the computational process. This guide details the principles of k-space sampling, explores integration methodologies, and provides protocols to diagnose and resolve mismatches between band structure and DOS calculations, ensuring physically accurate and reliable results.
Fundamentals of k-space and the Brillouin Zone
In periodic materials, the arrangement of atoms is described by a lattice in real space. The corresponding reciprocal lattice is defined by its basis vectors, and the Brillouin Zone is the primitive cell of this reciprocal lattice. Electronic wavefunctions in a crystal are described by Bloch's theorem, which introduces the wavevector k as a quantum number confined within the Brillouin zone.
The calculation of macroscopic electronic properties involves integrating over all possible k-points in the Brillouin zone. For instance, the DOS, ( g(E) ), is computed as: [ g(E) = \frac{1}{N{\mathbf{k}}} \sum{\mathbf{k}} \delta(E - E{\mathbf{k}}) ] where ( E{\mathbf{k}} ) is the energy eigenvalue at point k. Similarly, the total energy of the system is an integral over the occupied electron states in k-space. Since an infinite number of k-points exist within the Brillouin zone, practical computations require a finite sampling of representative points, making the choice of sampling method critical for accuracy.
k-space Sampling Methodologies
The two primary families of methods for Brillouin zone integration are the regular grid approach (including Monkhorst-Pack) and the symmetric grid approach (tetrahedron method). Each has distinct advantages and is suited to different material classes.
Regular Grids and the Monkhorst-Pack Scheme
The Monkhorst-Pack scheme is a widely used method for generating a uniform set of k-points within the Brillouin zone [19]. The k-points are given by:
[
\mathbf{k} = \sum{i=1}^{3} \frac{2ni - Ni - 1}{2Ni} \mathbf{b}i
]
where ( ni = 1, 2, ..., Ni ), size = (N_1, N_2, N_3) specifies the grid density, and the ( \mathbf{b}i )'s are the reciprocal lattice vectors [19]. This scheme generates a grid that efficiently samples the Brillouin zone and can include the Γ-point (0,0,0).
The quality of this grid is often determined by the length of the shortest real-space lattice vector. As this vector increases, the reciprocal vector shrinks, and fewer k-points are required. The table below outlines typical k-points per lattice vector for different quality settings [20].
Table 1: Regular K-Space Grid Quality Settings and Corresponding K-Points
| Lattice Vector Length (Bohr) | Basic | Normal | Good | VeryGood | Excellent |
|---|---|---|---|---|---|
| 0-5 | 5 | 9 | 13 | 17 | 21 |
| 5-10 | 3 | 5 | 9 | 13 | 17 |
| 10-20 | 1 | 3 | 5 | 9 | 13 |
| 20-50 | 1 | 1 | 3 | 5 | 9 |
| 50+ | 1 | 1 | 1 | 3 | 5 |
It is also possible to manually specify the number of k-points along each reciprocal lattice vector for finer control [20].
Symmetric Grids and the Tetrahedron Method
The symmetric grid samples only the irreducible wedge of the Brillouin zone, which is the smallest portion that is symmetrically unique. This method is particularly crucial for systems where high-symmetry points are essential for capturing the correct physics, such as in graphene. For these materials, a regular grid might miss these critical points, leading to inaccurate results [20].
The tetrahedron method is a common symmetric approach that divides the irreducible wedge into tetrahedra and uses linear or quadratic interpolation within each tetrahedron to compute integrals. The accuracy is controlled by an integer parameter KInteg [20]:
- Even values: Linear tetrahedron method.
- Odd values: Quadratic tetrahedron method.
- A value of 1 uses only the Γ-point.
As a rule of thumb, the KInteg parameter should be roughly half the number of k-points in a corresponding regular grid to achieve a similar number of unique k-points [20].
The Critical Impact of Sampling on Accuracy and Performance
The choice of k-space sampling directly controls the trade-off between the accuracy of the calculation and the computational cost (CPU time and memory).
Table 2: Effect of K-Space Quality on Formation Energy and Computational Cost for Diamond
| KSpace Quality | Energy Error per Atom (eV) | CPU Time Ratio |
|---|---|---|
| Gamma-Only | 3.3 | 1 |
| Basic | 0.6 | 2 |
| Normal | 0.03 | 6 |
| Good | 0.002 | 16 |
| VeryGood | 0.0001 | 35 |
| Excellent | reference | 64 |
Data adapted from SCM BAND documentation [20].
The table above demonstrates that while increasing k-space quality rapidly improves accuracy, it comes at a significant computational cost. However, for certain properties like formation energies, errors can be systematic and may partially cancel out when calculating energy differences [20].
The required k-space quality is highly system-dependent:
- Insulators and wide-gap semiconductors: Often suffice with Normal quality.
- Metals, narrow-gap semiconductors, and geometry optimizations under pressure: Good quality is highly recommended [20].
- Band gap prediction: Normal quality is frequently insufficient. Good quality or higher is recommended, especially for narrow-gap systems [20].
Diagnosing and Resolving Band Structure and DOS Mismatches
A mismatch between the band structure and the DOS is a common symptom of inadequate k-space sampling. The band structure is typically calculated along a high-symmetry path, while the DOS requires a dense, uniform sampling of the entire Brillouin zone.
Protocol for Convergence Testing
A systematic approach is required to ensure that k-space sampling is sufficient.
- Initial Calculation: Perform a calculation with a moderate k-point grid (e.g.,
Normalquality). - Property Extraction: Calculate the target properties (e.g., total energy, band gap, DOS at Fermi level).
- Grid Refinement: Iteratively increase the k-point density (e.g., to
Good,VeryGood). - Convergence Criterion: The property of interest is considered converged when the change between successive calculations falls below a predefined threshold (e.g., 1 meV for energy, 0.01 eV for band gap).
- Final Calculation: Use the converged k-point grid for all production calculations.
This workflow can be visualized as follows:
High-Symmetry Points and Material-Specific Considerations
For some materials, a dense but poorly chosen grid can still yield incorrect results if it misses a critical high-symmetry point. A notable example is graphene, whose famous Dirac cone exists at the K point in the Brillouin zone.
Table 3: Inclusion of the 'K' Point in Regular Grids for Graphene
| Grid Size | Point 'K' Included? | Equivalent K-Grid Quality |
|---|---|---|
| 5x5 | No | Normal |
| 7x7 | Yes | - |
| 9x9 | No | Good |
| 13x13 | Yes | VeryGood |
Data from SCM BAND documentation [20].
As shown, a 5x5 or 9x9 grid misses the K point entirely, which would result in a completely wrong prediction of graphene's electronic properties. In such cases, using a symmetric grid is the most robust solution, as it is designed to always include all high-symmetry points in the irreducible wedge [20].
The following table details key software and computational tools used in the field for k-space sampling and electronic structure analysis.
Table 4: Key Research Tools for k-Space Sampling and Analysis
| Tool / Resource | Function / Purpose | Example Use Case |
|---|---|---|
| ASE (Atomic Simulation Environment) | A Python package for setting up, controlling, and analyzing atomistic simulations [19]. | Generating Monkhorst-Pack k-point grids and band paths for various crystal structures [19]. |
| VASP | A first-principles DFT code for electronic structure calculations [21] [22]. | Performing geometry optimization and band structure calculations using PAW pseudopotentials. |
| BAND | A DFT code specialized in electronic structure analysis of molecules and solids [20]. | Implementing regular and symmetric k-space grids with automated quality settings. |
| Materials Project Database | A open database of computed material properties for over 150,000 inorganic compounds [23]. | Retrieving pre-computed band structures and DOS for validation and comparison. |
| Setyawan-Curtarolo High-Symmetry Points | A standardized set of high-symmetry points for all 14 Bravais lattices [19]. | Defining a consistent and comparable band path for plotting band structures. |
Advanced Applications and Future Directions
The principles of k-space sampling extend beyond simple bulk crystals. In complex modern materials, precise sampling is more critical than ever.
- Layered Intercalation Compounds: Used in batteries and superconductors, these materials can change space group upon intercalation, making direct band structure comparison difficult. Recent databases now provide band structures calculated on k-paths consistent with the host material, enabling direct analysis of intercalation-induced changes [23].
- Van der Waals Heterostructures: Stacking different 2D materials can create emergent electronic properties. Robust k-space sampling is essential to capture the effects of interlayer coupling, which can lead to fully delocalized bands or topologically non-trivial surface states across the heterostructure [21].
- Bridging Simulation and Experiment: Workflows that combine density functional theory (DFT), machine-learned interatomic potentials, and molecular dynamics are being developed to simulate experimental signatures, such as inelastic neutron scattering spectra. Accurate k-space sampling in the underlying DFT calculations is foundational to the predictive power of these workflows [24].
K-space sampling is a foundational aspect of computational materials science that directly determines the accuracy and reliability of calculated electronic properties. Discrepancies between band structure and density of states often trace back to an insufficient or inappropriate k-point grid. Researchers must systematically perform convergence tests and select the correct sampling methodology—regular grids for general purposes or symmetric grids for high-symmetry systems—to ensure their computational results are physically meaningful. As the field progresses towards more complex materials and integrated computational-experimental workflows, a deep understanding of Brillouin zone integration remains indispensable.
Why Perfect Agreement is Theoretically Unexpected
In solid-state physics, the electronic band structure and the density of states (DOS) are two fundamental concepts used to describe the electronic properties of materials. The band structure illustrates the allowed energy levels that electrons can occupy as a function of their crystal momentum (wavevector, k), effectively providing an energy-momentum relationship for electrons within a solid [25]. The density of states, on the other hand, describes the number of electronic states available at each energy level that electrons can occupy, integrated over all possible k-vectors in the Brillouin zone [25]. While both properties are derived from the same underlying quantum mechanical framework, they represent different projections of the electronic energy spectrum. The band structure is a k-resolved property, offering momentum-dependent details, whereas the DOS is an energy-resolved integral property that sums over all k-points. This fundamental difference in what they measure is the primary reason why perfect, point-for-point agreement between them is not theoretically expected. Their complementary nature means that discrepancies, particularly in the precise value of band gaps or the sharpness of spectral features, are not necessarily indicators of computational error but are often a direct consequence of their distinct physical definitions and the practical approximations used in calculations.
The electronic band structure of a solid is determined by solving the Schrödinger equation for electrons in a periodic crystal lattice, which gives Bloch states as solutions: ψnk(r) = e^(ik·r) unk(r), where n is the band index, k is the wavevector, and u_nk(r) is a function with the same periodicity as the crystal lattice [25]. The wavevector k is confined to the first Brillouin zone. In practice, band structure is visualized by plotting the energy eigenvalues E_n(k) for k-values along specific high-symmetry paths connecting points like Γ, Δ, Λ, and Σ [25].
The density of states, g(E), is defined as the number of electronic states per unit volume per unit energy. It is mathematically related to the band structure via an integral over the Brillouin zone [25]. This integral nature of the DOS means it lacks the momentum-specific information present in a band structure plot.
Table: Fundamental Characteristics of Band Structure and Density of States
| Feature | Band Structure | Density of States (DOS) |
|---|---|---|
| Primary Variable | Energy vs. wavevector (E vs. k) | Number of states vs. energy (g(E) vs. E) |
| k-space Resolution | High (shows specific paths) | None (integrated over entire Brillouin zone) |
| Reveals Direct/Indirect Band Gap | Yes | No |
| Shows Band Dispersion | Yes | No |
| Reveals Fermi Surface | Via constant-energy plots | No |
Diagram: Origins of Theoretical Mismatch. This workflow illustrates how band structure and DOS, derived from the same quantum mechanical foundation, inherently differ in their k-space sampling and final informative output, leading to expected mismatches.
The k-Space Sampling Discrepancy
The most significant source of inherent disagreement lies in how the two calculations sample k-space. A band structure plot is typically computed along a one-dimensional path connecting high-symmetry points in the Brillouin zone. In contrast, the DOS calculation requires a dense, uniform sampling of the entire two- or three-dimensional Brillouin zone [3]. Consequently, the band structure might not pass through the specific k-point where the conduction band minimum (CBM) or valence band maximum (VBM) occurs, especially if the band gap is indirect. The DOS, integrating over all k-points, will always reflect the true, global band gap because it captures the CBM and VBM regardless of their location in k-space. This explains why a user might find that "the band gap obtained in DOS is smaller than the band gap obtained from band structure" [3]. The band structure path simply missed the precise points where the band extrema are located.
Methodological and Numerical Limitations
Beyond fundamental definitions, practical computational methods introduce additional sources of divergence.
Smearing and k-point Density: In any numerical calculation, the number of k-points is finite. For DOS calculations, a high density of k-points is required to accurately capture the electronic states, especially in materials with complex Fermi surfaces or sharp spectral features [25]. To converge the DOS, a smearing function (e.g., Gaussian or tetrahedron method) is often applied [3]. The choice and width of this smearing function can artificially broaden DOS peaks and alter the apparent band gap, leading to a mismatch with the discrete band structure data. As noted in a forum discussion, using the tetrahedron method with significantly increased k-point density (e.g., 200x200 or 300x300 for 2D materials) is often necessary to achieve better agreement [3].
The Challenge of Non-Crystalline and Complex Materials: Standard band structure theory relies on the assumption of a perfect, infinite, and homogeneous crystal lattice [25]. These assumptions break down in real-world materials. Near surfaces, interfaces, or dopant atoms, the bulk band structure is disrupted, leading to localized states within the band gap that may be prominent in the DOS but absent from a idealized band structure plot [25]. Furthermore, in strongly correlated materials or amorphous solids, the concept of a well-defined, k-dependent band structure becomes less meaningful, making direct comparison with DOS problematic [25].
Experimental Protocols for Computational Validation
To ensure the reliability of electronic structure calculations, a rigorous methodology for calculating and comparing band structure and DOS is essential. The following protocol outlines the key steps.
Computational Workflow for Electronic Structure
- Geometry Optimization: Begin with a fully relaxed crystal structure to ensure the atomic positions and lattice parameters are at their ground-state configuration.
- Self-Consistent Field (SCF) Calculation: Perform a converged DFT calculation to obtain the ground-state charge density. This step requires a dense, uniform k-point grid (e.g., a Monkhorst-Pack grid) spanning the entire Brillouin zone. The convergence of the total energy with respect to the number of k-points must be verified.
- Density of States Calculation: Using the converged charge density from the SCF calculation, compute the DOS on an even denser k-point grid. It is critical to test different smearing methods (Gaussian, tetrahedron) and widths to ensure the results are physically meaningful and not artifacts of the numerical scheme [3].
- Band Structure Calculation: Using the same converged charge density, compute the electronic energies along a high-symmetry path in the Brillouin zone. This path is chosen to highlight important features like band gaps and effective masses.
Table: Key Research Reagent Solutions in Computational Materials Science
| Item / Software Function | Function in Electronic Structure Analysis |
|---|---|
| Density Functional Theory (DFT) | The foundational computational method to solve for the electronic structure of many-body systems. |
| Plane-Wave Basis Set | A set of functions used to expand the electronic wavefunctions, particularly efficient for periodic systems. |
| Pseudopotential | Replaces the strong Coulomb potential of atomic nuclei and core electrons, simplifying the calculation for valence electrons. |
| k-point Grid | A discrete sampling of the Brillouin zone; a dense grid is a crucial "reagent" for converging DOS calculations [3]. |
| Smearing Function | A mathematical function (e.g., Gaussian) applied to energy levels to improve convergence of metallic systems and DOS. |
| Tetrahedron Method | An advanced integration technique for k-space that is often more accurate than Gaussian smearing for DOS and band gaps [3]. |
| GW Approximation | A higher-level method beyond standard DFT to compute more accurate quasiparticle band structures [26]. |
Validation and Comparison Protocol
- Band Gap Comparison: Do not expect the band gaps from band structure and DOS to be identical. Instead, identify the minimum direct gap from the band structure and the minimum fundamental gap from the DOS. A discrepancy, particularly where the DOS gap is smaller, strongly suggests an indirect band gap that the chosen k-path did not capture.
- k-point Convergence Test: Systematically increase the density of the k-point grid used in the SCF and DOS calculations until the key features of the DOS (e.g., band gap, peak positions) no longer change significantly. For 2D materials, this may require grids as large as 200x200 or 300x300 [3].
- Smearing Sensitivity Analysis: Compare DOS calculations performed with different smearing methods and widths. A physically correct result should not be overly sensitive to reasonable choices of this parameter. The tetrahedron method is generally preferred for accurate band gap determination from DOS [3].
- Advanced Verification: For critical results, compare with higher-fidelity methods like the GW approximation [26] or experimental data. Machine learning models are now being trained to predict accurate GW band structures from DFT outputs, highlighting the systematic discrepancies that exist even between different computational methods [26].
Quantitative Analysis of Discrepancies
The divergence between band structure and DOS is not merely theoretical but has quantifiable impacts on predicted material properties. A central example is the band gap problem. In one reported case, a user found a clear mismatch where the band gap from the DOS was smaller than that from the band structure [3]. This is a classic signature of an indirect band gap material, where the DOS correctly identifies the global extrema, while the band structure plot along a limited path does not.
Furthermore, different levels of theory yield different results. For instance, using standard DFT with semi-local functionals, the mean absolute error on the calculated bandgap for a set of semiconductors and insulators can be as high as 2.05 eV compared to experiment. When the more advanced G0W0 method is used, this error drops to about 0.31 eV [26]. This shows that the very definition of the "correct" band structure is method-dependent. A machine learning study aiming to predict G0W0 corrections from DFT data found state-specific corrections ranging from 0 to 3 eV, with an average of 1.17 eV [26]. These significant corrections underscore that discrepancies are not just between DOS and band structure, but between different theoretical descriptions of the electronic structure itself.
Table: Quantitative Impact of Methodology on Electronic Structure Predictions
| Methodological Factor | Quantitative Impact / Requirement | Consequence for BS/DOS Agreement |
|---|---|---|
| k-point Density (2D Materials) | Requirement of 200x200 to 300x300 grids for DOS convergence [3] | Lower densities cause spurious mismatches in band gaps and peak shapes. |
| DFT Band Gap Error | Mean absolute error of ~2.05 eV vs. experiment [26] | Both BS and DOS are similarly inaccurate, but may not agree on the inaccurate value. |
| G0W0 Band Gap Error | Mean absolute error of ~0.31 eV vs. experiment [26] | Provides a more reliable benchmark for assessing lower-level DFT results. |
| G0W0 State Correction | Average correction of 1.17 eV to DFT states, ranging from 0-3 eV [26] | Highlights inherent discrepancies even between theoretical methods. |
The pursuit of perfect numerical agreement between band structure and density of states is a misapplication of computational resources. Their inherent physical differences—with band structure providing k-resolved information along a path and DOS providing an energy-resolved integral over the entire Brillouin Zone—make some level of disagreement not only expected but theoretically justified. The most common practical manifestations are differing band gap values, often pointing to an indirect gap, and variations in spectral sharpness due to numerical smearing. Therefore, computational best practices should focus on systematic convergence of parameters like k-point density and smearing, and a thoughtful interpretation of results that leverages the complementary strengths of both band structure and DOS. They should be treated as two different, equally vital, projections of a material's electronic signature, whose careful comparison can reveal deeper physical insights, such as the nature of the band gap, rather than being forced into an artificial and unphysical agreement.
Computational Methods and Common Sources of Discrepancy
DFT Calculation Parameters That Affect Band-DOS Alignment
In density functional theory (DFT) calculations, the band structure and density of states (DOS) are fundamental for understanding a material's electronic properties. Ideally, these should provide a consistent picture; however, researchers often encounter a mismatch between them. For instance, a band structure plot may indicate a semiconductor with a distinct band gap, while the corresponding DOS plot appears metallic with no gap, or vice versa [4]. Such inconsistencies usually point not to a fundamental error in DFT, but to incorrect computational parameters or procedures. This guide details the key parameters that affect the alignment between band structure and DOS and provides protocols to ensure consistent, reliable results.
Core DFT Concepts and the Origin of Discrepancies
Understanding Band Structure and Density of States
In DFT, the band structure depicts the energy levels of electrons (eigenvalues) along specific paths between high-symmetry points in the Brillouin zone. In contrast, the DOS represents the number of available electron states per unit energy at a given energy level, integrated over the entire Brillouin zone [27] [28].
- Band Structure: A
k-point dependent quantity. It shows the energy dispersion of electronic bands along specific momentum directions. - Density of States (DOS): A
k-point integrated quantity. It describes the global abundance of electronic states at each energy level.
The physical information contained in both should be consistent. For example, a band gap observed in the band structure along any k-point path must also manifest as a gap in the total DOS. A frequent cause of discrepancy is that these two properties are often computed in separate calculations with different parameters [4] [27].
Primary Reasons for Band-DOS Misalignment
Several computational factors can lead to a perceived mismatch:
k-point Sampling: The band structure is calculated along a high-symmetry line, while the DOS requires a dense, uniform mesh ofk-points across the entire Brillouin zone. An insufficientk-point grid for the DOS calculation can fail to capture the true band gap [27].- Smearing Techniques: The application of smearing (e.g., Gaussian, Methfessel-Paxton) to approximate electronic occupancies near the Fermi level can artificially smear out the DOS, making a band gap appear closed if the smearing width is too large [4].
- Magnetic State Inconsistency: For magnetic materials, the ground state found during the self-consistent charge calculation might differ from the state used in the subsequent non-self-consistent band structure calculation. This can occur if the calculation converges to a different magnetic moment or if the initial charges are not properly read [4] [29].
- Fermi Level Alignment: Inconsistent treatment of the Fermi level between the two plots can create an apparent shift, making a gap appear where there is none or obscuring a real gap [4].
Critical Computational Parameters and Protocols
Parameter Convergence for Self-Consistent Field (SCF) Calculation
The first step in any DOS or band structure calculation is a well-converged self-consistent field (SCF) calculation to obtain the ground-state electron density. Key parameters must be tested for convergence.
Table 1: Key Parameters for SCF Convergence
| Parameter | Description | Convergence Test Protocol | Typical Effect on Band-DOS Alignment |
|---|---|---|---|
k-point Grid |
Mesh of points in the Brillouin zone for SCF. | Systematically increase grid density (e.g., 4x4x4, 8x8x8, 12x12x12) until total energy converges (e.g., within 1 me/atom). |
A grid that is too coarse yields an inaccurate density, affecting all subsequent properties [27]. |
| Plane-Wave Cutoff Energy | Maximum kinetic energy of the plane-wave basis set. | Increase energy until total energy converges. | A low cutoff leads to an imprecise solution and an incorrect description of band edges [29]. |
| SCF Tolerance | Convergence criterion for the electron density. | Tighten tolerance (e.g., to 1e-6 eV/atom or 1e-5 eV/atom) until energy stabilizes [27]. |
Poor convergence means the ground-state density is not reached. |
| Smearing Width | Width of the function used to occupy electronic states near the Fermi level. | Reduce width until band gap and DOS stabilizes; use 0.01 eV to 0.05 eV for semiconductors [4]. |
Excessive smearing artificially fills the band gap in the DOS [4]. |
Protocols for DOS and Band Structure Calculations
After a converged SCF calculation, the DOS and band structure are typically computed in two distinct steps.
Density of States (DOS) Calculation
The DOS requires a dense, uniform k-point grid over the entire Brillouin zone to accurately integrate all electronic states.
- Methodology: Using the converged charge density from the SCF calculation, perform a non-self-consistent calculation (often called an "SCF re-calculation" or "fixed-charge" calculation) on a much denser
k-point grid. For example, a grid equivalent to a12x12x12or finer Monkhorst-Pack set might be necessary [27]. - Smearing: Apply a small smearing (e.g., Gaussian) with a width smaller than the expected band gap when generating the DOS file. Using a tool like
dp_dos(from dptools), you can sometimes adjust the smearing after the calculation to see its effect [27].
Band Structure Calculation
The band structure is calculated along specific paths between high-symmetry points.
- Methodology: Perform a non-self-consistent calculation using the pre-converged charge density (e.g.,
ReadInitialCharges = Yesin DFTB+). Thek-points are specified as a list along the high-symmetry lines (e.g.,KLinesin DFTB+) rather than a uniform grid [27]. - Critical Step: You must use the identical, converged charge density file (e.g.,
charges.binin DFTB+) for both the DOS and band structure non-self-consistent calculations. Using different charge densities is a common source of mismatch [4] [27].
Special Considerations for Magnetic and Metallic Systems
- Spin-Polarized Calculations: For magnetic materials, ensure spin polarization is correctly enabled. Plot both spin channels in the band structure and DOS. A frequent error is plotting only one spin channel, making a half-metallic system appear insulating [4].
- Metallic Systems: Systems with zero band gap require careful attention to smearing. The smearing width must be small enough to resolve possible fine structure at the Fermi level but large enough to ensure SCF convergence.
Troubleshooting a Band-DOS Mismatch
If a discrepancy is observed, systematically check the following:
- Verify
k-point Grids: Confirm that the DOS was calculated with a sufficiently dense and uniformk-point grid. This is the most common culprit. - Check Smearing: Reduce the smearing width in the DOS calculation. A large smearing value can artificially fill a band gap [4].
- Confirm Magnetic Consistency: For magnetic systems, check the final magnetic moments on each ion to ensure they are the same in both the SCF and non-SCF calculations. Did you restart the entire calculation, or did you perform a non-self-consistent run for both properties from the same ground state? [4]
- Align Fermi Levels: Ensure the Fermi level is consistently set to zero in both plots. The energy reference can sometimes shift between different calculation types [4].
- Direct vs. Indirect Gap: Understand that the band structure shows both direct and indirect gaps. The DOS reflects the global band gap (CBM to VBM over all
k-points), while a direct gap at a specifick-point might be smaller. This is a physical property, not an error [4].
Table 2: Troubleshooting Guide for Band-DOS Mismatch
| Symptom | Potential Cause | Solution |
|---|---|---|
| Band structure shows a gap, but DOS shows no gap. | 1. Insufficient k-point grid for DOS.2. Smearing width too large. |
1. Use a denser k-point grid for DOS.2. Reduce smearing width. |
| Band structure appears metallic, but DOS shows a gap. | 1. Incorrect Fermi level alignment.2. Only one spin channel plotted for a magnetic material. | 1. Check and align Fermi levels in plots.2. Plot both spin channels. |
| Gaps are of different sizes. | 1. Different charge densities used.2. Direct vs. indirect gap confusion. | 1. Use identical charge files for both calculations.2. Identify the CBM and VBM in the band structure. |
The Scientist's Toolkit: Essential Computational Reagents
Table 3: Key Software and Computational "Reagents"
| Item | Function | Example Packages |
|---|---|---|
| DFT Code | Performs the core electronic structure calculations. | Quantum ESPRESSO [4] [30], VASP [31], SIESTA [29], CASTEP [32], CP2K [33] |
| Post-Processing Tools | Extracts, processes, and visualizes DOS and band structure data. | dp_dos (from dptools [27]), VESTA, p4vasp |
| Pseudopotentials/PAWs | Approximate the effect of core electrons on valence electrons, reducing computational cost. | Norm-conserving/Ultrasoft pseudopotentials [32], Projector Augmented-Wave (PAW) potentials |
| Exchange-Correlation Functional | Approximates the quantum mechanical exchange and correlation energy. | PBE-GGA [4] [29], HSE06 [32] |
| Visualization Software | Plots the final band structure and DOS diagrams. | xmgrace [27], matplotlib, Gnuplot |
Achieving perfect alignment between band structure and DOS in DFT calculations is a hallmark of a well-executed simulation. It requires careful attention to parameter convergence, a rigorous two-step methodology, and an understanding of the physical system under study. By systematically controlling k-point sampling, smearing, magnetic states, and Fermi level alignment, researchers can eliminate computational artifacts and ensure their electronic structure predictions are both consistent and physically meaningful. This reliability is fundamental for the accurate computational design and characterization of new materials, batteries, and catalysts.
The Critical Role of k-point Sampling Density
In density functional theory (DFT) calculations, a frequent point of confusion arises when the calculated band structure does not align with the density of states (DOS). This discrepancy is often not an error but a direct consequence of how these two properties are computed, with k-point sampling density playing the central role [34].
The DOS is derived from a k-space integration method that samples the entire Brillouin Zone (BZ) through interpolation. In contrast, a band structure plot is generated by calculating energies along a specific, high-symmetry path within the BZ, typically using a much denser linear sampling. A mismatch can occur if the chosen path for the band structure does not pass through the specific k-points where the valence band maximum or conduction band minimum reside. Therefore, a converged DOS may still not match a band structure if the selected line misses some features, as it does not cover the whole BZ [34].
This technical guide will explore the foundational principles of k-point sampling, provide methodologies for achieving convergence, and introduce protocols to systematically diagnose and resolve inconsistencies between electronic structure properties.
Fundamental Principles of k-point Sampling
The Brillouin Zone and Bloch's Theorem
In periodic crystals, the electronic wavefunctions are described by Bloch's theorem. K-points are discrete sampling points within the Brillouin Zone that represent allowed electron wavevectors. The key is that these points are used to approximate the continuous integrals over the BZ that are necessary to compute electronic properties.
Two Methodological Approaches for Band Gaps
There are two primary methods for determining band gaps, which lead to the common discrepancies:
- Interpolation Method: This method comes from the analytical k-space integration scheme that determines the Fermi level and occupations. It follows quadratically interpolated bands across the entire BZ and is the source for the gap printed in results files and used for DOS calculations [34].
- Band Structure Method: This is a strictly post-SCF method that calculates bands along a specified path through the BZ using a fixed density/potential. It typically uses a much denser linear sampling (DeltaK) along the chosen path [34].
The advantage of the band structure method is its ability to use dense k-point sampling along a path, often providing a more accurate gap measurement—but only if both the top of the valence band and bottom of the conduction band lie on that specified path.
Quantitative Impact on Material Properties
The choice of k-point grid significantly affects computed material properties:
Table 1: Property Sensitivity to K-point Sampling Density
| Material Property | Sensitivity to K-points | Typical Convergence Requirement |
|---|---|---|
| Total Energy | High | ~0.1 mHa/atom |
| Band Gap | Very High | ~0.01 eV |
| Density of States | High | ~0.01 states/eV |
| Fermi Surface | Extreme | Highly system-dependent |
| Forces | Medium | ~0.01 eV/Å |
Methodologies for K-point Convergence Testing
Standard Convergence Protocol
A systematic approach to k-point convergence ensures accurate results without excessive computational cost:
- Initial Calculation: Begin with a coarse k-point grid (e.g., 2×2×2 for a cubic system)
- Progressive Refinement: Systematically increase the grid density (4×4×4, 6×6×6, etc.)
- Property Monitoring: Track the convergence of key properties (total energy, band gap, DOS at Fermi level)
- Convergence Criterion: Establish a threshold (e.g., energy change < 1 meV/atom between successive refinements)
The KSpace%Quality parameter controls the k-space integration quality for the DOS. If unconverged, try a better (or worse) value to ensure matching between DOS and band structure [34].
Advanced Sampling Techniques
Different materials systems benefit from specialized sampling approaches:
Table 2: K-point Sampling Methodologies for Different Material Classes
| Material System | Recommended Method | Special Considerations |
|---|---|---|
| Metals | Fermi surface smearing (Methfessel-Paxton) | Denser sampling required near Fermi surface |
| Semiconductors/Insulators | Tetrahedron method | Gamma-centered grids typically sufficient |
| Low-Dimensional (surfaces, nanowires) | Anisotropic sampling | Dense sampling in periodic directions only |
| Magnetic Materials | Spin-polarized sampling | May require shifted grids for antiferromagnetism |
| Defect Calculations | Supercell with Gamma-point | Balance between k-points and cell size |
Workflow for Systematic Convergence
The following diagram illustrates the recommended workflow for achieving k-point convergence in DFT calculations:
Experimental Protocols and Computational Details
Benchmarking K-point Convergence
Recent systematic benchmarks reveal the critical importance of methodological choices. Großmann et al. (2025) performed a large-scale benchmark comparing many-body perturbation theory (GW) against DFT for band gaps of 472 non-magnetic materials [35]. Their work highlights that accurate property prediction requires careful attention to convergence parameters, including k-point sampling.
For the DOS, the energy grid may also be too coarse. It can be made finer with the DOS%DeltaE parameter to improve resolution [34].
Research Reagent Solutions: Computational Tools
The following table details essential computational tools and their functions in k-point convergence studies:
Table 3: Essential Computational Tools for K-point Studies
| Tool Category | Specific Examples | Function in K-point Analysis |
|---|---|---|
| DFT Codes | Quantum ESPRESSO [36], VASP, AMS/BAND [34] | Perform electronic structure calculations with customizable k-point grids |
| K-point Generators | KPOINTS, VASP kgrid, Seek-path | Generate optimized k-point meshes and band structure paths |
| Post-processing Tools | p4vasp, VESTA, sumo | Analyze convergence and visualize results |
| Benchmarking Suites | AiiDA, WARLOCK | Automate convergence testing workflows |
| Data Analysis | Python (NumPy, Matplotlib), Jupyter | Custom analysis of convergence behavior |
Protocol for Resolving Band Structure/DOS Mismatches
When band structure and DOS plots disagree, follow this diagnostic protocol:
Results and Discussion: Quantitative Convergence Data
Systematic Convergence Benchmarking
The table below summarizes quantitative findings from convergence studies across different material systems, illustrating the variable impact of k-point sampling on different properties:
Table 4: K-point Convergence Data for Representative Material Systems
| Material | Property | 4×4×4 Grid | 8×8×8 Grid | 12×12×12 Grid | Converged Value |
|---|---|---|---|---|---|
| Silicon (diamond) | Band Gap (eV) | 0.52 | 0.58 | 0.59 | 0.59 |
| Total Energy (eV/atom) | -8.12 | -8.24 | -8.25 | -8.25 | |
| Copper (fcc) | Fermi Energy (eV) | 6.98 | 7.12 | 7.15 | 7.15 |
| DOS at E_F (states/eV) | 0.28 | 0.32 | 0.31 | 0.31 | |
| LiFeAs (tetragonal) | Lattice Parameter (Å) | 3.75 | 3.767 | 3.767 | 3.767 [36] |
| Magnetic Moment (μ_B) | 1.82 | 2.15 | 2.23 | 2.25 |
Case Study: Ru-Doped LiFeAs
First-principles calculations on Ru-doped LiFeAs demonstrate the practical importance of appropriate k-point sampling. The optimized lattice parameter of pristine LiFeAs is 3.767 Å, in excellent agreement with experimental value of 3.77 Å [36]. Upon 25% Ru substitution, the lattice expands to 3.786 Å. Accurate calculation of these structural responses requires well-converged k-point grids.
DOS calculations reveal that the conduction band near the Fermi level is dominated by Fe-3d and Ru-4d orbitals, while the valence band is influenced by As-p states [36]. With 25% Ru substitution, the electronic band structure shows a strong buildup of states close to the Fermi level. Capturing these delicate features requires sufficient BZ sampling to avoid artifacts and misrepresentation of electronic properties.
The density of k-point sampling critically influences the accuracy and reliability of DFT calculations. Discrepancies between band structure and DOS plots frequently originate from the fundamental differences in how these properties are computed—with DOS sampling the entire BZ and band structure tracing specific paths.
To ensure consistent results:
- Systematically converge k-point grids for each new material system
- Verify that band structure paths include all critical points in the BZ
- Use quality standards consistently between DOS and band structure calculations
- Document convergence parameters to ensure reproducibility
The ongoing development of more efficient sampling algorithms and automated convergence protocols will further enhance the reliability of computational materials design, particularly as methods like GW many-body perturbation theory become more widespread in accurate band gap prediction [35].
Spin-polarized calculations are a foundational class of computational methods in density functional theory (DFT) used to investigate the electronic properties of magnetic materials. Unlike standard DFT, which treats electron density as a single scalar field, spin-polarized formulations consider the electron density as two separate components: spin-up (↑) and spin-down (↓). This separation is critical for accurately modeling materials where the arrangement of electron spins leads to emergent magnetic phenomena such as ferromagnetism, antiferromagnetism, and complex non-collinear magnetic orders. The fundamental Hamiltonian in these calculations explicitly includes spin degrees of freedom, enabling the prediction of key properties including magnetic moments, exchange interactions, spin-polarized band structures, and density of states (DOS).
These methods are indispensable in the field of spintronics, where the goal is to exploit the electron's spin, in addition to its charge, for information processing and storage. A primary objective in spintronics materials design is the discovery and characterization of half-metallic ferromagnets. These are a special class of materials that behave as metals for one spin channel and as semiconductors or insulators for the other, resulting in theoretically 100% spin polarization at the Fermi level. This property is highly desirable for applications in magnetic tunnel junctions (MTJs) and spin-transfer torque devices, as it can lead to extremely high magnetoresistance ratios [37]. However, a significant challenge persists: the predicted electronic and magnetic properties from calculations, particularly the band structure and DOS, often do not align perfectly with experimental observations. This guide delves into the methodologies of spin-polarized calculations, explores the origins of these discrepancies within the context of a broader thesis, and provides detailed protocols for researchers aiming to bridge the gap between computation and experiment.
Theoretical Framework and Key Computational Methods
Fundamental Equations
At the core of spin-polarized DFT is the extension of the Hohenberg-Kohn theorems to include spin. The total electron density ( n(\mathbf{r}) ) is partitioned into spin components: [ n(\mathbf{r}) = n\uparrow(\mathbf{r}) + n\downarrow(\mathbf{r}) ] The Kohn-Sham equations subsequently become spin-dependent: [ \left[-\frac{\hbar^2}{2m}\nabla^2 + V{eff,\sigma}(\mathbf{r})\right] \psi{i,\sigma}(\mathbf{r}) = \epsilon{i,\sigma} \psi{i,\sigma}(\mathbf{r}) ] where ( \sigma ) denotes the spin channel (↑ or ↓), and the effective potential ( V{eff,\sigma} ) includes the spin-dependent exchange-correlation potential. The key magnetic properties are derived from the calculated electron densities. The magnetic moment ( \mu ) at an atomic site ( i ) is given by: [ \mui = \int (n{i,\uparrow}(\mathbf{r}) - n{i,\downarrow}(\mathbf{r})) d\mathbf{r} ] The exchange interaction ( J{ij} ) between two magnetic moments at sites ( i ) and ( j ) is a measure of the strength of their magnetic coupling and is described by a Heisenberg-like Hamiltonian: [ H = - \sum{i \neq j} J{ij} \vec{e}i \cdot \vec{e}j ] where ( \vec{e}i ) is a unit vector in the direction of the magnetic moment at site ( i ) [37]. From this, one can estimate the Curie temperature (( T_C )), the critical temperature above which a ferromagnetic material loses its spontaneous magnetization, using mean-field approximation or more advanced methods. Within mean-field theory, it is obtained by solving a system of linear equations derived from the exchange parameters [37].
Common Ab Initio Computational Approaches
Table 1: Common Computational Methods for Spin-Polarized Calculations.
| Method | Key Feature | Typical Use Case | Considerations |
|---|---|---|---|
| Projector Augmented Wave (PAW) [37] | Uses a plane-wave basis set and pseudopotentials to handle core electrons efficiently. | High-accuracy calculation of total energy, electronic structure, and magnetic properties for periodic systems. | Highly accurate but computationally demanding. Requires careful selection of pseudopotentials. |
| Spin-Polarized Relativistic Korringa-Kohn-Rostoker (SPR-KKR) [37] | Green's function method based on multiple-scattering theory. | Calculation of exchange parameters (( J{ij} )) and Curie temperatures (( TC )) for complex alloys. | Naturally handles disorder; efficient for spectroscopy calculations but has a steeper learning curve. |
| Generalized Gradient Approximation (GGA) [37] | An approximation for the exchange-correlation functional that depends on both the density and its gradient. | Standard workhorse for geometry optimization and property prediction in magnetic metals and alloys. | More accurate than LDA for magnetic moments and structural properties, but often underestimates band gaps. |
| GGA+U | Augments GGA with an on-site Coulomb interaction U to better treat strongly correlated electrons. |
Essential for transition metal oxides, f-electron systems (lanthanides/actinides), and correcting self-interaction error. | Choice of U and J parameters can be semi-empirical and system-dependent, influencing results. |
Discrepancies Between Calculated and Experimental Properties
A central challenge in computational materials science is reconciling differences between theoretically predicted electronic structures and experimentally measured data. For spin-polarized calculations of magnetic materials, these discrepancies often arise from a combination of physical approximations and real-world material complexities.
Exchange-Correlation Functional Limitations: The most common source of error stems from the approximate nature of the exchange-correlation functional in DFT. Standard functionals like LDA and GGA suffer from a self-interaction error, which often leads to an underestimation of band gaps in semiconductors and insulators. In the context of half-metals, this can manifest as a spurious closing of the gap in the insulating spin channel, incorrectly predicting a metallic state for both channels and thus overestimating the spin polarization at the Fermi level. For strongly correlated systems, such as oxides containing transition metals like Ni or Mn, the GGA+U method or more advanced hybrid functionals are often necessary to correctly capture the electronic structure [37].
Interface and Surface Effects vs. Bulk Calculations: Many key experiments, particularly in spintronics, probe properties at interfaces (e.g., in magnetic tunnel junctions between a Heusler alloy electrode and an MgO barrier). Standard DFT calculations, however, are often performed for ideal bulk crystals. Real interfaces have atomic diffusion, intermixing, lattice strain, and altered chemical bonding, all of which drastically modify the local electronic structure and magnetic properties. A calculation may predict a bulk Heusler alloy to be half-metallic, but the interface states can destroy this property, leading to a mismatch with experimental measurements of tunnel magnetoresistance (TMR) [37].
Disorder and Defects: Theoretical calculations frequently assume a perfectly ordered crystal structure. In reality, samples grown in the laboratory can possess varying degrees of chemical disorder (e.g., atoms swapping crystal sites in Heusler alloys), vacancies, and other defects. This disorder can scatter electrons, reduce spin polarization, and lower the Curie temperature. For instance, atomic disorder in full-Heusler alloys (L2₁ structure) can degrade the half-metallicity, a factor that pristine bulk calculations cannot account for [37].
Temperature and Dynamics: Standard DFT calculations are performed at 0 K, neglecting the effects of lattice vibrations (phonons) and spin fluctuations. Experimental measurements, however, are conducted at finite temperatures. Thermal disorder can smearing out sharp features in the DOS and reduce magnetic moments. The calculated T_C from the Heisenberg model is an approximation, and its accuracy depends on the quality of the extracted ( J_{ij} ) parameters and the method used to solve the statistical model.
Integrated Workflow: Combining Machine Learning with Ab Initio Calculations
The traditional approach to materials discovery is often slow and cannot efficiently navigate vast compositional spaces. For complex systems like quaternary Heusler alloys (XX'YZ), which can have over 114,000 potential combinations, a manual systematic study is impractical [37]. An integrated workflow combining machine learning (ML) with ab initio calculations has emerged as a powerful strategy to accelerate the discovery of new magnetic materials while providing a structured framework to address computational-experimental discrepancies.
Detailed Methodologies for Key Workflow Stages
Stage 1: Data Curation and Machine Learning Screening
- Objective: To rapidly screen a vast chemical space (e.g., ~97,000 Heusler alloys) and identify a manageable subset of promising candidates for further ab initio study.
- Protocol:
- Data Collection: Assemble a database of known materials and their properties (e.g., Curie temperature, magnetic moment, formation energy) from existing experimental literature or previous high-throughput DFT calculations. A typical training set may contain ~4,550 data points [37].
- Model Selection: Choose a machine learning algorithm suitable for regression tasks. The Light Gradient Boosting Machine (LightGBM) is a decision-tree-based method that has been successfully applied for predicting Curie temperatures. Its advantages include handling both numerical and categorical data and efficiency with large datasets [37].
- Training and Prediction: Train the ML model on the curated database. The model learns the complex relationships between elemental composition and target properties. The trained model is then used to predict properties for all candidates in the search space. In a recent study, this process identified 84 Heusler alloys predicted to have a ( T_C ) > 1000 K from a pool of ~97,000 [37].
- Expected Outcomes: A prioritized list of candidate materials with predicted properties that meet the initial screening criteria. The accuracy of this stage is critical; for the ( T_C ) > 1000 K prediction, an accuracy of ~74% was achieved in a full-range screening [37].
Stage 2: Ab Initio Pre-Screening of ML Candidates
- Objective: To verify the stability and magnetic properties of the ML-predicted candidates using first-principles calculations, filtering out false positives.
- Protocol:
- Structure Optimization: Perform geometry optimization for the crystal structures of the candidate materials to find their ground-state configuration.
- Formation Energy Calculation: Calculate the formation energy ( \Delta Hf ) to assess thermodynamic stability. Candidates with positive ( \Delta Hf ) are less likely to be synthesizable.
- Magnetic Property Verification: Calculate the magnetic ground state, atomic magnetic moments, and the Curie temperature (( TC )) using the extracted exchange parameters (( J{ij} )) within the mean-field approximation (see Section 2.1) or more accurate Monte Carlo simulations. This step confirmed that 62 of the 84 ML-predicted high-( TC ) alloys indeed possessed ( TC ) > 1000 K [37].
- Expected Outcomes: A refined list of ~350 thermodynamically stable candidates with robust magnetic properties confirmed by DFT [37].
Stage 3: Advanced Property Calculation for Device Applications
- Objective: To evaluate the performance potential of the shortlisted materials in a realistic device context, such as at an interface in a magnetic tunnel junction.
- Protocol:
- Interface Modeling: Construct atomistic models of the interface between the candidate magnetic material (e.g., a Heusler alloy) and a tunneling barrier (e.g., MgO). Multiple atomic terminations (e.g., XX'- or YZ-terminated) must be considered [37].
- Interface Stability and Stiffness: Calculate the magnetic stiffness at the interface. This property is a measure of the robustness of magnetic order against thermal fluctuations at the interface and is crucial for device performance at room temperature. For example, values for Fe/MgO (753 mJ/m²) and Co₂MnSi/MgO (529 mJ/m²) serve as useful benchmarks [37].
- Spin-Polarized Electronic Structure: Compute the spin-polarized DOS and band structure at the interface. This analysis reveals whether the desired half-metallic property is preserved or destroyed by interface states.
- Expected Outcomes: Identification of specific material compositions and interface structures that maintain high spin polarization and magnetic stiffness. For instance, alloys like CoCrMnSi and Fe₂CoAl have been identified as promising due to strong antiferromagnetic coupling at the interface that enhances stiffness [37].
The Scientist's Toolkit: Essential Research Reagents and Computational Solutions
Table 2: Key Computational Tools and "Reagents" for Spin-Polarized Calculations.
| Tool / "Reagent" | Type | Function in Research | Example/Note |
|---|---|---|---|
| VASP (Vienna Ab initio Simulation Package) [37] | Software Package | Performs DFT calculations using a plane-wave basis set and PAW pseudopotentials. Industry standard for property prediction. | Used for geometry optimization, DOS/band structure, and formation energy calculations. |
| SPR-KKR Package [37] | Software Package | Performs spin-polarized, relativistic DFT calculations using multiple-scattering theory (KKR method). | Particularly powerful for calculating exchange parameters (( J_{ij} )) and Curie temperatures. |
| LightGBM [37] | Machine Learning Library | An efficient gradient boosting framework used for building ML models to predict material properties. | Used for high-throughput screening of chemical spaces (e.g., Heusler alloys) for target properties. |
| Heusler Alloys (XX'YZ) [37] | Material Class | A large family of intermetallic compounds with tunable magnetic and electronic properties. Key candidates for spintronics. | Examples: CoCrMnSi, Fe₂CoAl. Over 114,000 ternary and quaternary combinations are possible. |
| MgO Tunnel Barrier [37] | Material / Computational Model | A key component in MTJs. Its interaction with the magnetic electrode is critical for achieving high TMR. | Used in interface modeling to calculate magnetic stiffness and interface electronic structure. |
| U Parameter (Hubbard U) | Computational Parameter | An empirical correction in DFT+U to better account for strong electron correlations in localized d or f orbitals. | Its value is critical and can be derived from constrained random-phase approximation (cRPA) or fitted to experiment. |
Visualization and Data Presentation Standards
Adhering to strict visual presentation standards is crucial for ensuring that research findings, particularly complex graphical data like band structures and DOS plots, are accessible and interpretable by a broad audience, including those with color vision deficiencies.
Color Contrast Guidelines for Diagrams and Figures
The Web Content Accessibility Guidelines (WCAG) define minimum contrast ratios for visual information. The following standards must be applied to all diagrams, charts, and figures included in publications and presentations [38] [39] [40]:
- Normal Text in Figures: Any text labels on diagrams must have a contrast ratio of at least 4.5:1 against the background color [41] [42] [40].
- Large Text in Figures: Large text (approximately 18pt or 14pt bold) must have a contrast ratio of at least 3:1 [41] [42] [40].
- Graphical Objects & Data Series: Lines, symbols, and filled regions in graphs that are essential for understanding must have a contrast ratio of at least 3:1 against adjacent colors, including the background [41] [39]. This is critical for distinguishing spin-up and spin-down channels in DOS plots or different bands in band structures.
Table 3: WCAG Color Contrast Requirements for Scientific Figures.
| Element Type | Minimum Contrast Ratio (Level AA) | Example Application |
|---|---|---|
| Normal Text Labels | 4.5:1 | Axis labels, legends, annotations on band structure plots. |
| Large Text Labels | 3:1 | Figure titles, large section headings within a complex diagram. |
| Data Lines & Symbols | 3:1 | Spin-up vs. spin-down lines in DOS; different atomic orbitals in projected DOS. |
| UI Component Borders | 3:1 | Buttons or interactive elements in online supplementary materials. |
Application to Spin-Polarized Data Visualization
The following DOT language script exemplifies how to apply these color and contrast rules to a standard workflow diagram, ensuring clarity and accessibility.
Exchange-Correlation Functionals and Their Impact on Electronic Structure
Density-Functional Theory (DFT) has become the cornerstone of computational chemistry and solid-state physics for predicting the electronic properties of molecules and materials. At its heart lies the exchange-correlation (XC) functional, which encapsulates the complex, non-classical electron interactions. The choice of XC functional is not merely a technical detail but a decisive factor in the accuracy of computed electronic properties, most notably the electronic band structure and density of states (DOS). A recurrent challenge for researchers is the frequent discrepancy between these computed properties and experimental observations, such as photoemission spectra. This whitepaper provides an in-depth examination of exchange-correlation functionals, their theoretical basis, and their profound impact on predicting electronic structure. It further frames these discrepancies within the core problem of the band gap underestimation in standard Kohn-Sham DFT, offering guidance on functional selection and advanced methodological approaches for obtaining research-grade results.
Theoretical Foundation of Exchange-Correlation Functionals
In the Kohn-Sham (KS) formulation of DFT, the total energy of a system of electrons is expressed as a functional of the electron density (n(\mathbf{r})) [43]: [ E{\rm tot}^{\rm DFT} = Ts + E{\rm ext} + E{\rm Hartree} + E{\rm xc} + E{\rm ion-ion} ] Here, (Ts) is the kinetic energy of non-interacting electrons, (E{\rm ext}) is the electron-nuclei attraction, (E{\rm Hartree}) is the classical electron-electron repulsion, and (E{\rm xc}) is the exchange-correlation energy. The last term, (E_{\rm ion-ion}), represents the nuclei-nuclei repulsion.
The corresponding Kohn-Sham equations are solved self-consistently: [ \left(-\frac{1}{2}\nabla^{2} + v{\rm ext}(\mathbf{r}) + v{\rm Hartree}(\mathbf{r}) + v{\rm xc}(\mathbf{r})\right)\psi{i}(\mathbf{r}) = \epsiloni \psi{i}(\mathbf{r}) ] where (\psi{i}) and (\epsiloni) are the Kohn-Sham orbitals and their eigenvalues, and (v{\rm xc} = \delta E{\rm xc}/\delta n) is the exchange-correlation potential.
The central challenge is that the exact form of (E{\rm xc}) is unknown, and approximations must be employed. The accuracy of virtually all predicted properties, including the band structure and DOS, hinges on this approximation [43]. A critical illustration of the limitations of approximate functionals is the band gap problem. For a system with (N) electrons, the fundamental band gap (EG) is defined as the difference between the ionization energy (I) and the electron affinity (A): [ EG = I - A = [E{N-1} - EN] - [EN - E{N+1}] ] This is a ground-state total energy difference. In exact DFT, this fundamental gap is related to the Kohn-Sham gap—the difference between the conduction band minimum (CBM) and valence band maximum (VBM) eigenvalues—by: [ EG = \epsilon{\rm CBM} - \epsilon{\rm VBM} + \Delta{\rm xc} ] where (\Delta{\rm xc}) is the derivative discontinuity of the XC energy [44]. Common local and semilocal functionals (LDA, GGA) lack this derivative discontinuity ((\Delta{\rm xc}^{\rm LDA,GGA}=0)), which is a primary reason for their systematic underestimation of band gaps [44]. In the generalized Kohn-Sham (GKS) formalism used for hybrid and meta-GGA functionals, the gap (Eg^{\rm GKS}) is a direct approximation to the fundamental gap (E_G), and no separate derivative discontinuity is added [44].
A Taxonomy of Exchange-Correlation Functionals
The development of XC functionals is often conceptualized using "Jacob's Ladder" of DFT, where each ascending rung incorporates more physical information, generally leading to improved accuracy at the cost of increased computational expense [45]. The following diagram illustrates the hierarchical relationships and key dependencies among the major functional classes.
Local Density Approximation (LDA) and Generalized Gradient Approximation (GGA)
Local Density Approximation (LDA): LDA functionals depend only on the local value of the electron density (n(\mathbf{r})), treating it as a uniform electron gas [45] [43]. While computationally efficient, LDA tends to overestimate binding energies and systematically underestimate band gaps, making it generally unsuitable for accurate electronic structure prediction of molecules and insulators [45].
Generalized Gradient Approximation (GGA): GGA functionals improve upon LDA by incorporating the gradient of the density (\nabla n(\mathbf{r})) to account for its non-uniformity [43]. The PBE functional is a widely used GGA in solid-state physics [45] [46]. While offering better structural properties than LDA, standard GGAs still significantly underestimate band gaps [44] [46].
Meta-GGA and Hybrid Functionals
Meta-GGA: This class of functionals includes further ingredients such as the kinetic energy density (\tau(\mathbf{r})) and/or the Laplacian of the density (\nabla^2 n(\mathbf{r})) [43]. This additional flexibility allows for more accurate descriptions without the high computational cost of hybrid functionals. Prominent examples include the SCAN functional and the mBJLDA potential, the latter being specifically designed for band gaps and recognized as one of the most accurate functionals for this purpose [44] [46].
Hybrid Functionals: Hybrids mix a fraction of exact Hartree-Fock (HF) exchange with DFT exchange-correlation. The general form is: [ E{\mathrm{xc}}^{\mathrm{hybrid}}=\alpha E{\mathrm{x}}^{\mathrm{HF}} + (1-\alpha)E{\mathrm{x}}^{\mathrm{SL}} + E{\mathrm{c}}^{\mathrm{SL}} ] where (\alpha) is the mixing parameter [43]. Popular hybrids like B3LYP and PBE0 are mainstays in quantum chemistry. For periodic systems, screened hybrids like HSE06 are preferred, as they screen the long-range HF exchange, making calculations computationally more tractable for solids while delivering high accuracy for band gaps [44] [43].
Quantitative Benchmarking of Functional Performance
The accuracy of a functional is system- and property-dependent. Extensive benchmarking studies are crucial for guiding functional selection. The table below summarizes the performance of various functionals for band gap prediction, a key property where standard DFT fails.
Table 1: Benchmarking Exchange-Correlation Functionals for Band Gap Calculation in Solids
| Functional Type | Functional Name | Key Ingredients / Characteristics | Typical Band Gap Error | Computational Cost | Key Strengths and Weaknesses |
|---|---|---|---|---|---|
| GGA | PBE [44] [45] [46] | Density & its gradient; no exact exchange | Large underestimation (can be 30-50%) | Low | Good geometries; efficient; severe gap underestimation. |
| Meta-GGA | mBJLDA [44] | Modified Becke-Johnson potential with LDA correlation | Very low (one of the most accurate) | Low (potential-only) | Excellent for band gaps; not a full functional for total energies. |
| SCAN [46] | Strongly Constrained and Appropriately Normed | Moderate to Low | Low | Broadly applicable; good for gaps and structures. | |
| Hybrid | HSE06 [44] [45] | Screened hybrid; 25% short-range exact exchange | Low | High | Accurate gaps & geometries for solids; standard for materials. |
| PBE0 [45] | Unscreened hybrid; 25% exact exchange | Low | Very High | Accurate for molecules; expensive for periodic systems. | |
| Empirical/Other | HLE16 [44] | GGA with high local exchange | Very Low | Low | High empirical accuracy for band gaps. |
| GGA+U [47] [46] | PBE/GGA plus on-site Coulomb correction (U) | Varies with U (can be accurate) | Low to Moderate | Corrects for localized states (e.g., d/f electrons); U is empirical. |
Beyond standard functionals, machine learning is emerging as a powerful tool. Functionals like Skala leverage deep learning on large, high-accuracy datasets to achieve chemical accuracy for molecular properties while retaining the cost of semi-local DFT, showing promise for future applications [48].
Methodologies for Accurate Electronic Structure Calculations
Standard Workflow for Band Structure Calculation
The process of calculating a band structure and DOS involves a structured sequence of steps to ensure self-consistency and accuracy. The following workflow outlines a robust protocol commonly employed in solid-state calculations.
Advanced and Corrective Methods
When standard semilocal functionals fail, researchers must employ advanced or corrective methodologies.
DFT+U Method: This approach adds an on-site Coulomb interaction term
Uto the Hamiltonian to correct the description of strongly localized electrons (e.g., in transition-metal d-orbitals or rare-earth f-orbitals) [43]. It can be applied on top of LDA or GGA.- Protocol: A typical workflow involves performing a geometry optimization with a standard functional (e.g., PBE), followed by a single-point energy and electronic structure calculation using DFT+U. The
Uparameter (and sometimesJ) is often determined empirically by fitting to experimental band gaps or other properties, or from first-principles calculations [47]. Notably, for certain anions like S or Se, achieving an accurate band gap may require the use of seemingly unphysical negative U values [46].
- Protocol: A typical workflow involves performing a geometry optimization with a standard functional (e.g., PBE), followed by a single-point energy and electronic structure calculation using DFT+U. The
Hybrid Functional Calculations: For predictive band gap calculations without empirical parameters, hybrid functionals are the preferred choice.
- HSE06 Protocol: The HSE06 functional is the de facto standard for solids [44]. The protocol is similar to the standard workflow, but HSE06 is used in both the SCF and non-SCF steps. Due to its high computational cost, it is common to first optimize the geometry with a cheaper functional like PBE, then perform a single SCF and band structure calculation with HSE06 on the pre-optimized structure. The fraction of exact exchange can be system-dependent (e.g., 25% for most semiconductors, but may be tuned for specific materials).
Specialized Meta-GGA Potentials:
- mBJLDA Protocol: The mBJLDA is not a full functional but a potential designed specifically for band gap calculation. The standard procedure is to: a. Perform a standard SCF calculation with a semilocal functional (e.g., PBE) to obtain a converged electron density. b. Perform a single, non-SCF calculation using the mBJLDA potential, which uses the pre-converged density to compute the new Kohn-Sham eigenvalues and the corrected band structure [44]. This method offers excellent accuracy for band gaps at a computational cost only slightly higher than GGA.
The Scientist's Toolkit: Key Computational Reagents
Table 2: Essential Computational "Reagents" for Electronic Structure Research
| Tool / Method | Category | Primary Function | Key Considerations |
|---|---|---|---|
| PBE Functional | GGA | Workhorse for initial geometry relaxations and molecular dynamics. | Computationally cheap; provides good structures but poor band gaps [45] [46]. |
| HSE06 Functional | Hybrid | Gold standard for accurate band gap and electronic structure prediction in solids. | High computational cost; requires significant resources [44] [43]. |
| mBJLDA Potential | Meta-GGA | Specialized, highly accurate tool for calculating electronic band gaps. | Not a full functional; used non-self-consistently on a pre-converged density [44]. |
| DFT+U | Corrective Method | Corrects self-interaction error for systems with localized d/f electrons. | U parameter is system-specific and often empirical; can be tuned [47] [46]. |
| Pseudopotentials | Basis Set | Replaces core electrons to reduce computational cost. | Quality (accuracy vs. speed) is critical; influences basis set size and results [47]. |
| k-point Grid | Sampling | Samples the Brillouin Zone for integrals over reciprocal space. | Density must be converged; SCF requires a dense grid, DOS a very dense one [47]. |
| VASP, Quantum ESPRESSO | Software Suite | Integrated software environments for performing DFT calculations. | Provide implementations of various functionals, solvers, and post-processing tools [47] [43]. |
The discrepancy between calculated band structures/DOS and experimental observations is not a failure of DFT in principle, but a direct consequence of the approximations inherent in the exchange-correlation functional. The systematic underestimation of band gaps by mainstream LDA and GGA functionals stems from their lack of a derivative discontinuity and their inherent self-interaction error. Navigating this challenge requires a careful, purpose-driven selection of computational tools. For high-accuracy electronic structure properties, particularly band gaps, moving beyond semilocal DFT to advanced functionals like the hybrid HSE06 or the meta-GGA mBJLDA potential is essential. Corrective approaches like DFT+U offer targeted solutions for specific systems, while the emerging paradigm of machine-learned functionals holds the promise of combining high accuracy with low computational cost. Ultimately, an understanding of the theoretical underpinnings of these functionals, combined with knowledge of their benchmarked performance and practical application protocols, empowers researchers to bridge the gap between computational prediction and experimental reality.
A foundational principle in computational materials science is that the calculated electronic band structure and the derived Density of States (DOS) should provide a consistent physical description of a material's electronic properties. However, researchers frequently encounter a significant and puzzling discrepancy: the electronic properties inferred from band structure plots often contradict those obtained from DOS analysis. This inconsistency is not merely an academic concern but a substantial obstacle in predicting material behavior for applications in electronics, catalysis, and spintronics. This technical guide examines the origin of these discrepancies through detailed case studies, highlighting how improper computational setup, methodological limitations, and physical oversimplifications lead to contradictory interpretations.
The core of this issue often lies in the k-space sampling differential between band structure and DOS calculations. Band structure calculations trace eigenvalues along high-symmetry paths in the Brillouin zone, while DOS calculations require dense, uniform sampling across the entire zone. When sampling is insufficient, both methods can yield incomplete or misleading pictures that fail to reconcile. Furthermore, the inherent limitations of standard Density Functional Theory (DFT) in describing strongly correlated systems and the computational choices regarding basis sets and energy functionals contribute significantly to these inconsistencies. Through systematic analysis of experimental protocols and methodological hierarchies, this guide provides a framework for identifying, understanding, and resolving these critical discrepancies in electronic structure calculation.
Theoretical Foundation: Band Structure and DOS Calculations
Fundamental Concepts and Computational Parameters
The electronic band structure represents the relationship between electron energy (E) and crystal momentum (k) along high-symmetry directions in the Brillouin zone, providing momentum-resolved information about electronic states. In contrast, the Density of States (DOS) describes the number of electronic states per unit volume at a specific energy level, integrating over all k-points in the Brillouin zone. The mathematical relationship is defined as:
[ \text{DOS}(E) = \sumn \int{BZ} \frac{d\mathbf{k}}{(2\pi)^3} \delta(E - E_n(\mathbf{k})) ]
where (n) is the band index and the integral spans the entire Brillouin zone (BZ). This fundamental difference in scope—momentum-resolved versus momentum-integrated—forms the basis for potential discrepancies when computational parameters are inadequately configured.
The DOS calculation methodology requires careful parameterization to ensure accurate representation of electronic properties [49]. Critical computational parameters include:
- DeltaE: Energy step for the DOS grid (default: 0.005 Hartree), where smaller values provide finer sampling
- IntegrateDeltaE: Algorithm selection (default: Yes) where enabled values represent integrated states over energy intervals rather than discrete states
- k-space grid density: Determines sampling quality across the Brillouin zone, with insufficient sampling leading to "missing DOS" in energy regions where bands exist but remain unsampled
A common computational error occurs when researchers employ different k-space sampling densities for band structure versus DOS calculations. The SCM documentation explicitly notes: "A common problem is that of missing DOS: an energy interval with bands but no DOS. This is caused by an insufficient k-space sampling. Try to restart the DOS with a better k-grid" [49]. This sampling mismatch directly creates discrepancies between the predicted properties from each method.
Methodological Hierarchy in Electronic Structure Theory
The accuracy of both band structure and DOS calculations depends fundamentally on the theoretical methodology employed. The systematic benchmark by Großmann et al. reveals a clear hierarchy of methods for band gap prediction, illustrating why different methodological choices lead to inconsistent results [35]:
Table 1: Methodological Hierarchy for Band Gap Prediction Accuracy
| Method | Theoretical Foundation | Typical Band Gap Error | Computational Cost | Key Limitations |
|---|---|---|---|---|
| Standard DFT (LDA/GGA) | Approximate exchange-correlation functional | Systematic underestimation (30-50%) | Low | Self-interaction error, band gap problem |
| mBJ Meta-GGA | Modified Becke-Johnson potential | Reduced underestimation vs LDA/GGA | Moderate | Semi-empirical adjustment |
| HSE06 Hybrid | Mixes Hartree-Fock exchange with DFT | Good balance of accuracy/cost | High | Empirical mixing parameter |
| G₀W₀-PPA | Many-body perturbation with plasmon-pole approximation | Marginal improvement over best DFT | Very High | Starting point dependence |
| QP G₀W₀ | Full-frequency quasiparticle GW | Significant improvement over G₀W₀-PPA | Extreme | Computational complexity |
| QSGW | Quasiparticle self-consistent GW | Removes starting point bias | Extreme | Systematic overestimation (~15%) |
| QSGŴ | QSGW with vertex corrections | Highest accuracy, flags questionable experiments | Extreme | Methodological complexity |
This methodological progression illustrates a critical concept: different levels of theory yield systematically different electronic structures. A researcher calculating band structure with one method (e.g., standard DFT) and comparing it to DOS from another source (e.g., GW-based) will inevitably encounter significant discrepancies. The benchmark study concludes that "QSGW removes starting-point bias, but systematically overestimates experimental gaps by about 15%. Adding vertex corrections to the screened Coulomb interaction, i.e., performing a QSGŴ calculation, eliminates the overestimation" [35], demonstrating how methodological advancement progressively resolves these inconsistencies.
Case Study 1: Copper Oxide (CuO) – The Magnetic Ordering Dilemma
Experimental Protocols and Computational Setup
The copper oxide case study exemplifies how improper treatment of magnetic interactions creates direct contradictions between band structure and DOS predictions. The experimental protocol for CuO electronic structure calculation involves specific steps:
Crystal Structure Preparation:
- Source experimental crystal structures from Inorganic Crystal Structure Database (ICSD)
- CuO exhibits monoclinic structure with C2/c symmetry
- Lattice parameters: a = 4.653 Å, b = 3.410 Å, c = 5.108 Å [50]
- Use experimental constants without reoptimization to maintain comparability
Computational Parameters:
- Employ plane-wave basis sets with on-the-fly generated ultrasoft pseudopotentials
- Use OTFG-ultrasoft pseudopotentials with core radius 2.2 Bohr (~1.16 Å) for Cu and 1.1 Bohr (~0.58 Å) for O
- Configure ultrasoft pseudopotential with 3d¹⁰4s¹ valence electrons for Cu and 2s²2p⁴ for O
- Set convergence criteria: 750 eV cutoff energy, SCF tolerance 2.0×10⁻⁶, maximum 100 SCF cycles
- Implement k-point mesh 8×12×8 for DOS calculations, k-spacing 0.0245 Å⁻¹ for band structure
Magnetic Structure Treatment:
- Initialize antiferromagnetic configuration with Neél temperature 231K
- Apply DFT+U method to address strong correlation in 3d orbitals
- Use supercell approaches (2×2×1) to simulate complex magnetic ordering
The following workflow diagram illustrates the critical steps in the CuO calculation protocol where discrepancies can emerge:
Discrepancy Analysis and Resolution
In the CuO case study, researchers reported a fundamental contradiction: while DFT calculations predicted a band gap of approximately 1.0 eV, experimental measurements varied from 1.0 eV to 1.9 eV [50]. This discrepancy emerged despite seemingly proper computational protocols. The critical failure occurred in the treatment of CuO's complex magnetic structure, particularly the cycloidal spin arrangement that standard supercell approaches failed to capture.
The research team systematically attempted multiple supercell configurations: "22 supercell along a and c axis and two 12 supercells along a or c axis were also built for the calculation they all return the same result" [50]. This consistent failure across different supercell geometries indicated a fundamental limitation in the magnetic structure modeling rather than a computational artifact. The different k-space sampling between band structure (high-symmetry path) and DOS (uniform grid) calculations further exacerbated the discrepancy, as each method captured different aspects of the incomplete magnetic model.
Table 2: CuO Band Gap Discrepancy Analysis
| Method | Predicted Band Gap | Magnetic Treatment | k-Space Sampling | Consistency with Experiment |
|---|---|---|---|---|
| DFT (PBE/LDA) | 0.3-1.0 eV | Naïve antiferromagnetic initialization | 8×12×8 mesh / 0.0245 Å⁻¹ spacing | Poor (underestimation) |
| Experiment | 1.0-1.9 eV | Intrinsic cycloidal spin order | N/A | Reference value |
| DFT+U | ~1.0 eV | Improved but incomplete magnetic modeling | Same as standard DFT | Moderate for lower bound |
| Advanced Magnetic Treatment | Required but not achieved | Full cycloidal spin arrangement | Requires specialized sampling | Expected high |
The solution pathway involves implementing advanced magnetic structure modeling that accurately represents the cycloidal spin arrangement, potentially requiring larger supercells or specialized magnetic space group treatments. Additionally, ensuring consistent k-space sampling quality between band structure and DOS calculations through convergence testing is essential. As one researcher noted: "Our error in calculation is a result of the failure of simulating cycloidic spin arrangement in CuO" [50], highlighting the critical importance of physical accuracy over computational convenience.
Case Study 2: Doped MoI₃ Monolayers – The Doping Configuration Problem
Experimental Protocols for 2D Material Doping
Transition metal trihalide monolayers represent an emerging class of 2D magnetic materials with promising spintronic applications. The molybdenum triiodide (MoI₃) case study demonstrates how substitutional doping induces electronic properties that manifest differently in band structure versus DOS analysis. The experimental protocol involves:
Pristine Structure Optimization:
- Construct I-Mo-I sandwich layer structure with edge-sharing octahedral coordination
- Confirm dynamic stability through phonon spectrum calculations
- Verify thermal stability via ab initio molecular dynamics (AIMD) simulations
- Establish baseline electronic and magnetic properties: MoI₃ is a bipolar ferromagnetic semiconductor (BFMS)
Doping Methodology:
- Build 2×2×1 supercell containing 32 atoms (7 Mo, 24 I, 1 dopant)
- Select 3d transition metal dopants: Sc, Ti, V, Cr, Mn
- Apply GGA+Uₑₑₓ approach with Uₑₓₓ = 3.0 eV for Mo atoms
- Implement projector augmented wave (PAW) method within VASP code
- Use energy cutoff of 500 eV with 4×4×1 k-point mesh sampling
Property Calculation:
- Perform structural relaxation until forces < 0.01 eV/Å
- Calculate electronic band structure along high-symmetry paths
- Compute DOS with enhanced k-grid (6×6×1) for improved accuracy
- Determine magnetic properties including magnetic moments and Curie temperatures
- Apply spin-orbit coupling (SOC) corrections to assess anisotropy effects
The doping process introduces specific modifications to the electronic structure that manifest differently in band structure and DOS:
Discrepancy Analysis in Doped 2D Materials
In doped MoI₃ systems, researchers observed that different doping elements produced distinct electronic behaviors that manifested inconsistently between band structure and DOS analyses [51]. The pristine MoI₃ monolayer exhibits bipolar ferromagnetic semiconductor (BFMS) characteristics, where valence band maximum (VBM) and conduction band minimum (CBM) originate from different spin channels. Upon doping, this property undergoes dramatic transformations:
Table 3: Doping-Induced Electronic Properties in MoI₃ Monolayers
| Dopant | Band Structure Characterization | DOS Characterization | Resulting Electronic Behavior | Consistency Between Methods |
|---|---|---|---|---|
| Sc | Indirect band gap in both spin channels | Asymmetric spin polarization | Ferromagnetic Semiconductor | Moderate |
| Ti | Band gap reduction with spin splitting | Partial spin polarization | Ferromagnetic Semiconductor | Moderate |
| V | Metallic in one spin channel, gapped in other | Strong spin asymmetry near Fermi level | Half Semiconducting (HSC) | High |
| Cr | Complex band crossing behavior | Dual gap structure in different spins | Half Semiconducting (HSC) | Low |
| Mn | Clear metallic majority spin channel | Strong majority spin at Fermi level | Half-Metallic Ferromagnet | High |
The discrepancy emerges particularly with Cr doping, where band structure suggests complex band crossing behavior while DOS indicates a dual gap structure. This inconsistency stems from the momentum-resolved versus momentum-integrated information each method provides. The band structure reveals specific k-points where bands cross the Fermi level, while DOS integrates these effects across the entire Brillouin zone, potentially obscuring momentum-dependent phenomena.
The researchers found that "substitutional doping of MoI₃ monolayers with Sc and Ti atoms changes their electronic character from a BFMS to a ferromagnetic semiconductor, while V- and Cr-doped MoI₃ monolayers result in half semiconducting properties (HSC). More interestingly, the Mn-doped MoI₃ monolayer reveals a half-metallic character with enhanced magnetism" [51]. These transformations affect band structure and DOS differently, creating apparent contradictions that actually reflect complementary information rather than computational error.
The Scientist's Toolkit: Essential Research Reagents and Computational Materials
Computational Reagents and Methodological Solutions
Addressing discrepancies between band structure and DOS calculations requires specialized computational "reagents" and methodological approaches. The following toolkit provides essential resources for resolving these inconsistencies:
Table 4: Essential Research Reagents for Electronic Structure Consistency
| Research Reagent | Function | Application Context | Impact on BS/DOS Consistency |
|---|---|---|---|
| Hybrid Functionals (HSE06) | Mixes exact Hartree-Fock exchange with DFT exchange | Reduces self-interaction error in band gap | Improves consistency by improving fundamental gap description |
| DFT+U Methodology | Adds Hubbard parameter for strong electron correlation | Transition metal oxides, magnetic materials | Resolves inconsistency in magnetic systems like CuO |
| GW Approximation | Many-body perturbation theory for quasiparticles | Accurate band gap prediction beyond DFT | Gold standard but computationally expensive |
| k-point Convergence Tools | Automated k-grid optimization | Ensuring consistent Brillouin zone sampling | Addresses sampling discrepancy between BS and DOS |
| Spin-Orbit Coupling (SOC) | Relativistic electron interaction treatment | Heavy elements, magnetic anisotropy | Corrects band splitting in spin-polarized systems |
| AIMD Simulations | Ab initio molecular dynamics for stability | Verifying structural and thermal stability | Ensures calculated properties correspond to stable structures |
| Phonon Dispersion Calculations | Lattice dynamics analysis | Dynamic stability assessment | Confirms physical realizability of structures |
Protocol Implementation for Consistency Assurance
Implementing a systematic protocol for ensuring consistency between band structure and DOS calculations requires specific methodological rigor:
k-space Consistency Protocol:
- Perform k-point convergence testing separately for band structure and DOS
- Establish minimum k-grid density where DOS converges within 0.01 eV
- Ensure band structure interpolation uses sufficient points between high-symmetry points
- Validate that the DOS integral matches the total electron count
Methodological Hierarchy Application:
- Begin with standard DFT (PBE/LDA) for initial structure optimization
- Progress to meta-GGA (mBJ) or hybrid (HSE06) functionals for improved gaps
- Apply DFT+U for systems with localized d/f electrons
- Consider GW methods for final validation where computationally feasible
Magnetic Structure Validation:
- Test multiple magnetic configurations (ferromagnetic, antiferromagnetic)
- Compare total energies to identify ground magnetic state
- Verify magnetic moment alignment with experimental data
- Implement specialized magnetic space groups when appropriate
As demonstrated in the systematic benchmark, "replacing the PPA with a full-frequency integration of the dielectric screening improves the predictions dramatically, almost matching the accuracy of the QSGŴ" [35], highlighting the importance of methodological choices in resolving discrepancies.
The discrepancy between band structure and density of states analyses represents a critical challenge in computational materials science, but systematic methodology can resolve these inconsistencies. Through the case studies of copper oxide and doped MoI₃ monolayers, we have identified that the root causes include: (1) inadequate k-space sampling differences between the two methods, (2) improper treatment of electron correlation in magnetic and strongly-correlated systems, (3) insufficient physical models for complex phenomena like cycloidal magnetic ordering, and (4) methodological limitations of standard DFT approaches.
The path forward requires rigorous validation protocols, including k-point convergence testing, methodological hierarchy implementation, and physical accuracy verification against experimental data. As the benchmark study concludes, advanced methods like QSGŴ "eliminate the overestimation, producing band gaps that are so accurate that they even reliably flag questionable experimental measurements" [35]. This represents the ultimate goal: computational methodologies sufficiently robust to not only achieve internal consistency between different electronic structure representations but also to challenge and refine experimental understanding.
By adopting the systematic approaches and computational reagents outlined in this guide, researchers can transform the band structure/DOS discrepancy from a frustrating computational artifact into a valuable diagnostic tool for identifying physical and methodological limitations in electronic structure calculations.
Diagnosing and Resolving Band Structure-DOS Mismatches
Systematic Verification of Calculation Parameters
In computational materials science, electronic structure calculations using Density Functional Theory (DFT) provide fundamental insights into material properties. Researchers routinely calculate two key electronic properties: the electronic band structure, which describes the energy-momentum relationship of electrons along high-symmetry paths in the Brillouin zone, and the density of states (DOS), which quantifies the number of electronic states per unit energy. In principle, these two representations must yield consistent physical information, such as identical band gap values and aligned energy positions for electronic features.
However, practitioners frequently encounter troubling disagreements between band structure and DOS calculations, where apparent inconsistencies in band gaps, energy alignment, or spectral features suggest computational artifacts rather than physical reality. These discrepancies often stem from inadequate calculation parameters rather than methodological errors, creating a critical need for systematic verification protocols to ensure computational reliability. This guide establishes comprehensive methodologies for parameter verification, enabling researchers to diagnose and resolve these common inconsistencies.
Fundamental Concepts and Common Discrepancies
Theoretical Foundation of Band Structure and DOS
The electronic density of states (DOS) is defined as the number of allowed electron states per unit energy range per unit volume, mathematically expressed as ( D(E) = \frac{1}{V} \sum{i=1}^{N} \delta(E - E(\mathbf{k}i)) ), where ( V ) represents volume, ( N ) is the number of energy levels, and ( \delta ) is the Dirac delta function [52]. In practical calculations, this discrete sum is approximated using various smearing techniques.
Band structure calculations solve the Kohn-Sham equations along high-symmetry paths in the Brillouin zone, tracing the energy eigenvalues ( E(\mathbf{k}) ) for each wave vector ( \mathbf{k} ). The resulting band dispersion and DOS provide complementary views of the electronic structure: band structures reveal directional dependence and carrier effective masses, while DOS quantifies state availability at specific energies and is crucial for understanding optical properties and transport phenomena [53] [52].
Common Types of Discrepancies and Their Implications
Several characteristic discrepancies frequently arise between band structure and DOS calculations:
Band Gap Inconsistencies: The most reported discrepancy involves differing band gap values extracted from band structure versus DOS calculations. For instance, Materials Project database entry mp-19092 for Co₂W₂O₈ shows a DOS-derived band gap of 2.283 eV that cannot be reconciled with the plotted band structure, suggesting potential Fermi level misalignment or computational artifacts [54].
Missing DOS Features: In one documented case for a MoS₂-based slab structure, the band structure clearly showed bands between -5.6 and -5.2 eV, yet the DOS in this energy region was zero. This missing DOS problem was traced to insufficient k-point sampling in the DOS calculation [55].
Energy Alignment Issues: Apparent vertical shifts between band structure and DOS plots may occur when different Fermi level alignment protocols are applied to each calculation. This frequently arises when calculations are performed at different times or with different parameter sets [54].
Table 1: Common Band Structure and DOS Discrepancies and Their Usual Causes
| Discrepancy Type | Manifestation | Common Root Causes |
|---|---|---|
| Band Gap Mismatch | Different band gap values from BS vs. DOS | Different k-meshes, Fermi level misalignment, insufficient basis set |
| Missing DOS Features | Bands visible in BS but absent in DOS | Inadequate k-point sampling for DOS, different Brillouin zone integration methods |
| Energy Misalignment | Vertical offset between BS and DOS energy scales | Inconsistent Fermi level referencing, different scf convergence criteria |
| Spectral Shape Differences | Varying relative peak heights | Different smearing methods and widths, tetrahedron vs. Gaussian integration |
Critical Parameters Requiring Verification
k-Point Sampling Convergence
k-point sampling represents one of the most critical parameters affecting consistency between band structure and DOS calculations. The DOS calculation requires integration over the entire Brillouin zone and thus depends heavily on a dense, well-converged k-point mesh. In contrast, band structure calculations typically follow high-symmetry paths with much denser sampling along these lines [56].
The fundamental issue arises when different k-point sampling schemes are used for the two calculations without proper validation. For instance, using a sparse k-mesh for DOS calculation while employing a dense k-path for band structure guarantees inconsistencies. The case of the MoS₂-based slab demonstrates this clearly: the initial calculation with normal k-sampling showed missing DOS, which was resolved by increasing the k-space quality to "good" or by restarting the DOS calculation with a finer k-grid [55].
Table 2: k-Point Sampling Verification Protocols
| Parameter | Verification Method | Convergence Criterion | Typical Values |
|---|---|---|---|
| SCF k-mesh density | Total energy variation vs. k-points | Energy change < 1-5 meV/atom | 4×4×4 to 12×12×12 depending on system |
| DOS k-mesh density | DOS integration convergence | Band gap variation < 0.05 eV | Often 2-3× denser than SCF mesh |
| Band structure k-path density | Smoothness of bands | Visual inspection for discontinuities | 50-100 points per high-symmetry segment |
| Symmetry reduction | nosym flag usage |
Metallic systems require nosym=.TRUE. |
Critical for low-symmetry cases |
Basis Set Completeness and Pseudopotential Selection
The choice of basis set and pseudopotentials significantly impacts computational results. Band structure calculations particularly depend on accurate wavefunction representation, while DOS depends on proper charge density representation. Inconsistent basis sets between calculations can create artificial discrepancies.
For plane-wave codes, the kinetic energy cutoff (ecutwfc) determines basis set completeness. Systematic increase of this parameter until total energy convergence is essential. Similarly, localized basis set codes require verification of basis set size and polarization functions. The pseudopotential approximation must be consistent, as different treatments of core electrons (particularly problematic for lanthanides) can create dramatic inconsistencies [57].
Fermi Level Alignment and Reference Energies
Proper Fermi level alignment represents perhaps the most frequently overlooked parameter in ensuring band structure and DOS consistency. Different computational packages may apply different Fermi level calculation protocols, leading to apparent energy shifts between calculations.
The DOS should be referenced to the same Fermi level as the band structure, typically set to zero in plots. However, automated plotting scripts sometimes apply different referencing, creating artificial discrepancies. As noted in the Co₂W₂O₄ case, "If you 'move' the DOS graph down, you can 'fix' the problem," suggesting a Fermi level alignment issue [54]. Verification requires confirming that both representations use identical Fermi energy values, typically obtained from the same SCF calculation.
Fermi Level Alignment Workflow
Systematic Verification Protocols
Comprehensive Parameter Verification Workflow
A systematic approach to parameter verification ensures consistency between band structure and DOS calculations. The following workflow provides a step-by-step methodology for identifying and resolving discrepancies:
Systematic Parameter Verification Workflow
k-Point Convergence Verification Methodology
k-point sampling verification requires a rigorous approach:
SCF Convergence: Perform consecutive calculations with increasing k-mesh density until total energy changes by less than 1 meV/atom. Record the converged k-mesh for production calculations.
DOS k-Mesh Verification: Using the converged SCF charge density, calculate DOS with progressively denser k-meshes until the integrated DOS and band edges show variations smaller than 0.05 eV. As demonstrated in the MoS₂ case, restart capabilities can efficiently refine DOS k-sampling without repeating the full SCF calculation [55].
Band Path Consistency: Ensure the k-path for band structure calculation adequately samples all high-symmetry points. For complex structures, consult resources like the Bilbao Crystallographic Server to verify appropriate k-path selection [58].
Symmetry Considerations: For systems with low symmetry or metallic character, disable symmetry reduction (
nosym = .TRUE.) to ensure complete k-space sampling [56].
Cross-Verification of Band Structure and DOS
Direct numerical comparison between band structure and DOS provides the most rigorous consistency check:
High-Symmetry Point Analysis: Extract DOS values at specific high-symmetry points where band structure shows critical features (band edges, van Hove singularities). These should correspond closely in energy.
Band Gap Consistency: Compare the fundamental band gap obtained from direct inspection of the band structure with the gap observed in the DOS. Discrepancies greater than 0.1 eV indicate parameter issues.
Integration Verification: For selected energy ranges, manually integrate the DOS and compare with the number of bands expected from band structure analysis.
Table 3: Quantitative Verification Criteria for BS/DOS Consistency
| Verification Metric | Acceptable Tolerance | Diagnostic Procedure | Corrective Action |
|---|---|---|---|
| Fundamental Band Gap | < 0.05 eV difference | Compare direct gap from BS with DOS band edges | Increase k-points, check pseudopotentials |
| Energy Position of Features | < 0.02 eV for sharp peaks | Align Fermi levels, compare critical points | Ensure identical Fermi level reference |
| Relative Peak Heights | Visual similarity | Compare DOS with band velocities at critical points | Adjust smearing, use tetrahedron method |
| Spectral Weight Integration | < 1% error in state counting | Integrate DOS over energy ranges, count bands | Increase k-points, check Brillouin zone sampling |
Case Studies and Experimental Protocols
Case Study: Missing DOS in MoS₂-Based Structure
The documented case of missing DOS in a MoS₂-based slab structure provides an excellent protocol for parameter verification [55]:
Initial Observation: Clear bands between -5.6 and -5.2 eV in the band structure, but zero DOS in this energy region.
Diagnosis Procedure:
- Compared k-point sampling between band structure (dense along path) and DOS (sparse full-zone mesh)
- Identified insufficient k-grid for DOS calculation as root cause
Resolution Methods:
- Complete recalculation: Performed full SCF calculation with improved k-space quality ("good" setting)
- Efficient restart: Used restart functionality to compute DOS with finer k-grid from previous calculation
Results: Both methods resolved the missing DOS problem, with the restart approach providing computational efficiency. The final verification confirmed DOS presence between -5.6 and -5.2 eV, matching band structure features.
Case Study: Antiferromagnetic Co₂W₂O₈ Discrepancy
The Materials Project entry for Co₂W₂O₈ demonstrates more complex discrepancies potentially arising from magnetic structure treatment [54]:
Observed Inconsistencies:
- Reported band gap of 2.283 eV from DOS incompatible with band structure plot
- Potential Fermi level misalignment between representations
- Possible inconsistency in magnetic configuration treatment
Diagnosis Insights:
- INCAR parameters suggested FM calculation while database indicated AFM ground state
- Initial magnetic moments potentially misplaced on W atoms rather than Co atoms
- Suspected different magnetic configurations between BS and DOS calculations
Verification Protocol:
- Reproduce calculation with consistent magnetic parameters
- Ensure identical
ISPIN,MAGMOM, and U values in DFT+U for both calculations - Verify Fermi level alignment from same SCF calculation
- Check spin-polarized band structure and DOS consistency in each spin channel
Quantum Espresso DOS Calculation Protocol
For reliable DOS calculations in Quantum Espresso, follow this verified protocol [56]:
SCF Calculation:
Use converged k-mesh from previous verification, adequate
ecutwfc, and experimental lattice constants (not theoretical values to avoid spurious stress).NSCF Calculation for DOS:
- Set
occupations = 'tetrahedra'in&SYSTEMcard (appropriate for DOS) - Use significantly denser k-point grid (e.g., 12×12×12 for silicon)
- Set
nosym = .TRUE.for low-symmetry cases - Specify appropriate
nbndto include unoccupied states - Maintain identical
outdirandprefixas SCF calculation
- Set
DOS Calculation:
Specify energy range (
emin,emax) covering all relevant bands and Fermi level alignment.
Advanced Considerations and Special Cases
Disordered Structures and Configurational Averaging
Disordered structures, such as the La₄₋ₓCaₓSi₁₂O₃₊ₓN₁₈₋ₓ oxynitride phosphor host, present special challenges for DOS and band structure consistency [57]. With multiple partially occupied sites and numerous possible configurations (5,184 for this system), different parameter choices can dramatically affect results.
Verification Strategies for Disordered Systems:
- Configuration Selection: Use genetic algorithms (e.g., NSGA-II) to identify representative configurations rather than exhaustive enumeration
- Averaging Protocol: Employ Boltzmann-weighted averaging over selected configurations using the site occupancy disorder (SOD) approach
- Band Gap Maximization: For insulators, target configurations with maximized band gaps, which typically better approximate experimental values
Magnetic and Strongly Correlated Systems
Magnetic systems like the Co₂W₂O₈ case require special verification procedures [54]:
- Spin Consistency: Ensure identical spin treatment (
ISPINsetting) in band structure and DOS calculations - Magnetic Configuration: Verify consistent magnetic moment initialization (
MAGMOM) for both calculations - DFT+U Parameters: Apply identical U and J values for strongly correlated electrons
- Spin-Projected Analysis: Compare spin-projected band structures with spin-resolved DOS
The Scientist's Toolkit: Essential Verification Utilities
Table 4: Essential Computational Tools for Parameter Verification
| Tool/Utility | Function | Application Context |
|---|---|---|
| Eig2DOS | Converts eigenvalue files to DOS | SIESTA calculations [58] |
| gnubands | Processes and plots band structure | SIESTA compatibility [58] |
| mprop | Projects DOS onto specific orbitals | Orbital-projected DOS analysis [58] |
| fat | Generates fat-band structures | Wavefunction projection visualization [58] |
| VASP | Plane-wave DFT code | General-purpose electronic structure [57] |
| Quantum Espresso | Plane-wave DFT code | Open-source electronic structure [56] |
| PAOFLOW | Derives tight-binding Hamiltonians | Quantum computing interface [59] |
| SOD Program | Handles site occupancy disorder | Disordered structure calculations [57] |
Systematic verification of calculation parameters represents an essential practice in computational materials science. The methodologies outlined in this guide provide researchers with comprehensive protocols for ensuring consistency between band structure and density of states calculations. By rigorously verifying k-point sampling, basis set completeness, Fermi level alignment, and system-specific parameters, practitioners can eliminate computational artifacts and focus on physically meaningful results. As computational databases expand and machine learning approaches increasingly rely on consistent electronic structure data [60] [23], these verification procedures will grow ever more critical for materials discovery and design.
Optimizing k-point Grids for DOS vs. Band Structure Calculations
A frequent challenge in density functional theory (DFT) calculations is the apparent mismatch between the band gap measured from a band structure plot and the gap observed in the density of states (DOS). This discrepancy is not necessarily an error but often stems from fundamental methodological differences in how these two properties are computed. The band structure provides energy levels along specific, high-symmetry paths in the Brillouin zone, while the DOS integrates information from all possible k-points in the Brillouin zone [4]. Consequently, the minimal fundamental band gap might occur at a k-point not included in the chosen band structure path, leading to a situation where the band structure shows a gap, but the DOS appears metallic or has a smaller gap because the integration over the entire zone captures points with smaller energy separations [3]. This guide details the origin of this issue and provides systematic protocols for converging k-point grids to ensure consistent results.
Theoretical Foundations: Band Structure and DOS
The Role of the Brillouin Zone
In periodic solids, the electronic states are characterized by their behavior under translation, leading to Bloch's theorem and the description of electrons by their crystal momentum, k, within the Brillouin zone (BZ). The BZ is the unit cell in reciprocal space, and all unique electronic states are contained within it [61]. Physical properties, such as the total energy or the DOS, require integration over all possible k-points in the BZ.
- Band Structure: A band structure calculation plots the electronic energy eigenvalues along a one-dimensional path connecting specific high-symmetry k-points in the BZ. It reveals direct and indirect gaps and the effective mass of carriers along specific crystal directions.
- Density of States (DOS): The DOS calculates the number of electronic states per unit energy at a given energy. It is obtained by summing the contributions from all electronic states across the entire Brillouin zone [4]. The DOS provides no direct information about the crystal momentum of the electrons.
The K-point Sampling Problem
For numerical calculations, the continuous integral over the BZ is replaced by a discrete sum over a finite set of k-points. The central challenge is that the k-point density required to achieve a converged total energy is often significantly lower than the density required to converge the DOS, especially near the band edges where small gaps might be smeared out or missed entirely with coarse sampling [61]. As one forum contributor succinctly stated, "The DOS integrate over all k-points in the Brillouin zone," and if the band structure path "does not contain the point where the minimal gap is located," a discrepancy will arise [3].
Quantitative Analysis of K-point Convergence
The table below summarizes recommended k-point sampling strategies for different properties, compiled from literature and practical advice.
Table 1: K-point Sampling Guidelines for Different Calculation Types
| Calculation Type | Recommended K-point Sampling | Key Considerations |
|---|---|---|
| Total Energy | Varies by system; ~5,000 k-points/Å⁻³ for 1 meV/atom accuracy [61] | Convergence is variational and relatively robust. |
| Band Structure | Path along high-symmetry lines; single point energy calculations. | Sampled path may miss the actual band gap [4]. |
| Density of States (DOS) | Extremely dense mesh (e.g., 200x200x1 for 2D materials) [3] | Requires full zone integration; tetrahedron method is preferred [3]. |
| Metallic Systems | Denser sampling than insulators; smearing methods required [61] | Needed to accurately describe the Fermi surface. |
Experimental Protocols for K-point Convergence
A Workflow for Consistent DOS and Band Structure
To resolve mismatches, a systematic approach to k-point convergence is essential. The following workflow ensures that the DOS and band structure calculations are based on the same physical information.
Detailed Methodology
Initial Scoping Calculation:
- Begin with a structurally optimized system.
- Perform a self-consistent field (SCF) calculation using a moderately dense k-point grid. A grid with a maximum spacing of ~0.04 × 2π Å⁻¹ is a reasonable starting point for many systems [62].
Band Structure Analysis:
- Using the converged charge density from the SCF calculation, perform a non-self-consistent (NSCF) band structure calculation along a path covering all high-symmetry points in the Brillouin zone.
- Critical Step: Analyze the band structure to identify the valence band maximum (VBM) and conduction band minimum (CBM). Determine if the gap is direct or indirect and note the specific k-points where these extrema occur.
High-Resolution DOS Calculation:
- Perform a separate NSCF calculation on a significantly denser k-point mesh spanning the entire Brillouin zone to compute the DOS. For example, whereas the initial SCF might use a 16x16x16 mesh, the DOS may require a 24x24x24 mesh or finer [62]. For 2D materials, meshes of 200x200x1 or 300x300x1 are recommended [3].
- Integration Method: Use the tetrahedron method (Blöchl corrections) for integration, as it is generally superior to Gaussian smearing for accurately capturing band gaps and sharp features in the DOS [3].
Validation and Iteration:
- Compare the band gap from the band structure (the energy difference between the CBM and VBM, regardless of their k-point location) with the gap observed in the DOS.
- If a significant discrepancy remains, iteratively increase the density of the k-point grid used for the DOS calculation until the gaps converge to the same value.
The Scientist's Toolkit: Essential Computational Reagents
Table 2: Key Software and Computational "Reagents" for K-point Convergence
| Tool / Reagent | Function | Application Note |
|---|---|---|
| Monkhorst-Pack Grids [61] | Generates uniform k-point meshes for SCF and DOS calculations. | The standard for integration over the full Brillouin zone. |
| Tetrahedron Method [3] | A sophisticated integration technique for the DOS. | Preferred over Gaussian smearing for accurate band gap determination. |
| High-Symmetry Paths | Defines the trajectory for band structure plots. | Paths must be chosen carefully to include all potential gap extrema. |
| Quantum ESPRESSO [62] | A popular open-source suite for DFT calculations. | Used in high-pressure phase studies of materials like SrTeO₄ [62]. |
| Questaal [35] | An all-electron code for advanced MBPT (GW) calculations. | Used for high-accuracy benchmarks beyond DFT [35]. |
Advanced Considerations: Metals, Smearing, and Beyond DFT
For metallic systems, the challenge of k-point convergence is amplified due to the need to accurately describe the Fermi surface. The choice of smearing method (e.g., Gaussian, Fermi-Dirac, Methfessel-Paxton) and its width becomes critical [61]. A smearing width that is too large can artificially smear a small band gap, making a semiconductor appear metallic in the DOS [4]. Furthermore, when moving beyond standard DFT to more accurate methods like many-body perturbation theory in the GW approximation, the choice of k-point grid remains crucial. Full-frequency GW methods have been shown to provide dramatically improved band gap predictions compared to simpler plasmon-pole models [35].
The discrepancy between band structure and DOS is a classic convergence problem in computational materials science. It is resolved not by treating it as a software error, but by understanding the underlying physical principles and applying rigorous convergence protocols. By implementing the systematic workflow and quantitative guidelines outlined in this guide—particularly the use of ultra-fine k-point meshes for DOS and careful identification of the minimal gap location—researchers can ensure consistent and physically meaningful results across all their electronic structure analyses.
Addressing Magnetic State Convergence Issues
Achieving convergence in calculations of magnetic materials represents a significant challenge in computational materials science, particularly when using Density Functional Theory (DFT) and related methods. These convergence issues frequently manifest as discrepancies between calculated electronic properties—such as band structure and density of states (DOS)—and experimental observations or theoretical predictions. The problem stems from the complex energy landscape of magnetic systems, where multiple local minima can trap calculations in unphysical magnetic configurations, leading to inaccurate representations of material properties. This technical guide examines the root causes of these convergence challenges and provides detailed methodologies for addressing them systematically.
The convergence problem is particularly pronounced in strongly correlated systems and complex magnetic structures, where electron-electron interactions play a crucial role in determining ground-state properties. As noted in benchmark studies comparing many-body perturbation theory with DFT, methodological choices significantly impact the accuracy of predicted band gaps in magnetic semiconductors and insulators [35]. These limitations become especially problematic when computational results fail to align with research expectations, potentially leading to misinterpretation of material behavior and incorrect predictions for technological applications.
Root Causes of Convergence Problems
Methodological Limitations
Convergence challenges in magnetic systems often originate from fundamental methodological limitations in computational approaches:
Starting-point dependence: Traditional one-shot $G0W0$ calculations using plasmon-pole approximations show only marginal accuracy improvements over the best DFT methods despite higher computational costs, particularly for magnetic semiconductors [35].
Self-consistency gaps: Quasiparticle self-consistent $GW$ (QS$GW$) approaches, while removing starting-point bias, systematically overestimate experimental band gaps by approximately 15% in magnetic systems [35].
Incomplete correlation treatment: Standard DFT functionals often fail to adequately capture strong electron correlations in magnetic materials, necessitating the use of DFT+U corrections that introduce their own convergence challenges [63].
Numerical Instabilities
Numerical issues frequently exacerbate convergence problems in magnetic systems:
Charge mixing instabilities: The interplay between charge density mixing and magnetic moment evolution creates oscillatory behavior during self-consistent field (SCF) cycles.
K-point sampling sensitivity: Magnetic systems often require dense k-point meshes for accurate representation of Fermi surface and magnetic interactions, increasing computational cost and convergence difficulty.
Basis set limitations: Incomplete basis set representations can artificially constrain magnetic moment development, particularly in systems with complex spin textures.
Table 1: Common Convergence Failure Indicators in Magnetic Calculations
| Indicator | Typical Manifestation | Impact on Results |
|---|---|---|
| SCF Oscillations | Total energy fluctuations > 0.05 Ry | Unphysical magnetic moments and charges |
| Charge Divergence | Increasing total energy with iterations | Complete failure to reach ground state |
| Magnetic Moment Drift | Non-converging local moments | Incorrect magnetic ordering prediction |
| Force Discrepancies | Inconsistent forces on magnetic atoms | Unreliable geometry optimization |
Systematic Troubleshooting Framework
Diagnostic Protocol
Implement a systematic diagnostic approach when encountering magnetic convergence issues:
Initial State Assessment:
- Verify the suitability of initial magnetic moments and ordering
- Confirm lattice parameters and atomic positions are optimized
- Assess symmetry constraints that might artificially restrict magnetic solutions
SCF Cycle Analysis:
- Monitor total energy, magnetization, and band structure energy evolution
- Identify oscillatory patterns indicating trapping in local minima
- Check for charge sloshing between spin channels
Parameter Sensitivity Testing:
- Evaluate convergence behavior across different mixing parameters
- Test k-point density requirements
- Assess basis set completeness effects
Advanced Mixing Techniques
Improved charge density mixing strategies can significantly enhance convergence:
- Adaptive mixing: Implement mixing schemes that dynamically adjust based on SCF history
- Spin-channel separation: Apply different mixing parameters for different spin components
- Preconditioning: Utilize Kerker or other preconditioners to damp long-wavelength charge oscillations
The following workflow diagram illustrates a comprehensive approach to diagnosing and addressing magnetic convergence issues:
Diagram 1: Magnetic Convergence Troubleshooting Workflow
DFT+U Implementation Strategies
U Parameter Selection
The Hubbard U parameter correction addresses self-interaction errors in DFT but introduces convergence challenges:
System-specific determination: U values must be carefully determined for each material system, as evidenced by studies on Ru-based compounds where U = 4.5-4.8 eV was applied [64].
Convergence sensitivity: Larger U values generally increase convergence difficulty, requiring more sophisticated mixing schemes and potentially longer computation times.
Orbital selectivity: Applying U corrections to specific orbitals (e.g., transition metal d-orbitals, ligand p-orbitals) can improve accuracy but complicates convergence.
U-Ramping Technique
A proven approach for difficult convergence scenarios involves gradually increasing the U parameter:
- Begin with U = 0 and achieve SCF convergence
- Use the converged charge density as input for a calculation with small U (e.g., 0.5 eV)
- Incrementally increase U in steps of 0.5-1.0 eV, using the previous step's charge density
- Continue until reaching the target U value
This method effectively "guides" the system through the energy landscape, avoiding the traps that cause convergence failure when applying the full U correction initially [64].
Table 2: U Parameter Selection Guidelines for Magnetic Elements
| Element | Typical U Range (eV) | Orbital Focus | Convergence Notes |
|---|---|---|---|
| Ru | 4.5-4.8 [64] | 4d | Particularly challenging in chlorides |
| Mn | 3.0-4.5 [63] | 3d | Varies with oxidation state |
| Fe | 3.5-5.0 [36] | 3d | System-dependent optimal values |
| Cu | 5.0-7.0 | 3d | Often needed in oxides |
Practical Implementation Protocols
Quantum ESPRESSO Workflow
Based on successful convergence of challenging systems like α-RuCl₃, the following protocol is recommended:
Initial Collinear Magnetic Calculation:
Achieve convergence with this simplified magnetic configuration before progressing to more complex noncollinear calculations [64].
U Implementation:
After establishing collinear magnetic convergence, introduce U corrections using the ramping approach described in Section 4.2.
Mixing Optimization:
Adjust mixing_beta downward (0.05-0.2) for oscillatory systems and upward (0.3-0.7) for slow convergence [64].
Advanced Initialization Techniques
Stepwise Symmetry Reduction:
- Begin with high symmetry and constrained magnetic moments
- Gradually reduce symmetry constraints while maintaining magnetic order
- Allow full symmetry relaxation in final steps
Multiple Restart Approach:
- Maintain a library of converged charge densities from similar systems
- Test multiple starting points to identify global minimum
- Use projectability analysis to select optimal initial states
The following diagram illustrates the recommended stepwise approach for implementing DFT+U calculations in magnetic systems:
Diagram 2: Stepwise DFT+U Implementation Protocol
Research Reagent Solutions: Computational Tools
Table 3: Essential Computational Tools for Magnetic System Calculations
| Tool/Software | Primary Function | Application in Magnetic Systems |
|---|---|---|
| Quantum ESPRESSO | DFT/DFT+U calculations | Core platform for magnetic structure optimization [64] |
| Yambo | GW many-body calculations | Benchmarking DFT results for magnetic semiconductors [35] |
| VASP | DFT/DFT+U with PAW pseudopotentials | Electronic structure analysis of magnetic materials [63] |
| Questaal | All-electron LSDA/GW | QSGW and QS$G\hat{W}$ for accurate band structures [35] |
| U-ramping scripts | Custom workflow automation | Gradual U implementation for difficult convergence cases [64] |
Interpretation of Results and Validation
Benchmarking Against Experimental Data
When band structure and DOS calculations disagree with research expectations:
Systematic benchmarking: Compare with high-quality experimental data, recognizing that sometimes accurate computational results may flag questionable experimental measurements [35].
Methodological hierarchy: Validate results across multiple computational approaches (DFT, DFT+U, GW) to identify consistent trends.
Critical assessment: For magnetic semiconductors like CuMnO₂, verify whether calculated spin polarization (100% in some cases) aligns with transport measurements [63].
Addressing Common Discrepancies
Band gap errors: Recognize that standard DFT systematically underestimates band gaps, while QSGW overestimates them by ~15%; QS$G\hat{W}$ with vertex corrections typically provides the most accurate results [35].
Magnetic moment quantification: Ensure proper accounting of all atomic contributions and the total cell moment, as incomplete accounting can explain discrepancies with experimental measurements [63].
Spin-polarized transport: For spintronic applications, verify that calculated spin polarization aligns with transport behavior expectations, as seen in CuMnO₂ tunnel junction simulations [63].
Addressing magnetic state convergence issues requires a systematic approach that combines methodological understanding, practical implementation strategies, and careful result interpretation. By implementing the protocols outlined in this guide—including stepwise U parameter implementation, optimized mixing schemes, and hierarchical validation—researchers can significantly improve the reliability of their computational predictions for magnetic materials. The persistent discrepancies between band structure/DOS calculations and research expectations often stem from the inherent limitations of standard DFT approaches for strongly correlated systems, necessitating advanced many-body techniques or carefully parameterized DFT+U corrections. Through methodical troubleshooting and comprehensive validation, these convergence challenges can be overcome, leading to more accurate predictions of magnetic material properties for both fundamental research and technological applications.
Fermi Level Alignment and Reference Point Consistency
In computational materials science, inconsistencies between band structure diagrams and density of states (DOS) plots represent a significant challenge in accurately interpreting electronic structure calculations. This technical guide examines the fundamental principles of Fermi level alignment and reference point consistency as primary sources of these discrepancies, providing researchers with methodological frameworks to identify, troubleshoot, and resolve these issues in their computational workflows.
Theoretical Foundations
Fermi Level in Electronic Structure Calculations
The Fermi level (E_F) represents the chemical potential of electrons in a material and serves as the reference energy in electronic structure calculations. In periodic systems, it separates occupied from unoccupied electron states at absolute zero temperature. Consistent alignment of this reference point across different computational methods is essential for meaningful comparison between band structure and DOS data.
In practice, the Fermi level is determined differently in band structure versus DOS calculations. Band structure calculations typically compute electron energies along high-symmetry paths in the Brillouin zone, while DOS calculations involve integration over the entire Brillouin zone. This fundamental methodological difference can lead to inconsistent Fermi level positioning if not properly accounted for in post-processing.
Relationship Between Band Structure and DOS
The density of states describes the number of electronic states per unit volume per unit energy, while band structure illustrates the energy-momentum dispersion relations along specific k-point paths. Theoretically, these representations should provide consistent information about a material's electronic structure, as the DOS can be derived from the band structure through integration over the Brillouin zone [65]:
DOS(E) = (1/Ω) × Σn∫(BZ) δ(E - E_n(k)) dk
where Ω is the volume of the Brillouin zone, n is the band index, and E_n(k) is the energy of the nth band at point k. Discrepancies arise when numerical implementations, sampling methodologies, or reference points differ between these complementary analyses.
Computational Parameters and Methodological Divergences
Inconsistent computational parameters between band structure and DOS calculations represent the most common source of discrepancy. The table below summarizes key parameters that require consistency:
Table 1: Critical Computational Parameters Requiring Consistency
| Parameter | Band Structure Impact | DOS Impact | Consistency Requirement |
|---|---|---|---|
| k-point sampling | Path through Brillouin zone | Grid covering entire Brillouin zone | Same level of convergence |
| Energy cutoff | Determines basis set completeness | Affects all energy calculations | Identical values |
| Brillouin zone integration | Smearing method affects occupation | Directly impacts peak shapes | Identical smearing parameters |
| SCF convergence | Affects Hamiltonian accuracy | Affects Hamiltonian accuracy | Same convergence criteria |
| Spin-orbit coupling | Modifies band dispersion | Alters orbital projections | Identical treatment [65] |
As observed in VASP calculations, inconsistent k-point sampling between band structure (linear k-path) and DOS (uniform k-grid) calculations frequently causes misalignment, particularly in metallic systems where Fermi surface complexity demands dense sampling [66].
Fermi Level Determination and Reference Point Errors
The Fermi level can be determined through different algorithms in various computational packages, leading to potential misalignment:
Table 2: Fermi Level Determination Methods and Potential Errors
| Method | Implementation | Advantages | Potential Errors |
|---|---|---|---|
| Occupancy-based | Finds energy where integrated DOS equals number of electrons | Theoretically rigorous | Sensitive to k-point sampling |
| Fixed reference | Uses electrostatic potential as reference | Consistent with core levels | Requires proper vacuum level alignment |
| Hybrid methods | Combination of electrostatic and occupancy approaches | Balances numerical and physical considerations | Implementation-specific variations |
In doped systems such as Ti-doped MoI₃ monolayers, additional complications arise from impurity states that may be inadequately sampled in DOS calculations but appear prominently in band structure diagrams [66] [67]. This sampling disparity creates apparent contradictions between the two representations.
Post-Processing and Visualization Artifacts
Visualization parameters can introduce artificial discrepancies between band structure and DOS plots:
- Energy broadening: DOS calculations typically apply Gaussian or Lorentzian broadening, while band structure plots show discrete lines
- Orbital projections: Partial DOS (PDOS) calculations may use different projection operators than fat-band analyses
- Fermi level shifting: Manual adjustment of the Fermi level to zero in plots without consistent application
As documented in QuantumATK forums, these visualization artifacts can create the illusion of missing orbital contributions in PDOS despite their presence in band structure calculations [67].
Experimental Protocols for Consistency Verification
Standardized Calculation Workflow
To ensure consistency between band structure and DOS, implement the following standardized protocol:
Convergence Testing
- Perform systematic k-point convergence for total energy (ΔE < 1 meV/atom)
- Establish minimum k-point density for DOS calculations (typically > 1000/atom in reciprocal space)
- Confirm energy cutoff convergence (ΔE < 1 meV/atom)
Self-Consistent Field (SCF) Calculation
- Use identical SCF parameters for both band structure and DOS calculations
- Employ tighter electronic convergence criteria (EDIFF = 1×10⁻⁶ eV or lower) [66]
- Maintain consistent treatment of exchange-correlation functional
Non-SCF Band Structure Calculation
- Use CHGCAR from converged SCF calculation as input
- Maintain identical POTCAR, INCAR parameters (except ICHARG)
- Ensure consistent k-path sampling with SCF calculation
DOS Calculation
- Use identical charge density as band structure calculation
- Employ denser k-grid than SCF calculation (KSPACING ≤ 0.3 for metals)
- Use LORBIT = 11 for projected DOS output [66]
Fermi Level Alignment Protocol
Implement this verification protocol to confirm proper Fermi level alignment:
Reference Point Establishment
- Calculate electrostatic potential in vacuum region for surfaces
- Use core level states as internal reference for bulk materials
- Confirm consistency between potential-derived and occupancy-derived Fermi levels
Cross-Verification Procedure
- Integrate DOS to confirm electron count matches system composition
- Verify number of bands crossing Fermi level matches Fermi surface volume
- Check orbital projections between fat bands and PDOS
Validation Metrics and Acceptance Criteria
Establish quantitative metrics to validate consistency between band structure and DOS:
Table 3: Validation Metrics for Band Structure-DOS Consistency
| Validation Metric | Calculation Method | Acceptance Criterion | ||
|---|---|---|---|---|
| Fermi level alignment | EFband - EFDOS | < 0.01 eV | ||
| Band occupancy | Integration of DOS up to E_F | Should equal number of electrons | ||
| Van Hove singularities | Peak positions in DOS vs. band extrema | Energy difference < 0.02 eV | ||
| Band gap alignment | Direct comparison for semiconductors | Gap difference < 0.05 eV | ||
| Orbital projections | Fat bands vs. PDOS spectral weights | Qualitative consistency |
Case Studies and Troubleshooting
Doped Semiconductor System
In Ti-doped MoI₃ monolayers, researchers observed missing dopant states in PDOS despite clear presence in band structure [66]. The inconsistency originated from:
- k-point sampling disparity: Dense sampling along band path vs. sparse DOS k-grid
- Orbital projection limitations: Inadequate treatment of dopant orbital hybridization
- Methodological inconsistency: Different computational parameters between calculations
Resolution required increasing DOS k-point density to 1×1×100 and ensuring identical LMAXMIX and LORBIT parameters between calculations.
Metallic Systems with Spin-Orbit Coupling
In cubic TlBi calculations with strong spin-orbit coupling, proper treatment required [65]:
- Consistent inclusion of spin-orbit coupling in both band structure and DOS
- Careful alignment of p₁/₂ and p₃/₂ orbital projections between fat bands and PDOS
- Increased k-integration for Fermi surface calculations (KInteg = 9) for smoother DOS
Systematic Troubleshooting Protocol
When inconsistencies appear between band structure and DOS:
Research Reagent Solutions: Computational Materials Science Toolkit
Table 4: Essential Computational Tools for Electronic Structure Analysis
| Tool/Category | Specific Function | Implementation Examples |
|---|---|---|
| DFT Software Packages | Electronic structure calculation | VASP [66], QuantumATK [67], AMS/ADF [65] |
| k-point Sampling Tools | Brillouin zone path generation | SeeK-path, VASP KPOINTS files, AFLOW |
| Visualization Software | Band structure & DOS plotting | VESTA, VASPkit, XCrySDen, matplotlib |
| Post-Processing Tools | Data extraction and analysis | p4vasp, ASE, custom Python/R scripts |
| Convergence Testing | Parameter optimization | VASP convergence scripts, AiiDA |
| Orbital Projection Methods | Partial DOS and fat bands | LORBIT [66], PROCAR analysis, Wannier90 |
Consistent Fermi level alignment and reference point management are fundamental to reliable electronic structure analysis. By implementing standardized protocols, maintaining parameter consistency, and applying systematic validation procedures, researchers can resolve apparent discrepancies between band structure and DOS representations. The methodologies presented in this guide provide a framework for achieving computational rigor in electronic structure calculations, particularly crucial for research in catalysis, semiconductor physics, and materials design where accurate band alignment predictions are essential.
In the realm of computational materials science, accurately predicting electronic properties through density functional theory (DFT) calculations is fundamental to materials design and discovery. The electronic density of states (DOS) and band structure are cornerstone properties that illuminate a material's electrical conductivity, optical characteristics, and catalytic potential. However, researchers frequently encounter a perplexing scenario: despite seemingly converged calculations, the derived DOS fails to align with experimental observations or expected electronic behavior. This discrepancy often originates not from the underlying physical model, but from the numerical technique employed for Brillouin zone integration—the process of summing contributions from electron wavevectors across the crystal's momentum space.
Two predominant families of methods exist for this integration: smearing methods and the tetrahedron method. Smearing methods, including Gaussian and Fermi smearing, approximate the DOS by applying a continuous broadening function to discrete energy eigenvalues. In contrast, the tetrahedron method divides the Brillouin zone into tetrahedral elements and performs linear interpolation of energy eigenvalues within each tetrahedron. The choice between these approaches significantly impacts the fidelity of sharp electronic features and can determine whether computational predictions successfully guide experimental research or lead to misinterpretation. This technical guide examines the fundamental differences, practical implementations, and strategic application of these methods to resolve common discrepancies in electronic structure analysis.
Theoretical Foundations and Methodological Differences
Gaussian Smearing Methods
Gaussian smearing methods approximate the Dirac delta function in the DOS calculation with a continuous Gaussian distribution. The mathematical formulation applies a Gaussian function with a predetermined width parameter (σ) to each energy eigenvalue obtained from k-point sampling:
where D(ε) is the density of states at energy ε, ε_n,k is the eigenvalue for band n at k-point k, and σ is the smearing width parameter [68]. This approach effectively replaces the discrete energy levels with smooth distributions, facilitating numerical convergence in metallic systems by eliminating discontinuities in occupancy functions.
The smearing width parameter σ critically controls a trade-off: larger values ensure smoother DOS and easier convergence of self-consistent field calculations but artificially broaden sharp features. Smaller values preserve features but introduce numerical noise and convergence difficulties. For metals, typical σ values range from 0.1 to 0.2 eV, while smaller values may be used for semiconductors [69]. Different smearing variants have been developed, including Fermi-Dirac smearing (common for metals), Methfessel-Paxton smearing (which corrects order-by-order for electronic free energy), and cold smearing (which minimizes occupation errors).
Tetrahedron Method
The tetrahedron method, particularly the linear tetrahedron method with Blöchl corrections, employs a geometric approach to Brillouin zone integration [70]. The methodology follows a structured process:
- Brillouin Zone Discretization: The first Brillouin zone is divided into a mesh of small tetrahedra, with k-points serving as vertices.
- Energy Interpolation: Within each tetrahedron, energy eigenvalues are linearly interpolated from the values at the four vertices.
- Analytical Integration: The DOS contribution from each tetrahedron is computed analytically based on the interpolated band energies.
- Blöchl Corrections: This refinement applies weight corrections to account for the curvature of energy bands, significantly improving accuracy, particularly for coarse k-point meshes [70].
This approach directly addresses the fundamental limitation of smearing methods by respecting the inherent piecewise continuity of electronic band energies across the Brillouin zone. The tetrahedron method excels at capturing sharp features like Van Hove singularities and band edges because it doesn't artificially broaden the underlying electronic structure [71] [70].
Table 1: Fundamental Comparison of Core Methodologies
| Aspect | Gaussian Smearing | Tetrahedron Method |
|---|---|---|
| Mathematical Basis | Continuous broadening function | Linear interpolation + analytical integration |
| Key Control Parameter | Smearing width (σ) | k-point mesh density |
| Treatment of Singularities | Artificial broadening | Intrinsic preservation |
| Numerical Stability | High (especially with large σ) | Moderate (depends on mesh quality) |
| Computational Cost | Lower for initial convergence | Higher for equivalent k-mesh |
Comparative Analysis: Accuracy and Performance
Resolution of Sharp Electronic Features
The most significant practical difference between these methods lies in their ability to resolve sharp features in the DOS. Smearing methods inherently obscure key electronic features because their broadening function artificially distributes discrete states over an energy range. As demonstrated in studies of the half-Heusler compound TiNiSn, Gaussian smearing obscures Van Hove singularities and can blur band gap boundaries, even with increasingly dense k-point meshes [71] [70]. The smearing width must be carefully selected—excessively large values obliterate fine structure, while excessively small values introduce unphysical noise [70].
In contrast, the tetrahedron method preserves these critical features. Research shows it correctly renders Van Hove peaks and clean band gaps even with relatively coarse k-point sampling [70]. This fidelity is particularly crucial for identifying electronic instabilities and superconducting tendencies, which often depend on sharp DOS features near the Fermi level [72]. For thermopower calculations, where accurate derivatives of the DOS at the Fermi level are essential, the linear tetrahedron method provides superior fidelity with fewer k-points than Gaussian smearing approaches [68].
Convergence Behavior and Computational Efficiency
A critical finding from recent comparative studies is that smearing methods can exhibit misleading convergence behavior. As k-point density increases, the DOS from smearing methods may appear to converge smoothly, but not necessarily to the physically correct result [71] [70]. This false convergence occurs because the artificial broadening persists regardless of k-point density, potentially leading researchers to accept inaccurate DOS profiles.
The tetrahedron method converges more reliably toward the true DOS with increasing k-point density, as it systematically reduces interpolation error without introducing extrinsic broadening [70]. Computationally, Gaussian smearing typically requires fewer k-points for initial SCF convergence, making it advantageous for preliminary structural relaxations [69]. However, for final DOS calculations, the tetrahedron method often achieves satisfactory accuracy with coarser k-point grids than smearing methods would require for comparable quality [68].
Table 2: Practical Performance Comparison in Different Materials Systems
| Material System | Gaussian Smearing Performance | Tetrahedron Method Performance |
|---|---|---|
| Simple Metals | Generally adequate with proper σ | Excellent, but potentially overqualified |
| Semiconductors | Tendency to underestimate band gaps | Superior band gap resolution [70] |
| Systems with Van Hove Singularities | Artificial broadening of peaks [71] | Precise singularity resolution [71] [70] |
| Thermoelectric Materials | Poor for thermopower calculations [68] | Excellent for thermopower [68] |
| Superconductors with Sharp DOS | Risk of underestimating Tc [72] | Accurate DOS at Fermi level [72] |
Practical Implementation and Protocols
Selection Guidelines and Parameter Strategy
Choosing between these methods requires careful consideration of the material system and research objectives:
- For metals with relatively flat DOS near the Fermi level: Gaussian smearing (particularly Methfessel-Paxton or Fermi-Dirac) with σ = 0.1–0.2 eV provides an efficient approach for geometry optimization and initial DOS calculations [69].
- For semiconductors, insulators, and materials with sharp DOS features: The tetrahedron method with Blöchl corrections should be preferred for final property calculations [70].
- For high-throughput screening: A balanced protocol might use Marzari-Vanderbilt cold smearing with σ = 0.27 eV and moderate k-point density for initial screening, followed by tetrahedron method refinement for promising candidates [69].
- For properties sensitive to DOS derivatives (e.g., thermopower, superconducting Tc): The tetrahedron method is strongly recommended [72] [68].
A robust workflow often employs Gaussian smearing for initial structural relaxation (benefiting from better convergence) followed by a single-point calculation with the tetrahedron method for accurate DOS and electronic property analysis. This hybrid approach balances computational efficiency with physical accuracy.
Research Reagent Solutions: Computational Tools
Table 3: Essential Computational Tools for Brillouin Zone Integration
| Tool/Parameter | Function/Role | Implementation Examples |
|---|---|---|
| K-point Mesh | Discrete sampling of Brillouin zone | Monkhorst-Pack grids [73] |
| Smearing Width (σ) | Controls broadening extent in smearing methods | 0.1–0.2 eV for metals; 0.01–0.05 eV for semiconductors [69] |
| Tetrahedron Meshing | Divides Brillouin zone for interpolation | Automatic tetrahedron generation in VASP, Quantum ESPRESSO |
| Blöchl Corrections | Improves accuracy for coarse k-meshes | ISMEAR = -5 in VASP [73] [70] |
| Hybrid Functional Refinement | Further improves band gap accuracy | HSE06 for final validation [74] |
Implementation in Major DFT Codes
VASP Implementation:
- Gaussian smearing:
ISMEAR = 0(Methfessel-Paxton),ISMEAR = 1(Fermi-Dirac),SIGMA = [value in eV] - Tetrahedron method with Blöchl corrections:
ISMEAR = -5[73] [70] - Multiple k-point parallelization recommended for tetrahedron method
Quantum ESPRESSO Implementation:
- Gaussian smearing:
smearing = 'gaussian'or'mp',degauss = [value in Ry] - Tetrahedron method:
occupations = 'tetrahedra' - Adaptive smearing strategies can be implemented for specific systems
The choice between the tetrahedron method and Gaussian smearing is not merely a technical nuance but a fundamental decision that significantly impacts the physical validity of computed electronic properties. While smearing methods offer computational advantages for initial structure optimization and metallic systems with smooth DOS, the tetrahedron method provides superior accuracy for resolving sharp features, band gaps, and properties dependent on DOS derivatives. The recurring discrepancy between band structure interpretations and DOS analyses in research literature often traces back to the artificial broadening inherent in smearing methods.
As computational materials science increasingly focuses on complex systems with subtle electronic features—including topological materials, superconductors with sharp DOS peaks, and heterostructures with confined states—the tetrahedron method offers the precision necessary for reliable prediction. Future methodological developments will likely combine the strengths of both approaches through adaptive smearing techniques and machine-learning-accelerated integration schemes. By understanding these fundamental integration methods and their appropriate application, researchers can significantly enhance the predictive power of their electronic structure calculations and bridge the gap between computational prediction and experimental observation.
Validation Protocols and Cross-Method Verification
Benchmarking Against Experimental Data and Established Databases
In computational materials science, a persistent challenge confronts researchers: the apparent inconsistency between band structure and Density of States (DOS) calculations. The band structure depicts electronic energy levels (E) as a function of the electron wave vector (k), revealing momentum-dependent phenomena, while the DOS represents the number of available electronic states per unit energy interval, integrating over all k-points in the Brillouin zone [1]. This fundamental difference in information representation means these analyses retain and omit different aspects of the electronic structure, leading to potential discrepancies in interpretation that can significantly impact predictions of material properties.
The band structure excels at revealing k-space specifics, including direct versus indirect band gaps, carrier effective masses derived from band curvature, and the precise locations of valence band maxima (VBM) and conduction band minima (CBM) [1]. Conversely, the DOS provides a compressed view of the electronic structure, preserving information about band gaps and state density but losing momentum resolution [1]. When these two analyses appear contradictory—such as when a band structure indicates a semiconductor while the DOS suggests metallic behavior—researchers must employ rigorous benchmarking strategies to validate their computational methodologies against experimental data and established databases [4] [75].
Fundamental Origins of Discrepancies
Methodological Differences in Calculation and Interpretation
The divergence between band structure and DOS primarily stems from their fundamentally different approaches to sampling the Brillouin zone. Band structure calculations typically follow high-symmetry paths, providing detailed momentum-dependent information along specific directions, while DOS calculations require dense sampling across the entire Brillouin zone to accurately capture the distribution of electronic states [3]. Inadequate k-point sampling in DOS calculations can artificially smear critical features, making band gaps appear smaller or even nonexistent compared to band structure analysis [4] [3].
Another significant source of discrepancy arises from the misinterpretation of direct versus fundamental band gaps. A band structure plot might clearly show a direct gap at a specific high-symmetry point (such as the M point), while the global fundamental gap—reflected in the DOS—could be indirect and located between different k-points (such as between the A and Z points) [4]. In such cases, both analyses may be technically correct but highlight different aspects of the electronic structure, emphasizing the necessity of careful interpretation within the appropriate crystallographic context.
Technical Considerations in Computational Setup
Computational parameters play a crucial role in reconciling band structure and DOS results. The smearing value applied during DOS calculations deserves particular attention, as excessively large smearing can artificially fill the band gap, making semiconductors appear metallic [4]. For magnetic systems, additional complexity arises from the need to compute separate spin channels, as neglecting spin polarization can obscure gap features visible in spin-resolved band structures [4].
The choice of eigenvalue generation method further influences results. While exact diagonalization provides the most accurate eigenvalues at each k-point, the tetrahedron method often produces superior DOS spectra for well-converged k-point grids, especially for systems with complex Fermi surface topology [76]. For certain materials like graphene, achieving convergence may require exceptionally dense k-point sampling (200×200 or 300×300) specifically for DOS calculations, far beyond what is typically sufficient for self-consistent field convergence [3].
Table 1: Common Technical Causes of Band Structure-DOS Mismatch and Resolution Strategies
| Cause of Mismatch | Underlying Issue | Recommended Solution |
|---|---|---|
| Insufficient k-point sampling [3] | Sparse sampling misses critical points where band extrema occur | Use significantly denser k-grid for DOS than for SCF convergence |
| Large smearing values [4] | Artificial broadening fills the band gap | Reduce smearing width; use tetrahedron method where possible |
| Unaccounted magnetic order [4] | Missing spin polarization in DOS calculation | Calculate separate spin channels for magnetic materials |
| Incorrect k-path selection [3] | Band structure path misses the actual band gap location | Ensure k-path includes all high-symmetry points where extrema may occur |
| Different fundamental vs. direct gaps [4] | Direct gap visible in band structure vs. smaller indirect gap in DOS | Identify both direct and indirect gaps through full Brillouin zone analysis |
Benchmarking Methodologies and Experimental Validation
Computational Protocols for Electronic Structure Validation
Robust benchmarking begins with standardized computational protocols. For ground-state geometry optimization, second-order Møller-Plesset perturbation theory (MP2) with correlation-consistent basis sets (e.g., cc-pVTZ) provides reliable starting structures, with frequency calculations verifying true energy minima [77]. For periodic systems, density functional theory (DFT) with carefully selected exchange-correlation functionals and Hubbard U corrections (DFT+U) effectively describes localized states in transition metal compounds [75].
The selection of excited-state methods must align with system-specific requirements. For molecules exhibiting dark transitions (those with near-zero oscillator strengths), such as carbonyl-containing compounds, coupled-cluster methods (CC3, EOM-CCSD) serve as theoretical best estimates, while linear-response time-dependent DFT (LR-TDDFT) and algebraic diagrammatic construction (ADC) approaches offer more computationally efficient alternatives [77]. For solid-state systems, hybrid functionals (e.g., HSE06) or GW approximations significantly improve band gap predictions compared to standard local or semi-local functionals.
Diagram 1: Computational benchmarking workflow for electronic structure validation. The process iterates until computational results align with experimental data.
Experimental Validation Techniques
Experimental techniques provide essential validation for computational electronic structure predictions. X-ray photoelectron spectroscopy (XPS) measures core-level binding energies and valence band spectra, enabling direct comparison with calculated DOS [75] [78]. For ionic liquids, XPS validation has demonstrated that even computationally economical methods (B3LYP-D3(BJ)/6-311+G(d,p) with SMD solvation model) can accurately reproduce experimental DOS when properly benchmarked [78].
Ultraviolet photoelectron spectroscopy (UPS) determines crucial parameters including ionization potentials and work functions, referenced to the vacuum level [75]. In studies of MPS₃ (M = Mn, Fe, Co, Ni) van der Waals crystals, UPS measurements revealed ionization potentials ranging from 5.4 eV (FePS₃) to 6.2 eV (NiPS₃), providing absolute energy references for band alignment in heterostructure design [75].
Optical absorption spectroscopy directly probes band gaps by measuring photon energy absorption thresholds. For MPS₃ systems, absorption spectra differentiate between charge-transfer transitions (metal to ligand) and d-d transitions (within metal centers), enabling validation of projected DOS contributions from specific elements and orbitals [75]. Temperature-dependent absorption measurements further reveal excitonic effects and electron-phonon coupling strengths not captured in standard DFT calculations.
Table 2: Experimental Techniques for Electronic Structure Benchmarking
| Technique | Measurable Parameters | Comparable Calculation | Key Insights |
|---|---|---|---|
| XPS [75] [78] | Core-level binding energies, valence band structure | Total DOS, projected DOS | Element-specific electronic environments, valence band maxima |
| UPS [75] | Ionization potential, work function, VBM position | Work function, VBM relative to vacuum | Absolute band positions, band alignment capability |
| Optical Absorption [75] | Band gap, transition energies, excitonic features | Band structure, joint DOS | Direct vs. indirect gaps, transition symmetry, exciton binding |
| Photoemission Spectroscopy | Band dispersion, Fermi surface | Band structure along high-symmetry directions | Quasiparticle dispersion, k-space resolved electronic structure |
The Scientist's Toolkit: Essential Research Reagents and Computational Solutions
Table 3: Essential Computational and Experimental Resources for Electronic Structure Benchmarking
| Resource Category | Specific Tools/Methods | Function in Benchmarking |
|---|---|---|
| Electronic Structure Codes | VASP [79], Quantum ESPRESSO [4], Quantum ATK [76] | Perform first-principles DFT, hybrid functional, GW calculations for band structure and DOS |
| Wavefunction Analysis Tools | B3LYP-D3(BJ)/6-311+G(d,p) [78], MP2/cc-pVTZ [77], CC3/aug-cc-pVTZ [77] | Provide accurate reference data for molecular systems and benchmark density functionals |
| Spectroscopy Instruments | XPS [75] [78], UPS [75], Optical Absorption Spectrometer [75] | Experimental validation of calculated electronic structure and DOS |
| Benchmark Databases | Thiel's set [77], QUEST [77], Gordon's set [77] | Curated datasets of excitation energies and properties for method validation |
| Post-Processing Methods | Tetrahedron method [76] [3], Gaussian smearing [76], k·p expansion [76] | Improve DOS calculation accuracy and interpret computational results |
Case Studies in Systematic Benchmarking
III-V Semiconductor Quantum Wells
A comprehensive comparison of band-structure methods for III-V semiconductor quantum wells exemplifies rigorous benchmarking. This study evaluated DFT, tight-binding, k·p, and non-parabolic effective mass models against experimental measurements for InAs, GaAs, and InGaAs systems [80]. Parameter sets for non-parabolic Γ, L, and X valleys and intervalley bandgaps were extracted from bulk calculations, then applied to quantum wells with thicknesses ranging from 3 nm to 10 nm [80]. The resulting band gap dependence on film thickness demonstrated that method performance varies significantly with system dimensionality, emphasizing the need for multi-scale benchmarking approaches.
The impact of band-structure methodology on device performance predictions was quantified through ballistic transport simulations of nanoscale MOSFETs [80]. These simulations revealed how different band-structure approximations propagate through device modeling, highlighting the critical importance of accurate electronic structure methods for predicting technological relevant metrics like drain current. This cascading effect of computational uncertainty underscores why benchmarking against experimental data remains essential for predictive materials design.
Cerium Dioxide (CeO₂) for Catalytic Applications
DFT calculations of CeO₂ using the VASP software package demonstrate a systematic approach to DOS validation [79]. Through structural optimization, self-consistent electronic calculations, and non-self-consistent calculations, this study obtained a band gap of approximately 2.403 eV, with the valence band maximum primarily contributed by O 2p orbitals and the conduction band minimum dominated by Ce 4f orbitals [79]. The resulting total DOS and partial DOS analyses confirmed the significant roles of Ce 4f and O 2p states in electronic conduction and optical properties, providing theoretical support for catalytic applications [79].
Two-Dimensional Magnetic Materials (MPS₃)
Recent research on MPS₃ (M = Mn, Fe, Co, Ni) van der Waals crystals exemplifies the integration of computational and experimental benchmarking for complex materials [75]. DFT+U calculations successfully distinguished localized d states from hybridized p-d states, enabling interpretation of unusual absorption spectra containing both charge-transfer and symmetry-forbidden d-d transitions [75]. The resulting band diagrams provided insights for designing functional heterostructures, with the MnPS₃/NiPS₃ heterostructure exhibiting optimal band alignment for efficient water splitting across a broad pH range [75].
This study further demonstrated how selective occupation of unoccupied 3d states provides a pathway to tune magnetic order, highlighting the dual electronic and magnetic functionality that can be optimized through accurate band structure engineering [75]. The successful correlation between calculated DOS features and experimental spectra validates the computational approach while providing fundamental insight into the origin of technological relevant properties.
Advanced Protocols for Specific Material Classes
Magnetic and Strongly Correlated Systems
For materials containing localized d or f electrons, standard DFT approximations typically fail to reproduce experimental band gaps and magnetic properties. The DFT+U approach introduces a Hubbard U parameter to better describe electron correlation, significantly improving the description of MPS₃ systems [75]. For more quantitative predictions, hybrid functionals (e.g., HSE06) or many-body perturbation theory (GW approximation) provide superior band gaps at increased computational cost. The Heyd-Scuseria-Ernzerhof (HSE) functional has demonstrated particular success for predicting band gaps in transition metal compounds.
Benchmarking magnetic systems requires additional validation beyond band gaps, including magnetic moments, exchange coupling parameters, and Curie/Neel temperatures. For the MPS₃ series, the competition between direct M-M exchange and indirect M-S-M super-exchange interactions dictates magnetic ordering, necessitating computational methods that accurately capture both electronic structure and magnetic interactions [75].
Molecular Systems and Dark Transitions
For molecular systems, particularly those exhibiting dark transitions (symmetry-forbidden excitations with near-zero oscillator strengths), benchmarking requires special considerations [77]. The oscillator strengths for such transitions (e.g., n→π* in carbonyl compounds) are highly sensitive to nuclear geometry, requiring validation beyond the Franck-Condon point [77]. The CC3 method with augmented basis sets (e.g., aug-cc-pVTZ) serves as a theoretical best estimate, while EOM-CCSD, ADC(2), and XMS-CASPT2 provide more computationally efficient alternatives with varying accuracy trade-offs [77].
For predicting photochemical observables such as photoabsorption cross-sections and photolysis half-lives, benchmarking must include nuclear ensemble approaches that account for non-Condon effects—the variation in transition dipole moments with molecular geometry [77]. This comprehensive validation ensures predictive accuracy for applications in atmospheric chemistry and photovoltaics where dark transitions play crucial roles.
Comparative Analysis Across Multiple Computational Approaches
This technical guide examines the persistent challenge of inconsistent results between electronic band structure and density of states (DOS) calculations in computational materials science. Through systematic comparison of density functional theory (DFT) approximations, many-body perturbation theory, and emerging machine learning approaches, we identify the fundamental theoretical origins of these discrepancies and provide validated protocols for their resolution. Our analysis demonstrates that method selection, computational parameters, and interpretation frameworks significantly impact the consistency between these complementary electronic structure representations, with important implications for predictive materials design in electronic and optoelectronic applications.
Electronic band structure and density of states represent two fundamental yet complementary representations of a material's electronic properties. Band structure depicts the relationship between electron energy and crystal momentum (wavevector k) throughout the Brillouin zone, while DOS quantifies the number of available electronic states per unit volume at each energy level, effectively integrating over all k-points [1] [25]. This fundamental difference in representation often leads to apparent inconsistencies that puzzle researchers, particularly those new to computational materials science.
A classic example of this inconsistency appears in DFT studies of CuCoSnSe, where band structure calculations indicate semiconducting behavior with a direct bandgap, while the corresponding DOS fails to show the expected bandgap [4]. Such discrepancies arise from multiple factors including: k-space sampling limitations where insufficient k-points in DOS calculations fail to capture critical band edges; methodological differences between band structure and DOS computational protocols; interpretation errors in distinguishing between direct and indirect bandgaps; and computational parameter mismatches such as different smearing values or basis sets [4] [1].
Understanding and resolving these inconsistencies is crucial for accurate materials prediction, particularly in semiconductor physics, catalyst design, and optoelectronic applications where electronic structure properties directly determine functional performance.
Theoretical Foundations: Relationship Between Band Structure and DOS
Fundamental Definitions and Physical Origins
The electronic band structure of a solid describes the allowed energy levels that electrons may occupy, typically plotted as energy E versus wavevector k along high-symmetry directions in the Brillouin zone. In crystalline materials, these energy bands form due to the hybridization of atomic orbitals when atoms are brought together to form a solid [25] [81]. As isolated atoms approach each other, their discrete atomic energy levels split into N closely-spaced levels (where N is the number of atoms), forming continuous energy bands separated by forbidden gaps where no electronic states can exist [25].
The density of states function g(E) is mathematically defined as the number of electronic states per unit volume per unit energy:
[ g(E) = \frac{1}{V}\sum{n}\int{BZ}\frac{d\mathbf{k}}{(2\pi)^3}\delta(E - E_n(\mathbf{k})) ]
where V is the volume, n is the band index, and the integral is over the Brillouin zone [25]. Conceptually, DOS represents a "projection" of the band structure onto the energy axis, where regions of high DOS correspond to energy ranges with many band states, while band gaps manifest as regions of zero DOS [1].
Information Content Comparison
Table 1: Information Content in Band Structure versus Density of States
| Aspect | Band Structure | Density of States |
|---|---|---|
| k-space resolution | Full momentum dependence along symmetry lines | Integrated over all k-points |
| Bandgap characterization | Distinguishes direct vs. indirect gaps | Shows presence but not nature of gap |
| Carrier effective mass | Obtainable from band curvature | Not directly accessible |
| Fermi surface topology | Directly visualized via constant-energy contours | Only inferred indirectly |
| Computational cost | Typically requires calculation along specific k-path | Requires dense 3D k-point sampling |
As illustrated in Table 1, band structure retains momentum-resolved information critical for understanding carrier transport properties and direct/indirect bandgap character, while DOS provides a compact representation useful for quantifying state availability at specific energies and understanding integration-dependent properties like optical absorption spectra [1].
Figure 1: Relationship between band structure and DOS calculations from common theoretical origins to property interpretation.
Methodological Approaches and Computational Frameworks
Density Functional Theory Approximations
DFT represents the workhorse method for electronic structure calculations, with various exchange-correlation functionals offering different trade-offs between accuracy and computational cost. The Perdew-Burke-Ernzerhof (PBE) generalized gradient approximation (GGA) remains widely used for structural optimization but systematically underestimates band gaps due to its inherent self-interaction error [16] [82] [35]. Hybrid functionals like HSE06 incorporate exact Hartree-Fock exchange to partially address this limitation, providing improved bandgap accuracy at increased computational cost [82] [35]. Meta-GGA functionals such as the modified Becke-Johnson (mBJ) potential offer a intermediate approach, delivering improved band gaps without the computational overhead of hybrid functionals [83] [35].
Table 2: Comparison of DFT Approximations for Band Structure and DOS Calculations
| Functional | Bandgap Accuracy | DOS Quality | Computational Cost | Typical Applications |
|---|---|---|---|---|
| LDA | Severe underestimation (30-50%) | Poor for band edges | Low | Metallic systems, preliminary studies |
| GGA-PBE | Underestimation (20-40%) | Moderate | Low to moderate | Structural optimization, metals |
| mBJ | Moderate (10-20% error) | Good for semiconductors | Moderate | Electronic structure, optoelectronics |
| HSE06 | Good (5-15% error) | Very good | High | Accurate bandgaps, defect studies |
| GW | Excellent (≈5% error) | Excellent | Very high | Benchmark calculations |
The systematic bandgap underestimation problem in standard DFT approximations constitutes a major source of band structure-DOS inconsistency. As demonstrated in recent benchmarks covering 472 non-magnetic materials, GGAs typically underestimate experimental band gaps by 40-50%, while meta-GGAs and hybrids reduce this error to 10-30% [35]. This underestimation manifests differently in band structure versus DOS representations, often creating apparent contradictions when comparing calculated results with experimental measurements.
Many-Body Perturbation Theory (GW Approximation)
The GW approximation within many-body perturbation theory represents the gold standard for quasiparticle band structure calculations, substantially improving upon DFT bandgaps by explicitly accounting for electron self-energy effects [35]. Different GW flavors offer varying trade-offs: one-shot G₀W₀ calculations using plasmon-pole approximations provide marginal improvements over the best DFT functionals, while full-frequency quasiparticle self-consistent GW (QSGW) with vertex corrections delivers exceptional accuracy, potentially even flagging questionable experimental measurements [35].
Recent systematic benchmarking reveals that QSGW calculations typically overestimate experimental band gaps by approximately 15%, while QSGW with vertex corrections (QSGŴ) essentially eliminates this systematic error [35]. The computational cost hierarchy ranges from ~5-10× DFT for G₀W₀ to 50-100× DFT for QSGW with vertex corrections, making these methods prohibitive for high-throughput screening but invaluable for benchmark-quality calculations.
Emerging Machine Learning Approaches
Machine learning models represent a paradigm shift in electronic structure prediction, offering DFT-level accuracy at significantly reduced computational cost. Recent advances include universal models like PET-MAD-DOS, which employs a rotationally unconstrained transformer architecture trained on diverse materials datasets to predict DOS directly from atomic structures [5]. These models demonstrate semi-quantitative agreement with DFT calculations while scaling linearly with system size versus the poorer scaling of ab initio methods [5].
ML approaches are particularly valuable for finite-temperature molecular dynamics simulations, where they enable efficient evaluation of ensemble-averaged DOS and electronic heat capacity across diverse systems including lithium thiophosphate (LPS), gallium arsenide (GaAs), and high-entropy alloys [5]. Transfer learning strategies further enhance their utility by enabling fine-tuning with small system-specific datasets, achieving accuracy comparable to bespoke models trained exclusively on target materials [5].
Experimental Protocols and Computational Methodologies
DFT Workflow for Consistent Band Structure and DOS
Structural Optimization Protocol:
- Employ GGA-PBE functional for initial geometry relaxation [82] [83]
- Use energy convergence criterion of 0.0001 Ry/bohr or tighter [16]
- Apply van der Waals corrections (DFT-D3) for weakly bonded systems [16] [82]
- Ensure full relaxation of atomic positions and lattice parameters
Electronic Structure Calculation:
- Utilize hybrid functionals (HSE06) or meta-GGA (mBJ) for improved bandgaps [82] [83] [35]
- Employ consistent k-point grids: 16×16×1 for 2D materials, denser for 3D systems [16]
- Implement spin-orbit coupling for heavy elements [82] [83]
- Use same pseudopotential/basis set for both band structure and DOS calculations
Band Structure Specifics:
- Calculate eigenvalues along high-symmetry lines (Γ-M-K-Γ typical for hexagonal systems) [16]
- Include sufficient k-points along each path (typically 10-30 points between high-symmetry points) [81]
DOS Calculation Parameters:
- Use tetrahedron method with Blöchl corrections for accurate DOS integration [1]
- Employ significantly denser k-point grid than for structural optimization (e.g., 24×24×1 for 2D materials) [16]
- Apply appropriate Gaussian smearing (0.02-0.11 eV FWHM) to balance resolution and broadening [84]
- Calculate projected DOS (PDOS) to identify orbital contributions to specific features [1] [83]
Figure 2: Computational workflow for consistent band structure and DOS calculations.
Table 3: Essential Software and Computational Resources for Electronic Structure Calculations
| Tool | Function | Key Features | Typical Use Cases |
|---|---|---|---|
| Quantum ESPRESSO | Plane-wave DFT | Pseudopotentials, GGA/hybrid functionals | Band structure, DOS, structural optimization [4] [84] |
| VASP | Plane-wave DFT with PAW | Advanced functionals, MD capabilities | Surface adsorption, defects, DOS [84] |
| WIEN2k | Full-potential LAPW | All-electron, high accuracy | Optical properties, accurate DOS [16] [83] |
| Yambo | Many-body perturbation theory | GW, BSE calculations | Quasiparticle band structure, optical spectra [84] [35] |
| CASTEP | Plane-wave DFT | Materials Studio integration | Electronic structure, optical properties [82] |
Case Studies and Comparative Analysis
2D Material Heterostructures: MoSi₂N₄/BP Systems
Recent investigations of MoSi₂N₄/BP van der Waals heterostructures demonstrate the critical importance of consistent computational approaches. In these systems, isolated MoSi₂N₄ exhibits an indirect bandgap of 1.85 eV (PBE), while BP has a direct gap of 0.89 eV [16]. When combined in heterostructures, proper treatment of van der Waals interactions using DFT-D3 methods reveals direct bandgaps at the K-point, with corresponding DOS showing clear bandgaps only when using appropriate k-point sampling and smearing parameters [16].
The BP/MoSi₂N₄/BP trilayer heterostructure demonstrates particularly high stability and consistent semiconducting behavior in both band structure and DOS calculations when employing HSE06 functionals with dense k-point meshes (16×16×1) [16]. This consistency enables accurate prediction of enhanced optical absorption in the visible spectrum, making these materials promising for photocatalysis and solar energy applications.
Doped Systems: Ta/Sb-doped Nb₃O₇(OH)
Band structure engineering through doping presents particular challenges for band structure-DOS consistency. In Ta/Sb-doped Nb₃O₇(OH), doping reduces the bandgap from 1.7 eV (pristine) to 1.266 eV (Ta-doped) and 1.203 eV (Sb-doped) [83]. While band structures suggest direct gap behavior in all cases, DOS calculations must employ the Tran-Blaha modified Becke-Johnson (TB-mBJ) approximation to properly resolve these gaps, as standard PBE calculations incorrectly suggest metallic character [83].
Partial DOS (PDOS) analysis reveals that O-p and Nb-d orbitals dominate the valence and conduction bands respectively, with dopant states creating subtle features that require high k-point density for proper sampling [83]. This case highlights how method selection dramatically impacts the consistency between band structure and DOS in complex doped systems.
Resolution Strategies for Band Structure-DOS Inconsistencies
Technical Verification Protocols
k-point Convergence Testing:
- Systematically increase k-point density until bandgap and DOS features stabilize
- Use progressively denser grids: 8×8×1 → 16×16×1 → 24×24×1 for 2D materials
- Confirm consistency between bandgap extracted from band structure and DOS
Methodological Consistency Checks:
- Employ identical exchange-correlation functionals for both calculations
- Use same pseudopotentials and basis sets
- Ensure consistent treatment of spin-orbit coupling and relativistic effects
Smearing Parameter Optimization:
- Test multiple smearing values (0.02, 0.05, 0.11 eV) to identify optimal balance
- Use tetrahedron method for final production calculations when possible
- Verify that smearing doesn't artificially fill bandgaps in DOS
Interpretation Guidelines
Direct vs. Indirect Bandgap Distinction:
- Band structure identifies direct/indirect character through k-space location of band edges
- DOS alone cannot distinguish between direct and indirect bandgaps
- Always verify bandgap type using band structure when making optoelectronic predictions
Orbital Contribution Analysis:
- Use projected DOS (PDOS) to identify atomic orbital contributions to specific bands
- Correlate high-symmetry k-points in band structure with PDOS features
- Identify hybridization effects through simultaneous analysis of multiple orbital projections
Bandgap Extraction Methods:
- Extract bandgap from band structure by identifying VBM and CBM across all k-points
- Confirm DOS shows minimum at same energy as bandgap
- Use hybrid functionals or GW corrections for quantitative bandgap accuracy
The consistent interpretation of band structure and density of states calculations remains a critical challenge in computational materials science. Our systematic analysis demonstrates that methodological consistency, appropriate computational parameters, and careful interpretation strategies are essential for reconciling apparent discrepancies between these complementary electronic structure representations.
Future developments in multi-fidelity machine learning approaches, which combine inexpensive DFT calculations with selective high-accuracy GW benchmarks, show particular promise for addressing these challenges [5] [35]. Similarly, the increasing availability of standardized computational datasets and benchmarks enables more systematic identification and correction of methodological inconsistencies [35].
As computational materials science continues to evolve toward high-throughput screening and materials discovery, the principles outlined in this work will become increasingly important for ensuring reliable prediction of electronic properties across diverse materials classes. By adopting the protocols and verification strategies presented here, researchers can significantly enhance the consistency and reliability of their electronic structure calculations, accelerating the development of novel materials for electronic, optoelectronic, and energy applications.
Identifying Red Flags in Material Project Data
In high-throughput computational materials science, the Materials Project (MP) database is an invaluable resource, yet researchers often encounter a critical red flag: discrepancies between the calculated band structure and density of states (DOS), particularly in the value of the band gap. Such inconsistencies can derail research in areas like semiconductor design, photocatalysis, and battery development. This guide details the origins of these discrepancies, provides methodologies for their identification and resolution, and equips researchers with the tools to critically assess and validate electronic structure data.
Density functional theory (DFT) is the workhorse behind the electronic structure data in the Materials Project. However, DFT is fundamentally a ground-state theory, and the interpretation of its Kohn-Sham eigenvalues as electronic excitation energies lacks a rigorous theoretical basis for all but the highest occupied state [85]. This inherent limitation, combined with specific computational protocols, is a primary source of the observed mismatches.
A common and significant red flag is a material listed with a 0 eV band gap when it is expected to be a semiconductor or insulator. This can stem from genuine DFT limitations (e.g., the well-known band gap underestimation), but it can also be a parsing artifact from database updates or errors in band edge detection [85]. Understanding how to distinguish between these causes is essential for the reliable use of the data.
Methodological Origins of Data Discrepancies
The electronic structure data on the Materials Project is not derived from a single, monolithic calculation. Instead, it is generated through a series of specialized calculations, and the differences between these methods are a key source of inconsistency.
The process begins with a static self-consistent field (SCF) calculation on a uniformly relaxed structure to obtain the charge density. This is followed by two separate non-self-consistent field (NSCF) calculations [85]:
- A Uniform NSCF Calculation: Uses a dense grid of k-points (e.g., a Monkhorst-Pack grid) to calculate the Density of States (DOS).
- A Line-mode NSCF Calculation: Calculates energies along high-symmetry lines in the Brillouin zone to generate the Band Structure.
A critical point is that the uniform k-point grid used for the DOS might not include the specific k-point where the conduction band minimum (CBM) or valence band maximum (VBM) occurs, which is explicitly located by the line-mode band structure calculation. This fundamental difference in k-space sampling can naturally lead to different reported band gaps [85].
The Band Gap Hierarchy
The Materials Project employs a specific hierarchy to select the band gap value displayed for a material on its website. This hierarchy is [85]:
Density of States > Line-mode Band Structure > Static (SCF) > Optimization
This means the band gap from the DOS calculation is given precedence. If the DOS calculation results in a metallic state (zero gap), the band gap from the line-mode band structure will not be used as a fallback on the main material page, potentially leading to a reported 0 eV gap even if the band structure suggests otherwise.
A Scientist's Toolkit: Protocols for Data Validation
When a discrepancy is suspected, researchers can employ the following protocols to validate the data using the MP API and the pymatgen library.
Essential Research Reagent Solutions
Table 1: Key Computational Tools for Electronic Structure Validation.
| Tool / Resource | Function | Access |
|---|---|---|
| MPRester API | Programmatic interface to retrieve calculation data, task IDs, DOS, and band structure objects. | Materials Project API key |
| Pymatgen Library | Python library for materials analysis; contains classes and methods to manipulate and analyze DOS and band structure objects. | pip install pymatgen |
| Task ID | A unique identifier for a specific calculation in the MP database. Essential for retrieving raw electronic structure data. | Found via MPRester |
| DOS Object | Contains the density of states data. Used to recompute the fundamental band gap. | Retrieved via MPRester |
| BandStructure Object | Contains the electronic band structure data along high-symmetry lines. | Retrieved via MPRester |
Experimental Protocol 1: Recomputing the Band Gap from DOS
The most robust method to verify a band gap is to recompute it directly from the DOS data, as this is often more reliable than the parsed value [85].
Code Example:
Experimental Protocol 2: Validating the Band Structure
In some cases, the band structure object may have an incorrect Fermi level. This protocol allows for the reconstruction of a corrected band structure using the more reliable VBM from the DOS [85].
Code Example:
Workflow for Diagnosing Red Flags
The following diagram outlines a systematic workflow for diagnosing and resolving common electronic structure data discrepancies, integrating the tools and protocols described above.
The Impact of Database Updates
The Materials Project database is periodically updated, which can change the reported properties of materials. A significant update in late 2024 changed how band gaps are parsed and stored, leading to updates for many materials [85]. Furthermore, a specific issue in version v2024.11.14 incorrectly assigned the task_type for thousands of calculations, labeling "NSCF Line" tasks as "NSCF Uniform" [86]. This misassignment directly affected the derived properties in the materials summary, including band gaps and DOS. Although this was corrected in a subsequent release, researchers analyzing data during that period or comparing with older results may encounter inconsistencies stemming from these updates.
Table 2: Selected Materials Project Database Updates Affecting Electronic Structure Data.
| Version | Release Date | Key Changes Relevant to Electronic Structure |
|---|---|---|
| v2025.02.12 | Feb 2025 | Improved consistency of magnetic ordering assignment for electronic structure data [86]. |
| v2024.12.18 | Dec 2024 | Added r2SCAN calculations; modified valid material definition to include materials with only r2SCAN data [86]. |
| v2024.11.14 | Dec 2024 | Corrected 21,144 tasks mis-assigned as "NSCF Uniform" to "NSCF Line". Corrected associated band gaps and DOS for affected materials [86]. |
| v2022.10.28 | Oct 2022 | Incorporated (R2)SCAN calculations as pre-release data, offering an alternative to standard GGA(+U) data [86]. |
Discussion: Limitations and Best Practices
The systematic underestimation of band gaps by standard GGA (PBE) functionals is a well-known limitation of DFT, with errors typically around 40-50% [85]. Therefore, a red flag is not necessarily that a band gap is underestimated, but that it is qualitatively incorrect (e.g., an insulator predicted to be metallic) or inconsistent with other data in the database.
Best practices for researchers include:
- Always Check the DOS: Treat the recomputed DOS band gap as the most reliable value for the fundamental gap [85].
- Be Version-Aware: Note that material properties can change between database versions. Document which MP database version was used for your analysis.
- Understand the Hierarchy: Know that the displayed band gap comes from the DOS calculation by default. A material with a 0 eV DOS gap will show as metallic, even if its band structure suggests a gap.
- Contextualize Your Findings: Compare your MP data with other databases or dedicated high-accuracy calculations (e.g., GW, hybrid functionals) where possible, especially for critical results.
Environmental and Defect-Driven Variability in Electronic Properties
In the computational design and characterization of functional materials, electronic structure descriptors—namely, the band structure and the density of states (DOS)—are foundational. They are routinely employed to predict a vast range of physical properties, from mechanical strength and electrical conductivity to catalytic activity. However, a significant and often overlooked challenge in materials research is the frequent mismatch between these first-principles calculations and experimental observations. This whitepaper posits that a primary source of this discrepancy lies in the idealized nature of computational models, which often neglect the profound influence of environmental conditions and defect populations on the electronic landscape of a material.
Real-world materials are not perfect crystals existing in a vacuum. Their operational environments, such as exposure to oxygen or moisture, and their inherent structural imperfections, like vacancies and dislocations, can drastically alter their electronic properties. This document provides an in-depth technical examination of how these factors induce variability, presenting recent case studies, detailed experimental protocols, and visual guides to bridge the gap between theoretical prediction and experimental reality.
Defect-Induced Electronic Variability
Crystalline defects are not merely anomalies; they are fundamental features that can be engineered to tailor material properties. Their impact on electronic structure is multifaceted, affecting charge distribution, local potentials, and electronic states within the band gap.
Point Defects and Vacancies
Point defects, such as atomic vacancies and substitutions, introduce localized changes that can perturb a material's electronic environment.
- Chalcogen Vacancies and Substitutions in TMDs: In monolayer and bulk WS₂ and WSe₂, the substitution of sulfur (S) or selenium (Se) with oxygen (O) or a hydroxyl group (OH) creates distinct defect states. Table 1 summarizes the binding energies and band gap changes associated with these substitutions. Although the fundamental band gap may show minimal variation, the introduction of defect states within the gap significantly influences carrier mobility and transport properties. The analysis of partial density of states (PDOS) and effective band structures (EBS) is crucial for revealing these often-overlooked localized states [87].
- Vacancies in Metallic Systems: In face-centered cubic aluminum, the precise location of a single-vacancy defect measurably impacts the material's electronic structure. First-principles calculations demonstrate that face-centered vacancies tend to reduce mechanical strength and perturb electronic states near the Fermi level, as observed through changes in the DOS. In contrast, corner and edge vacancies have a weaker effect. This position-dependent influence is further modulated by thermomechanical coupling, where elevated temperatures can partially restore electronic uniformity through thermal excitation [88].
Table 1: Electronic Properties of Pristine and Defect-Engineered TMDs
| Material System | Defect Type | Binding Energy (eV) | Band Gap (Pristine) | Band Gap (With Defect) | Key Electronic Change |
|---|---|---|---|---|---|
| WS₂ Monolayer [87] | O substitution at S site | ~ -2.5 (approx. from fig) | ~1.94 eV (DFT) | ~1.92 eV (DFT) | Creation of defect states influencing carrier transport |
| WSe₂ Monolayer [87] | OH substitution at Se site | ~ -1.5 (approx. from fig) | ~1.74 eV (DFT) | ~1.72 eV (DFT) | Creation of defect states influencing carrier transport |
| Al Crystal (FCC) [88] | Face-centered vacancy | N/A | Metallic | Metallic | Perturbation of DOS near Fermi level; reduced mechanical strength |
Extended Defects and Correlated States
One-dimensional (1D) and two-dimensional (2D) extended defects can host entirely new electronic phenomena not present in the pristine host material.
- One-Dimensional Defects in TMDs: Mirror twin boundaries (MTBs) and chalcogen vacancy lines in monolayers of WS₂ can exhibit metallic behavior, forming 1D metals (1DMs) within a semiconducting sheet. Remarkably, when these 1DMs are coupled with a graphene substrate, a strongly correlated electron state known as a Tomonaga-Luttinger liquid (TLL) can form. The graphene substrate plays a critical role by donating ~3–8 electrons per 1DM, shifting the Fermi level and reducing screening, thereby enhancing electron-electron interactions within the 1D channel. This system exhibits the hallmark of a TLL: a power-law suppression of the density of states at the Fermi energy [89].
- Engineered Dislocations in Perovskites: A novel method using focused ion-beam (FIB) patterning on SrTiO₃ substrates enables the nucleation of ultra-high densities of threading dislocations and Ruddlesden-Popper (RP) faults in epitaxially grown BaSnO₃ and SrSnO₃ films with nanoscale location specificity. These extended defects are associated with local strain and compositional variations, which create special electronic states in the band structure of the host film. For instance, dislocation cores in similar perovskite oxides have been shown to introduce localized conductive channels, a property absent in the perfect crystal structure [90].
The diagram below illustrates how different types of defects and environmental factors lead to distinct electronic outcomes, providing a logical framework for understanding the sources of variability.
Environmental and Substrate-Driven Effects
The external environment and supporting substrate are not passive bystanders but active participants in defining a material's electronic character.
Susceptibility to Oxidation
Two-dimensional materials, due to their high surface-to-volume ratio, are particularly sensitive to environmental molecules like O₂ and H₂O.
- Oxidation of WS₂ and WSe₂: DFT calculations show that WS₂ and WSe₂, in both monolayer and bulk forms, are susceptible to oxidation. Oxygen or hydroxyl groups can readily incorporate into the crystal lattice through chalcogen site substitution. While the fundamental band gap remains relatively stable, the binding energy calculations and molecular dynamics simulations confirm that these oxidative species can be incorporated effectively, forming stable defect configurations that influence electronic transport [87]. This process underscores the importance of considering environmental exposure when measuring and applying such materials.
Substrate-Induced Charge Transfer
The substrate can act as a reservoir of charge, doping the material it supports and modifying its electronic interactions.
- Graphene as a Charge Donor for TLL Formation: As highlighted in Section 2.2, the role of graphene in the formation of a TLL in WS₂ 1DMs is critical. Nano-ARPES and STM/STS measurements correlate the local density of states with electronic band dispersion, directly elucidating the electron transfer from graphene into the 1D defect. This charge transfer is essential for establishing the strongly correlated electronic state. In contrast, 1DMs on metallic substrates like gold are over-screened, and those on insulating substrates lack sufficient free carriers, preventing TLL formation in both cases [89].
Case Study: Layered Perovskite Oxides
Complex layered perovskites provide a striking example of how intrinsic chemical composition and structural ordering lead to highly anisotropic electronic properties, which can be misinterpreted without detailed analysis.
The GdBa₂Ca₂Fe₅O₁₃ (GBCFO) oxide, a candidate for solid oxide fuel cell electrodes, features a layered structure with three distinct coordination polyhedra for Fe³⁺ ions: octahedra (FeO₆), square pyramids (FeO₅), and tetrahedra (FeO₄). DFT+U calculations reveal that this specific ordering directly dictates its anisotropic electronic structure. The calculations show that the FeO₅ layers constitute the conduction band (CB), the FeO₆ layers form the valence band (VB), and the FeO₄ layers create insulating channels. This results in highly anisotropic electrical and magnetic properties, consistent with experimental observations of 2D conduction [74]. This case demonstrates how bulk calculations that average over these distinct local environments would fail to capture the true direction-dependent electronic nature of the material.
Table 2: Electronic Structure Probes and Key Findings in Featured Studies
| Material System | Primary Computational Method | Key Experimental Probe(s) | Critical Finding Relevant to Variability |
|---|---|---|---|
| BCC Refractory Alloys [91] | Density Functional Theory (DFT) | Elastic constant measurement | N(Ef) is a better descriptor of strength/ductility than valence electron concentration. |
| WS₂/Graphene Heterostructure [89] | DFT, Molecular Dynamics | nARPES, STM/STS, ncAFM | Substrate (graphene) charge transfer is essential for TLL formation in 1D defects. |
| BaSnO₃ / SrSnO₃ Thin Films [90] | N/A (Growth-focused) | STEM, HAADF-STEM, EDX, XRD | FIB patterning enables location-specific defect engineering, creating localized electronic states. |
| GdBa₂Ca₂Fe₅O₁₃ Oxide [74] | DFT+U (Hubbard correction) | Electrical & magnetic property measurement | Layered Fe-coordination polyhedra cause highly anisotropic (2D) electronic band structure. |
Experimental and Computational Protocols
To systematically investigate and validate the impact of defects and environment, robust and detailed methodologies are required. The following protocols are derived from the cited cutting-edge research.
This protocol details the process for inducing 1D defects and characterizing their electronic structure.
- Sample Preparation: Grow monolayer WS₂ epitaxially on a graphene/SiC substrate using chemical vapor deposition (CVD).
- Defect Engineering:
- Perform in-situ low-energy Ar⁺ sputtering (e.g., 100-500 eV) at elevated temperatures (e.g., 600°C) to create chalcogen vacancies.
- Follow with a post-sputtering anneal at ~600°C to facilitate the migration and aggregation of point defects into extended 1D metal (1DM) structures like vacancy lines and mirror twin boundaries.
- Structural Characterization:
- Use non-contact Atomic Force Microscopy (ncAFM) with a CO-functionalized tip to resolve the atomic structure of the created 1DMs.
- Employ Scanning Tunneling Microscopy (STM) for topographical imaging.
- Electronic Structure Characterization:
- Perform Scanning Tunneling Spectroscopy (STS) to map the local density of states (LDOS) across the defects. Look for signatures of a TLL, such as a power-law suppression of density at the Fermi level.
- Use nano-Angle Resolved Photoemission Spectroscopy (nARPES) to directly visualize the electronic band dispersion of the 1DMs and the surrounding substrate, correlating with STS findings.
This protocol outlines the computational approach to study the effect of point defects.
- Software and Functional:
- Use the Vienna Ab Initio Simulation Package (VASP).
- Employ the Perdew-Burke-Ernzerhof (GGA-PBE) exchange-correlation functional.
- Include van der Waals corrections (e.g., DFT-D3) for layered structures.
- Model Setup:
- Construct a supercell of the material (e.g., 4x4 or 5x5 for monolayers).
- Introduce defects: create a chalcogen vacancy or perform substitutional doping with O or OH at a chalcogen site.
- Calculation Parameters:
- Set a plane-wave cutoff energy of 400 eV.
- Use a Γ-centered k-point mesh for Brillouin zone sampling (e.g., 3x3x1).
- Relax all atomic positions and the cell shape until forces are below 0.01 eV/Å.
- Analysis:
- Binding Energy: Calculate using ( Eb = E{sys}^{tot} - E{perfect}^{tot} - n\mux + n\muy ), where ( E{sys}^{tot} ) and ( E{perfect}^{tot} ) are the total energies of the defective and pristine systems, ( \mux ) and ( \mu_y ) are the chemical potentials of the removed and added species.
- Electronic Structure: Compute the density of states (DOS), partial DOS (PDOS), and the electronic band structure. Analyze for defect-induced states within the band gap.
- Use visualization software (e.g., VESTA) to examine differential charge density to understand charge redistribution.
The workflow below outlines the key stages of a combined computational and experimental investigation into defect-driven electronic properties.
The Scientist's Toolkit: Essential Research Reagents and Materials
Table 3: Key Reagents and Materials for Defect-Driven Electronic Studies
| Item Name | Function / Role in Research | Specific Example / Application |
|---|---|---|
| Graphene/SiC Substrate | Provides an ideal, weakly interacting yet electronically active substrate for 2D material growth and defect studies. | Enables charge transfer for TLL formation in 1D defects of WS₂ [89]. |
| Focused Ion-Beam (FIB) | Used for nanoscale patterning on substrate surfaces to nucleate extended defects in epitaxial films with location specificity. | Creating trenches/ridges on SrTiO₃ to seed dislocations in BaSnO₃ [90]. |
| CO-functionalized AFM Tip | Enhances resolution in non-contact AFM, allowing for precise imaging of atomic structures and defect configurations. | Resolving the atomic structure of chalcogen vacancy lines and MTBs in WS₂ [89]. |
| Hybrid Molecular Beam Epitaxy | A thin-film growth technique for high-purity, epitaxial oxide films with precise stoichiometric control. | Growth of BaSnO₃ and SrSnO₃ films on patterned SrTiO₃ substrates [90]. |
| Hubbard U Correction (DFT+U) | A computational parameter in DFT calculations that improves the treatment of strongly correlated electrons (e.g., in d and f orbitals). | Accurately modeling the electronic structure and band gap of Fe³⁺ in GdBa₂Ca₂Fe₅O₁₃ [74]. |
| Ar⁺ Ion Source | Used for in-situ sputtering in ultra-high vacuum systems to create point defects in 2D materials in a controlled manner. | Generating sulfur vacancies in WS₂ as precursors for 1D defect formation [89]. |
The divergence between theoretical band structure/DOS predictions and experimental results is not a failure of the models, but rather a consequence of their inherent simplifications. As this whitepaper has demonstrated, environmental exposure and defect populations are dominant factors that inject significant variability into the electronic properties of functional materials. The case studies—ranging from oxidized TMDs and substrate-coupled 1D correlated systems to engineered dislocations in perovskites and anisotropic layered oxides—provide compelling evidence that accurate material design must move beyond pristine, idealized crystals.
Future research must embrace a holistic approach that integrates advanced computational methods, such as DFT+U for handling strong correlations, with sophisticated experimental techniques capable of probing structure and electronics at the atomic scale. By systematically accounting for these sources of variability, researchers can bridge the gap between computation and experiment, leading to more reliable predictions and the rational design of next-generation materials for electronics, energy, and quantum technologies.
Best Practices for Reporting and Validating Computational Results
In computational materials science, a recurring challenge that signals the need for rigorous validation is the apparent inconsistency between different electronic structure calculations, such as a mismatch between a material's band structure and its Density of States (DOS). Such discrepancies are not mere artifacts; they often reveal deeper methodological issues, approximations in computational methods, or shortcomings in reporting. These inconsistencies form a critical context for understanding why comprehensive validation and transparent reporting are not just best practices but fundamental requirements for scientific integrity.
The Transparency and Openness Promotion (TOP) Guidelines, a recognized policy framework for advancing open science, emphasize that the verifiability of research claims hinges on practices that allow for independent confirmation of results [92]. This guide synthesizes modern validation protocols, data presentation standards, and reporting frameworks to empower researchers to produce computational results that are reliable, reproducible, and trustworthy.
Foundational Concepts: Understanding Common Discrepancies
A classic example of a problem requiring systematic validation is the mismatch between a band structure plot that shows a semiconductor with a distinct band gap and a DOS plot that suggests metallic behavior. Several physical and technical factors can cause this, and understanding them is the first step in validation.
- k-Point Sampling Differences: The band structure is typically calculated along a high-symmetry path in the Brillouin zone, while the DOS involves a full integration over the entire zone. If the k-point mesh used for the DOS is too coarse, it may fail to capture the precise gaps visible in the band structure, leading to an incorrect smearing of the gap [4] [3].
- Incorrect Fermi Level Alignment: A fundamental check is to verify that the Fermi level (E_F) is consistently set to zero in both the band structure and DOS plots. An inadvertent shift can make a gap appear in one plot but not the other [4].
- Methodological and Physical Causes: Underlying approximations in the computational method itself, such as those in standard Density Functional Theory (DFT), can lead to inaccuracies. Furthermore, the calculations might have converged to different magnetic states, or the band structure path might simply not pass through the point in the Brillouin zone where the fundamental (minimum) gap is located [4] [3].
A Framework for Validation and Transparency
Adhering to a structured framework for conducting and reporting computational research significantly enhances its verifiability. The following workflow outlines the key stages for ensuring validated and transparent results.
Preregistration and Protocol Definition
Before beginning calculations, define and document the experimental protocol. This includes the research question, the chosen computational method, and the planned analysis, which helps counter selective reporting [92].
Performing the Calculation
Execute the planned calculations, meticulously recording all parameters and software versions used. Automation of workflows is highly recommended to ensure consistency and reproducibility [35].
Internal Validation
This critical phase involves self-checks to ensure internal consistency. This includes verifying the convergence of key parameters, checking for consistency between related outputs like band structure and DOS, and confirming the physical plausibility of results [4] [3].
Reporting and Sharing
Disseminate the findings in a manner that includes not just the final results but also the data, code, and detailed methodologies that underpin them. This aligns with TOP Guidelines on Data and Code Transparency [92].
Independent Verification
The ultimate test of verifiability is when a party independent from the original researchers can reproduce the reported results using the shared data and computational procedures [92].
Experimental Protocols for Electronic Structure Validation
Protocol for Converging k-Point Sampling
Aim: To determine the k-point mesh density required for energy and property convergence.
- Start with a coarse k-point mesh (e.g., 4x4x4).
- Perform a self-consistent field (SCF) calculation and record the total energy.
- Increase the k-point density systematically (e.g., to 6x6x6, 8x8x8, etc.), repeating the SCF calculation each time.
- Plot the total energy versus the inverse of the k-point mesh density.
- Select the mesh where the total energy change between successive calculations is less than a predefined threshold (e.g., 1 meV/atom). For subsequent DOS calculations, it is often necessary to use a much denser mesh than the minimum required for SCF convergence. Some benchmarks recommend meshes as dense as 200x200 or 300x300 for 2D materials to achieve a high-quality DOS [3].
Protocol for Resolving Band Structure vs. DOS Discrepancies
Aim: To diagnose and resolve a mismatch between the band gap observed in the band structure and the DOS.
- Verify Fermi Level: Confirm the Fermi level is set to zero and is consistent in both plots [4].
- Check Magnetic Order: For magnetic systems, confirm the consistency of the magnetic moment and electronic structure between different calculations [4].
- Increase k-Points for DOS: Recalculate the DOS using a significantly denser k-point mesh to rule out sampling insufficiency as the cause [3].
- Inspect Band Path: Ensure the band structure path passes through the points in the Brillouin zone where the valence band maximum (VBM) and conduction band minimum (CBM) are located. The DOS reflects the global band gap, while the band structure shows the gap only along the plotted path [4].
- Validate with Advanced Methods: If the discrepancy persists, consider validating the result with a higher-level of theory, such as hybrid functionals (e.g., HSE06) or many-body perturbation theory (e.g., GW approximation), which are known to provide more accurate band gaps [35].
Quantitative Data Presentation
Structured presentation of numerical results and parameters is essential for clarity and comparison. The following tables summarize key performance data and methodological choices.
Table 1: Benchmarking of Electronic Structure Methods for Band Gap Prediction (eV). This table compares the performance of various computational methods, highlighting the systematic improvement offered by advanced many-body perturbation theory (GW) over standard DFT functionals. Data adapted from a systematic 2025 benchmark [35].
| Method | Theory Class | Mean Absolute Error (MAE) | Systematic Error Trend | Relative Computational Cost |
|---|---|---|---|---|
| LDA | DFT | ~0.7 eV (typical) | Severe underestimation | Low |
| PBE | DFT | ~0.5 eV (typical) | Significant underestimation | Low |
| HSE06 | Hybrid DFT | ~0.3 eV | Slight underestimation | Medium-High |
| mBJ | meta-GGA DFT | ~0.3 eV | Slight underestimation | Medium |
| G0W0 (PPA) | GW | ~0.3 eV | Varies with starting point | High |
| G0W0 (Full-Frequency) | GW | ~0.2 eV | Varies with starting point | Very High |
| QSGW | GW | ~0.2 eV | Systematic overestimation (~15%) | Very High |
| QSGW^ | GW with vertex corrections | < 0.2 eV | Excellent agreement | Extremely High |
Table 2: Essential Parameters for Reporting Electronic Structure Calculations. Documenting these parameters is crucial for reproducibility and validation.
| Category | Parameter | Description & Example |
|---|---|---|
| Core Methodology | DFT Functional | Exchange-correlation functional (e.g., PBE, HSE06, mBJ) [35] |
| Pseudopotential | Type and source (e.g., NC-PP, PAW, from PSLibrary) | |
| Basis Set | Type and cutoff (e.g., Plane-wave, 80 Ry) | |
| Convergence | k-Point Mesh | SCF: 8x8x8; DOS: 24x24x24 [3] |
| Energy Cutoff | Plane-wave kinetic energy cutoff (e.g., 80 Ry) | |
| System-Dependent | Smearing | Smearing type and width (e.g., Gaussian, 0.01 Ry) |
| Hubbard U | DFT+U corrections applied (e.g., U_eff = 4.0 eV for Fe d-orbitals) | |
| Software & Code | Code & Version | Software and version used (e.g., Quantum ESPRESSO 7.1) [4] [35] |
The Scientist's Toolkit: Research Reagent Solutions
In computational science, the "reagents" are the software, pseudopotentials, and numerical tools used to perform experiments.
Table 3: Essential Computational Materials for Electronic Structure Calculations.
| Item | Function | Example Sources / Notes |
|---|---|---|
| DFT Codes | Software to perform the core electronic structure calculation. | Quantum ESPRESSO [4], VASP, ABINIT, Questaal [35] |
| Post-Processing Tools | Utilities for calculating derived properties like DOS and band structure. | Yambo [35], VASPkit, Sumo |
| Pseudopotential Libraries | Curated sets of pseudopotentials that replace core electrons. | PSLibrary, GBRV, Dojo |
| Convergence Tools | Automated scripts to test the convergence of parameters. | AiiDA, phonopy, custom workflows [35] |
| Data & Code Repositories | Trusted repositories for sharing results and methodologies. | Zenodo, NOMAD, Materials Cloud [92] |
Visualization and Accessible Data Presentation
Effective visualization is key to communicating results clearly. Adhering to established design principles ensures that charts are interpretable by all readers, including those with color vision deficiencies.
Color Palette Guidelines for Data Visualization
The relationship between data type and color palette is fundamental.
- Qualitative Palettes: Use for categorical data with no inherent order. Colors should be distinct hues, with a recommended limit of ten for clarity [93] [94].
- Sequential Palettes: Use for ordered numeric data. Colors typically vary in lightness from light (low values) to dark (high values) [93] [95].
- Diverging Palettes: Use for data with a meaningful central value (e.g., zero). They combine two sequential palettes, using a neutral light color for the central value [93] [94].
Best Practices for Visualization
- Avoid Unnecessary Color: Use color sparingly and strategically to highlight key findings. Gray out less important data to direct attention [93].
- Ensure Accessibility: About 4% of the population has color vision deficiency. Avoid red-green and blue-yellow combinations for critical contrasts. Use tools like Coblis or Color Oracle to simulate how your visuals appear to those with color blindness [93] [94].
- Maintain Consistency: Use the same color to represent the same entity or variable across all charts in a report or dashboard [93].
Robust validation and comprehensive reporting are the cornerstones of credible computational science. By understanding the sources of discrepancy, such as those between band structure and DOS, and by implementing structured validation protocols, researchers can confidently produce reliable results. Adopting the practices outlined here—from preregistration and detailed parameter reporting to accessible data visualization and data sharing—ensures that computational research is not only impactful but also transparent, reproducible, and verifiable. This commitment to rigor is what ultimately advances the field and solidifies the role of computation in scientific discovery.
Conclusion
The observed mismatches between band structure and DOS calculations stem from a complex interplay of physical principles, computational methodologies, and material-specific characteristics. Successful resolution requires careful attention to k-point sampling, proper treatment of magnetic states, consistent Fermi level alignment, and understanding of the fundamental relationship between these complementary representations. Future directions should focus on developing standardized validation protocols, improving exchange-correlation functionals for specific material classes, and addressing environment-driven variability in electronic properties, particularly for biomedical applications where accurate electronic structure prediction is crucial for material performance and biocompatibility. Researchers must adopt a systematic approach to computational materials science, recognizing that discrepancies often reveal important physical insights rather than mere calculation errors.
References
- 1. Electronic Structure Analysis: Mastering Density of States ... [https://medium.com/universallab/electronic-structure-analysis-mastering-density-of-states-dos-and-projected-dos-why-its-0a09fa369051]
- 2. Band Structure, Projected Density of States and Effective Mass ... [https://docs.quantumatk.com/intro/intro_tutorials/bandstructure-dos-effective-masses-Si-SiO2/bandstructure-dos-effective-masses.html]
- 3. Mismatch of bandstructure and density of states [https://forum.quantumatk.com/index.php?topic=6366.0]
- 4. inconsistent behavior between band structure and density ... [https://mattermodeling.stackexchange.com/questions/4096/inconsistent-behavior-between-band-structure-and-density-of-states]
- 5. A universal machine learning model for the electronic ... [https://arxiv.org/html/2508.17418v1]
- 6. How to analyse a density of states [https://www.sciencedirect.com/science/article/pii/S277294942200002X]
- 7. Flat-band quantum materials empowering self-adapted ... [https://www.nature.com/articles/s41467-025-63983-1]
- 8. Spin excitations and flat electronic bands in a Cr-based ... [https://www.nature.com/articles/s41467-025-62298-5]
- 9. Flat band surface state superconductivity in thick ... [https://arxiv.org/html/2511.17423v1]
- 10. Indirect-to-direct bandgap transition in GaP ... [https://www.nature.com/articles/s41467-024-52535-8]
- 11. Why does silicon have an indirect band gap? - RSC Publishing [https://pubs.rsc.org/en/content/articlehtml/2025/mh/d4mh01038h]
- 12. Why I have difference between DOS and BAND gap? [https://mattermodeling.stackexchange.com/questions/9083/why-i-have-difference-between-dos-and-band-gap]
- 13. Properties that can be deduced from Band structure and DOS [https://mattermodeling.stackexchange.com/questions/1791/properties-that-can-be-deduced-from-band-structure-and-dos]
- 14. Pressure-induced indirect to direct bandgap transition and ... [https://www.sciencedirect.com/science/article/abs/pii/S0022369725005281]
- 15. How can we engineer electronic transitions through twisting ... [https://pubs.rsc.org/en/content/articlehtml/2025/na/d5na00112a]
- 16. BP bilayer and trilayer vdW heterostructures [https://www.nature.com/articles/s41598-025-07602-5]
- 17. The modulation of electronic properties and mechanism ... [https://www.sciencedirect.com/science/article/abs/pii/S1369800125003348]
- 18. An indirect-to-direct band gap transition of NaSbS2 via ... [https://www.sciencedirect.com/science/article/pii/S1878535222006979]
- 19. Brillouin zone sampling — ASE documentation [https://wiki.fysik.dtu.dk/ase/ase/dft/kpoints.html]
- 20. K-Space — BAND 2025.1 documentation - SCM [https://www.scm.com/doc/BAND/Accuracy_and_Efficiency/K-Space_Integration.html]
- 21. Dimensional band engineering in asymmetrical van der ... [https://arxiv.org/html/2503.17947v2]
- 22. Study on the electronic structure and optical properties of ... [https://link.springer.com/article/10.1140/epjb/s10051-025-00987-2]
- 23. Band structure database of layered intercalation ... [https://www.nature.com/articles/s41597-024-04008-2]
- 24. Predicting neutron experiments from first principles [https://pubs.rsc.org/en/content/articlehtml/2025/ta/d5ta03325j]
- 25. Electronic band structure [https://en.wikipedia.org/wiki/Electronic_band_structure]
- 26. Representing individual electronic states for machine ... [https://pmc.ncbi.nlm.nih.gov/articles/PMC8813923/]
- 27. structure, Band and PDOS — DFTB+ Recipes 20.2 documentation DOS [https://dftbplus-recipes.readthedocs.io/en/stable/basics/bandstruct.html]
- 28. Understanding Density of States in Quantum Mechanics and... [https://etcnmachining.com/blog/density-of-states/]
- 29. Electronic Properties of Parallel-Aligned Arrays of Carbon ... [https://pmc.ncbi.nlm.nih.gov/articles/PMC12430338/]
- 30. Predicting electronic structures at any length scale with ... [https://www.nature.com/articles/s41524-023-01070-z]
- 31. Simple approach to more efficient density functional theory ... [https://www.sciencedirect.com/science/article/abs/pii/S2352214325000115]
- 32. DFT analysis of structural, electronic, optical, and ... [https://www.nature.com/articles/s41598-025-91458-2]
- 33. Edge Band from Alignment Density Functional Theory [https://physicspython.wordpress.com/2020/02/10/band-edge-alignment-from-density-functional-theory/]
- 34. Troubleshooting — BAND 2025.1 documentation - SCM [https://www.scm.com/doc/BAND/Troubleshooting/Trouble_Shooting.html]
- 35. A systematic benchmark for band gaps of solids [https://arxiv.org/html/2508.05247v1]
- 36. Theoretical investigation of the electronic structure and ... [https://www.nature.com/articles/s41598-025-20774-4]
- 37. Machine learning for the development of new materials ... [https://www.nature.com/articles/s44306-025-00094-z]
- 38. Understanding Success Criterion 1.4.3: Contrast (Minimum) [https://www.w3.org/WAI/WCAG21/Understanding/contrast-minimum.html]
- 39. Understanding WCAG 2 Contrast and Color Requirements [https://webaim.org/articles/contrast/]
- 40. Color Contrast Guidelines for Text & UI Accessibility [https://daily.dev/blog/color-contrast-guidelines-for-text-and-ui-accessibility]
- 41. Color Contrast Accessibility: Complete WCAG 2025 Guide ... [https://www.allaccessible.org/blog/color-contrast-accessibility-wcag-guide-2025]
- 42. Best Practices for Accessible Color Contrast in UX [https://developerux.com/2025/07/28/best-practices-for-accessible-color-contrast-in-ux/]
- 43. Category:Exchange-correlation functionals [https://vasp.at/wiki/Category:Exchange-correlation_functionals]
- 44. Exchange-correlation functionals for band gaps of solids [https://www.nature.com/articles/s41524-020-00360-0]
- 45. 7.2 Exchange-correlation functionals and their classification [https://fiveable.me/computational-chemistry/unit-7/exchange-correlation-functionals-classification/study-guide/z1FCBbI22yX4npZU]
- 46. Customizing PBE Exchange-Correlation functionals [https://arxiv.org/html/2311.11702v5]
- 47. The study of electronic structure and absorption coefficient ... [https://www.sciencedirect.com/science/article/abs/pii/S0927025615004371]
- 48. Accurate and scalable exchange-correlation with deep ... [https://www.microsoft.com/en-us/research/publication/accurate-and-scalable-exchange-correlation-with-deep-learning/]
- 49. Density of States (DOS) — BAND 2025.1 documentation - SCM [https://www.scm.com/doc/BAND/Analysis/DOS.html]
- 50. Band structure and density of states for copper and ... [https://sites.psu.edu/dftap/2020/05/09/band-structure-and-density-of-states-for-copper-and-copper-oxide/]
- 51. Tuning the magnetic and electronic properties of MoI 3 ... [https://www.sciencedirect.com/science/article/abs/pii/S0304885322001299]
- 52. Density of states - Wikipedia [https://en.wikipedia.org/wiki/Density_of_states]
- 53. Band Structure Calculations - an overview [https://www.sciencedirect.com/topics/chemistry/band-structure-calculations]
- 54. vasp - Band structure and density of states disagreement (mp-19092) - Matter Modeling Stack Exchange [https://mattermodeling.stackexchange.com/questions/4030/band-structure-and-density-of-states-disagreement-mp-19092]
- 55. Restart the DOS or band structure with BAND - SCM [http://www.scm.com/doc/Tutorials/Analysis/RestartDosBandStructure.html]
- 56. Density of States calculation • Quantum Espresso Tutorial [https://pranabdas.github.io/espresso/hands-on/dos/]
- 57. Systematic Approach To Calculate the Band Gap Energy of ... [https://pmc.ncbi.nlm.nih.gov/articles/PMC6640787/]
- 58. Analysis tools — Siesta Documentation [https://docs.siesta-project.org/projects/siesta/en/5.2/tutorials/basic/analysis-tools/]
- 59. A systematic variational approach to band theory in a quantum ... [https://pubs.rsc.org/en/content/articlehtml/2021/ra/d1ra07451b]
- 60. Descriptors based on the density of states for efficient ... [https://www.sciencedirect.com/science/article/pii/S0927025624007146]
- 61. The Basics of Electronic Structure Theory for Periodic ... [https://pmc.ncbi.nlm.nih.gov/articles/PMC6424870/]
- 62. Engineering the crystal structure and band gap of SrTeO 4 [https://pubs.rsc.org/en/content/articlehtml/2025/dt/d5dt01643f]
- 63. Spin gapless state in ferromagnetic CuMnO2 [https://www.sciencedirect.com/science/article/pii/S092702562500744X?dgcid=rss_sd_all]
- 64. Issues converging with DFT+U and magnetism in Quantum ... [https://mattermodeling.stackexchange.com/questions/9413/issues-converging-with-dftu-and-magnetism-in-quantum-espresso]
- 65. Bands, DOS, and the Fermi surface - SCM [https://www.scm.com/doc/Tutorials/Analysis/BandsDosFermiSurface.html]
- 66. vasp - What is the source of this band structure and DOS ... [https://mattermodeling.stackexchange.com/questions/6603/what-is-the-source-of-this-band-structure-and-dos-inconsistency]
- 67. Band, dos and pdos doesn't match - QuantumATK Forum [https://forum.quantumatk.com/index.php?topic=9593.0]
- 68. Detecting signatures of surface antibonding nodes through ... [https://www.sciencedirect.com/science/article/abs/pii/S0169433224027430]
- 69. Smearing values for different codes [https://mattermodeling.stackexchange.com/questions/6887/smearing-values-for-different-codes]
- 70. Comparison of the Tetrahedron Method to Smearing ... [https://www.bohrium.com/paper-details/comparison-of-the-tetrahedron-method-to-smearing-methods-for-the-electronic-density-of-states/867752687452553249-108483]
- 71. Comparison of the Tetrahedron Method to Smearing ... [https://arxiv.org/abs/2103.03469]
- 72. High-throughput superconducting 𝑇_c predictions through ... [https://arxiv.org/html/2508.18371v1]
- 73. First-principles insights into structure and magnetism in ultra ... [https://pubs.rsc.org/en-us/content/articlehtml/2025/cp/d5cp01415h]
- 74. Highly anisotropic electronic properties of the GdBa 2 Ca ... [https://pubs.rsc.org/en/content/articlehtml/2025/cp/d5cp01780g]
- 75. Experimental and theoretical band alignment study of MPS ... [https://www.nature.com/articles/s41699-025-00578-w]
- 76. DensityOfStates — | QuantumATKX-2025.06 Documentation [https://docs.quantumatk.com/manual/Types/DensityOfStates/DensityOfStates.html]
- 77. Benchmarking electronic-structure methods for the ... [https://arxiv.org/html/2508.04606v1]
- 78. Accurate prediction of ionic liquid density-of-states from low ... [https://pubs.rsc.org/en/content/articlelanding/2025/cp/d5cp00214a]
- 79. Density of States Calculation of CeO$_2$ Based on VASP [https://arxiv.org/abs/2501.10724]
- 80. Comprehensive comparison and experimental validation of ... [https://www.sciencedirect.com/science/article/pii/S0038110115002580]
- 81. Band Structure - an overview | ScienceDirect Topics [https://www.sciencedirect.com/topics/engineering/band-structure]
- 82. Density functional theory studies of electronic and optical ... [https://www.sciencedirect.com/science/article/abs/pii/S0927025625004811]
- 83. Band structure engineering, optical, transport, and ... [https://pubs.rsc.org/en/content/articlehtml/2025/ra/d4ra08019j]
- 84. Density-Functional Theory Calculations [https://bio-protocol.org/exchange/minidetail?id=2990233&type=30]
- 85. Electronic Structure [https://docs.materialsproject.org/methodology/materials-methodology/electronic-structure]
- 86. Database Versions [https://docs.materialsproject.org/changes/database-versions]
- 87. Oxidation and defects in WS2 and WSe2: The first-principle ... [https://www.sciencedirect.com/science/article/abs/pii/S0022369725002276]
- 88. Coupled Effects of Single-Vacancy Defect Positions on the ... [https://www.techscience.com/cmc/online/detail/24761/pdf]
- 89. Graphene-driven correlated electronic states in one ... [https://www.nature.com/articles/s41467-025-60993-x]
- 90. Defect engineering in BaSnO 3 and SrSnO 3 thin films ... [https://www.nature.com/articles/s41467-025-64522-8]
- 91. Electronic density of states as the descriptor of elastic bond ... [https://www.sciencedirect.com/science/article/pii/S0264127525003053]
- 92. TOP Guidelines [https://www.cos.io/initiatives/top-guidelines]
- 93. How to choose colors for data visualizations [https://www.atlassian.com/data/charts/how-to-choose-colors-data-visualization]
- 94. How to Choose Color Palettes for Graph and Data ... [https://mindthegraph.com/blog/how-to-choose-color-palettes-for-graph-and-data-visualization/]
- 95. data visualization color palettes [https://carbondesignsystem.com/data-visualization/color-palettes/]