Optimized Spectrophotometric Determination of Iron via 1,10-Phenanthroline Complexation: A Comprehensive Guide for Biomedical Research
This article provides a comprehensive review of the spectrophotometric determination of iron using the 1,10-phenanthroline complex, a cornerstone method in analytical chemistry.
Optimized Spectrophotometric Determination of Iron via 1,10-Phenanthroline Complexation: A Comprehensive Guide for Biomedical Research
Abstract
This article provides a comprehensive review of the spectrophotometric determination of iron using the 1,10-phenanthroline complex, a cornerstone method in analytical chemistry. Tailored for researchers and drug development professionals, it covers foundational principles of the ferroin complex and the Beer-Lambert law. The scope extends to detailed, optimized methodologies for diverse sample matrices, including sophisticated techniques for overcoming common interferences like oxalate. We critically address troubleshooting for accuracy and precision and present a rigorous validation framework comparing the method against advanced techniques such as ICP-MS and AAS. This guide serves as a vital resource for reliable iron quantification in pharmaceuticals, biological fluids, and environmental samples, supporting quality control and clinical diagnostics.
The Science Behind the Color: Principles of the 1,10-Phenanthroline-Iron Complex
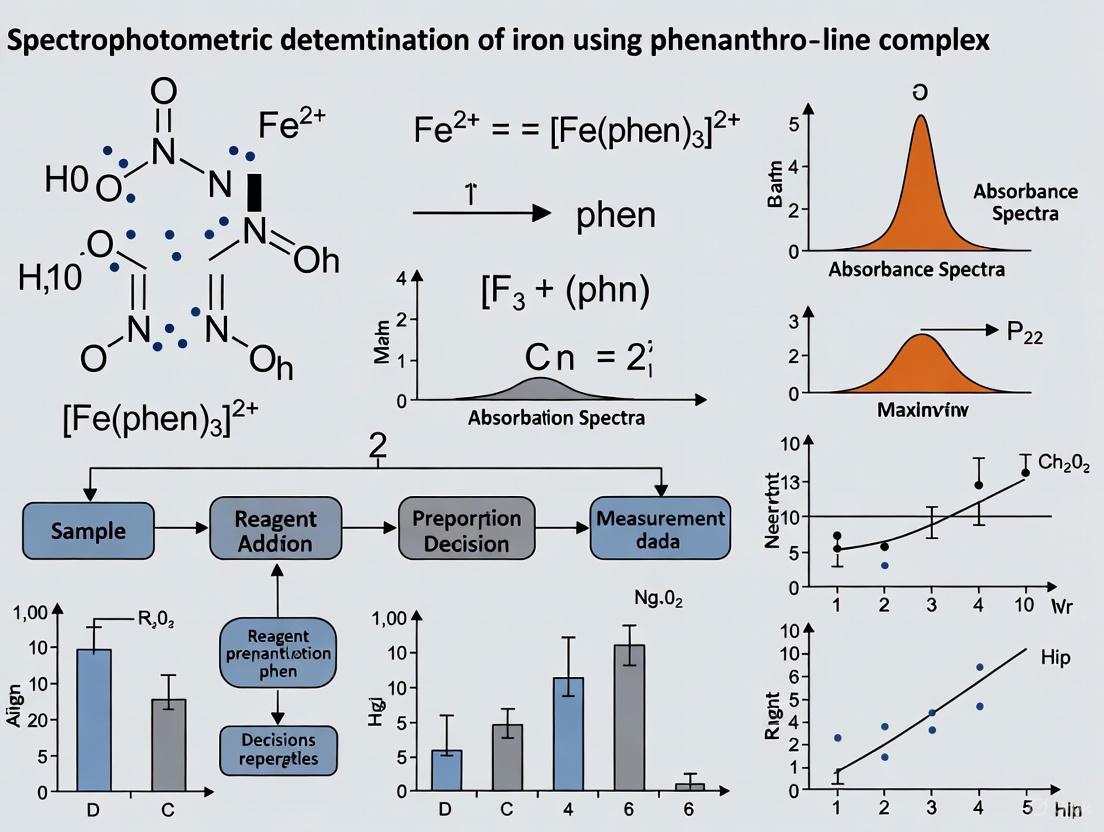
The ferroin complex, known chemically as tris(1,10-phenanthroline)iron(II), serves as a cornerstone in analytical chemistry for the spectrophotometric determination of iron [1]. Its characteristic intense orange-red coloration provides a sensitive, reliable means to quantify iron concentration across diverse fields—from environmental water testing to pharmaceutical development and materials science [2] [3]. The complex's utility stems from a robust and well-defined binding mechanism between the ferrous ion (Fe²⁺) and the 1,10-phenanthroline ligand, resulting in a chromophore with exceptional stability and distinct spectrophotometric properties. This application note details the binding mechanism, outlines standardized protocols, and presents key analytical parameters to equip researchers with the knowledge to leverage this reaction effectively within a broader research context focused on iron speciation and quantification.
Mechanism of Fe²⁺ Binding and Color Development
The development of the orange-red color is a direct consequence of a specific coordination chemistry event: the formation of a stable, octahedral complex between Fe²⁺ and three molecules of 1,10-phenanthroline.
Chemical Binding Mechanism
The process involves a redox reaction and subsequent chelation. In solution, iron is often present in the more stable Fe³⁺ state. The first critical step is its reduction to the ferrous state (Fe²⁺) by a reducing agent such as hydroxylamine hydrochloride [3]. The reaction proceeds as follows:
- Reduction:
Fe^(3+) + NH2OH -> Fe^(2+) + ...[3] - Chelation: Once reduced, each Fe²⁺ ion coordinates with three 1,10-phenanthroline (phen) molecules:
Fe^(2+) + 3 phen -> [Fe(phen)3]^(2+)[1]
The resulting [Fe(phen)3]²⁺ cation is the ferroin complex. Its structure is octahedral, with D3 symmetry, where each bidentate phenanthroline ligand donates two nitrogen atoms to the iron center, creating a very stable chelate ring system [1]. The iron-nitrogen bond distance in this complex is approximately 197.3 pm [1].
Origin of the Orange-Red Color
The intense color of the ferroin complex is a result of its electronic structure. The 1,10-phenanthroline ligand is a π-acceptor. When it coordinates to the Fe²⁺ ion, molecular orbitals are reconfigured, leading to a narrow energy gap between the highest occupied molecular orbital (HOMO) and the lowest unoccupied molecular orbital (LUMO). This complex absorbs light in the blue-green region of the visible spectrum (around 510 nm), and the transmitted complementary light is perceived as orange-red [2] [3]. The high molar absorptivity of this charge-transfer transition is what makes the method so sensitive for quantification.
Table 1: Key Spectrophotometric Properties of the Ferroin Complex
| Parameter | Value | Experimental Conditions | Source |
|---|---|---|---|
| Absorption Maximum (λ_max) | 510 nm | Aqueous solution | [3] |
| Molar Absorptivity | ~1.3 x 10⁴ L/mol·cm | Not specified | [4] |
| Optimal pH Range | 3 - 9 (4 - 7 ideal) | Acetate buffer | [3] |
| Color Stability | Up to 4 days | Light-proof environment | [4] |
| Detection Limit | 2.5 µg/L (0.0025 ppm) | Portable measurement device | [2] |
| Linear Range | 25 - 1000 µg/L | Portable measurement device | [2] |
| Linear Range | 1 - 9 ppm | Standard UV-Vis | [3] |
Figure 1: Mechanism of Ferroin Complex Formation. The pathway illustrates the reduction of Fe³⁺ to Fe²⁺ followed by chelation with 1,10-phenanthroline to form the colored complex.
Detailed Experimental Protocols
Standard Protocol for Iron Determination in Aqueous Solution
This protocol is adapted for determining total iron in water samples and requires a UV-Vis spectrophotometer [3].
Materials & Reagents:
- Hydroxylamine hydrochloride solution (10% m/v)
- Sodium acetate buffer (to maintain pH 3-9)
- 1,10-Phenanthroline solution (0.5% m/v)
- Volumetric flasks, pipettes
Procedure:
- Sample Preparation: Transfer a known volume of water sample containing 1-9 ppm of iron into a 100 mL volumetric flask.
- Reduction of Fe³⁺: Add 1 mL of 10% hydroxylamine hydrochloride solution and swirl to mix. This ensures all iron is in the Fe²⁺ state [3].
- pH Buffering: Add 10 mL of sodium acetate buffer to maintain the pH between 4 and 7, which is optimal for complex formation and prevents iron hydrolysis [3].
- Complex Formation: Add 5 mL of 0.5% 1,10-phenanthroline solution and swirl to mix.
- Dilution and Incubation: Dilute to the 100 mL mark with deionized water and allow the solution to stand for 10-15 minutes for full color development.
- Spectrophotometric Measurement: Measure the absorbance of the solution at 510 nm against a reagent blank. Determine the iron concentration from a pre-established calibration curve.
Protocol for Complex Matrices: Overcoming Oxalate Interference
In sequential mineral extraction from sediments, oxalate is a common extractant that interferes by competing with phenanthroline for iron complexation. This protocol addresses that challenge [4].
Procedure:
- Sample Extraction: Obtain an iron-containing sample extracted using an oxalate solution.
- pH Adjustment: To overcome the competitive complexation by oxalate, adjust the pH of the extracted solution to a range of 7–9 using sodium hydroxide (NaOH) or concentrated ammonia [4]. This pH adjustment is critical for successful color development in the presence of oxalate.
- Follow Standard Protocol: Continue with the standard protocol steps (reduction, buffering, complex formation, and measurement) as described in section 3.1. The color stability is maintained for up to 4 days if kept in a light-proof environment [4].
Protocol for Iron Catalyst Content in Carbon Nanotubes (CNTs)
This method is validated for quantifying residual iron catalyst in CNTs using acid digestion to free the encapsulated iron [3].
Procedure:
- Acid Digestion: Reflux approximately 0.1 g of CNTs in a 3:1 (v/v) mixture of H₂SO₄/HNO₃ or HClO₄/HNO₃ to completely extract the iron. The graphitic layers encasing the catalyst particles require strong oxidative acids for dissolution [3].
- Solution Preparation: Cool and filter the digestate. Transfer a known aliquot to a volumetric flask.
- Follow Standard Protocol: Dilute the aliquot as necessary and follow the standard protocol for iron determination (section 3.1). The measured concentration is calculated back to the original CNT mass using the formula:
[Fe] (wt.%) = [Fe]_measured (ppm) × Dilution Factor × Final Volume (L) / m_CNT (g) × 10⁻⁴[3].
Figure 2: Experimental Workflow for Iron Determination. The flowchart outlines the specific steps for different sample types, highlighting the critical pH adjustment for oxalate-containing samples.
The Scientist's Toolkit: Essential Research Reagents & Materials
Table 2: Key Research Reagent Solutions for Ferroin-based Iron Determination
| Reagent/Material | Function & Role in the Assay | Specifications & Notes |
|---|---|---|
| 1,10-Phenanthroline | Chelating agent: Forms the orange-red [Fe(phen)₃]²⁺ complex. The key chromophore. | ≥99.0% purity (AR Grade). Iron content ≤0.001%. White to pale yellow crystalline powder [5]. |
| Hydroxylamine Hydrochloride (NH₂OH·HCl) | Reducing agent: Converts Fe³⁺ to Fe²⁺, ensuring all iron is in the reactive ferrous state [3]. | Typically used as a 10% (m/v) aqueous solution. |
| Sodium Acetate (CH₃COONa) | Buffering agent: Maintains solution pH in the optimal 4-7 range for stable complex formation [3]. | Prevents hydrolysis of iron and ensures maximum color intensity. |
| Ammonia (NH₃) / Sodium Hydroxide (NaOH) | pH adjustment: Critical for analyzing samples containing interfering complexing agents like oxalate [4]. | Used to raise pH to 7-9 to overcome competition from oxalate. |
| Portable Spectrophotometer | Detection: Measures absorbance of the complex at 510 nm for quantification in field applications [2]. | Can be a custom device with LED (510 nm) and photodiode. Enables sub-ppm detection. |
Applications and Concluding Remarks
The robustness of the ferroin complex reaction facilitates its use in diverse scenarios. It is the basis for standard methods for iron determination in water [2], and with the protocol modifications discussed, it can be applied to environmental monitoring of iron minerals in sediments [4]. The method also extends to materials science, providing a low-cost alternative to ICP-OES for quantifying metal impurities in advanced materials like carbon nanotubes [3].
In conclusion, the binding of Fe²⁺ by 1,10-phenanthroline to form the ferroin complex is a classic, yet highly adaptable, spectrophotometric method. Its mechanism is well-understood, and its protocols can be modified to suit various sample matrices. The provided detailed protocols, key parameters, and workflow are designed to ensure that researchers and drug development professionals can reliably apply this technique to their specific iron quantification needs.
The Beer-Lambert Law (also known as Beer's Law) is a fundamental principle in optical spectroscopy that describes the linear relationship between the absorbance of light and the properties of the material through which the light is traveling [6]. This empirical relationship serves as a critical tool for quantitative chemical analysis, enabling researchers to determine the concentration of solutes in solution by measuring light absorption [7]. In the context of iron quantification, this law provides the theoretical foundation for spectrophotometric determination using complexing agents such as 1,10-phenanthroline, allowing for precise, reproducible measurements essential to pharmaceutical and environmental research [8].
The law mathematically expresses that the attenuation of monochromatic light as it passes through a sample solution is directly proportional to the concentration of the absorbing species and the path length the light travels through the material [9]. The modern formulation of this relationship is represented by the equation:
A = εlc
Where:
- A is the measured absorbance (dimensionless)
- ε is the molar absorptivity or molar extinction coefficient (L·mol⁻¹·cm⁻¹)
- l is the optical path length through the sample (cm)
- c is the concentration of the absorbing species (mol/L) [9] [7]
Theoretical Principles
Fundamental Concepts of Light Absorption
When light passes through a solution containing absorbing species, a portion of the incident light is absorbed, leading to attenuation of the transmitted light beam. The key concepts for understanding this phenomenon include:
- Transmittance (T): Defined as the ratio of the transmitted light intensity (I) to the incident light intensity (I₀), often expressed as a percentage: %T = (I/I₀) × 100% [6]
- Absorbance (A): Defined as the base-10 logarithm of the reciprocal of transmittance: A = log₁₀(I₀/I) [6] [9]
- Molar Absorptivity (ε): A substance-specific constant that indicates how strongly a chemical species absorbs light at a particular wavelength [9]
The following table illustrates the inverse logarithmic relationship between absorbance and transmittance:
Table 1: Absorbance and Transmittance Relationship
| Absorbance | Transmittance |
|---|---|
| 0 | 100% |
| 0.3 | 50% |
| 1 | 10% |
| 2 | 1% |
| 3 | 0.1% |
Data adapted from Edinst resource on Beer-Lambert Law [6]
Mathematical Formulations and Limitations
The Beer-Lambert law derives from differential calculus, assuming that the decrease in light intensity (dI) through an infinitesimally thin layer of solution is proportional to the incident intensity (I), the concentration of the absorber (c), and the thickness of the layer (dx). This leads to the exponential attenuation relationship formally expressed as:
I = I₀e^(-μl) or in logarithmic form: A = log₁₀(I₀/I) = εlc [10]
Despite its widespread utility, the Beer-Lambert law has several important limitations that researchers must consider:
- Concentration Limitations: At high concentrations (>0.01M), the linear relationship between absorbance and concentration may deviate due to molecular interactions, electrostatic effects, or changes in refractive index [7] [11]
- Chemical Deviations: Apparent non-linearity can occur due to association, dissociation, or complexation equilibria of the absorbing species [11]
- Instrumental Deviations: Stray light, polychromatic radiation, and detector non-linearity can cause measurement inaccuracies, particularly at high absorbance values [7] [11]
- Optical Effects: Scattering, fluorescence, or optical saturation can invalidate the fundamental assumptions of the law [11]
The following diagram illustrates the fundamental relationship between light attenuation and solution properties described by the Beer-Lambert Law:
Spectrophotometric Determination of Iron
Iron-Phenanthroline Complex Formation
The spectrophotometric determination of iron using 1,10-phenanthroline represents a classic application of the Beer-Lambert Law in analytical chemistry. This method relies on the formation of a stable, intensely colored complex between ferrous iron (Fe²⁺) and 1,10-phenanthroline, producing the tris(1,10-phenanthroline)iron(II) cation, commonly known as ferroin [8].
The complex formation reaction proceeds as follows:
Fe²⁺ + 3C₁₂H₈N₂ → [Fe(C₁₂H₈N₂)₃]²⁺
This complex exhibits a characteristic red-orange color with maximum absorption at 510 nm [8]. The high molar absorptivity of the complex (approximately 11,000 L·mol⁻¹·cm⁻¹) enables sensitive detection of iron at trace concentrations, with Beer's law typically obeyed over the concentration range of 1.1-11.2 μg of iron in 10 ml of eluate [8].
The formation constant of the iron(III)-1,10-phenanthroline complex has been determined in methanol solution, with stability influenced by the solvent medium. The complex demonstrates sufficient stability for accurate quantification while maintaining reproducibility across analytical replicates [12].
Research Reagent Solutions and Materials
Table 2: Essential Research Reagents for Iron-Phenanthroline Complex Method
| Reagent/Material | Function/Specification |
|---|---|
| 1,10-Phenanthroline | Complexing agent that forms colored complex with Fe²⁺ |
| Hydroxylamine hydrochloride | Reducing agent to convert Fe³⁺ to Fe²⁺ |
| Sodium acetate | pH buffer to maintain optimal conditions (pH 3-9) |
| Iron standard solution | Primary standard for calibration curve |
| Chitin (natural polymer) | Solid phase for preconcentration in column methods |
| Acetone-acetic acid eluent | Elution mixture (8:2 v/v) for recovery of complex |
| Cuvettes | Optical cells with standard 1 cm path length |
Information compiled from published methodologies [8] [12]
Experimental Protocols
Calibration Curve Methodology
The quantification of iron via spectrophotometry requires the establishment of a calibration curve using standard solutions of known concentration. The general procedure involves the following steps:
- Preparation of Standard Solutions: Create a series of iron standard solutions covering the concentration range of interest (typically 0.5-5.0 ppm)
- Complex Development:
- Add 1 mL of hydroxylamine hydrochloride solution (10% w/v) to each standard to reduce Fe³⁺ to Fe²⁺
- Add 2 mL of 1,10-phenanthroline solution (0.1% w/v in ethanol)
- Add 5 mL of sodium acetate solution (10% w/v) to buffer at pH ~3.5
- Dilute to volume with deionized water and allow 15 minutes for color development
- Absorbance Measurement: Measure absorbance at 510 nm against a reagent blank
- Calibration Plot: Graph absorbance versus concentration and determine the best-fit line
Table 3: Typical Calibration Data for Iron-Phenanthroline Complex
| Iron Concentration (μg/10 mL) | Absorbance at 510 nm |
|---|---|
| 0.0 | 0.000 |
| 2.0 | 0.180 |
| 4.0 | 0.360 |
| 6.0 | 0.540 |
| 8.0 | 0.720 |
| 10.0 | 0.900 |
Hypothetical data based on typical molar absorptivity of ~11,000 L·mol⁻¹·cm⁻¹
Sample Preparation and Analysis Workflow
The following diagram outlines the complete experimental workflow for the spectrophotometric determination of iron using the phenanthroline complex method:
For water samples or complex matrices, a preconcentration step may be incorporated using chitin as a natural polymer substrate. The iron-phenanthroline complex is retained on a chitin column in the presence of tetraphenylborate as a counter-ion, then eluted with an acetone-1M acetic acid mixture (8:2 v/v) prior to absorbance measurement [8].
Interference Studies
The iron-phenanthroline method exhibits good specificity when proper masking agents are employed. EDTA (ethylenediaminetetraacetic acid) effectively masks common interferents:
- No interference from Ca, Mg, Al, Mn, Zn, Cd, and Pb at concentrations up to 100 times that of iron
- No interference from Co, Ni, and Cu at concentrations up to 20 times that of iron
- Common inorganic anions show no interference at concentrations up to 10,000 times that of iron [8]
This selectivity profile makes the method particularly suitable for analyzing iron in complex matrices such as environmental waters, biological samples, and pharmaceutical formulations.
Applications in Research and Development
The spectrophotometric determination of iron using the Beer-Lambert Law has extensive applications across multiple scientific disciplines:
- Environmental Monitoring: Determination of iron in tap water, groundwater, and wastewater at concentration ranges of 1.1-11.2 μg/10 mL [8]
- Pharmaceutical Analysis: Quality control of iron-containing pharmaceuticals and nutritional supplements
- Biological Research: Quantification of iron in biological fluids and tissues for metabolic studies
- Materials Science: Analysis of iron complexes for applications in dye-sensitized solar cells as sustainable alternatives to ruthenium-based dyes [12]
- Industrial Processes: Monitoring iron concentrations in manufacturing processes and quality assurance protocols
The iron-phenanthroline method offers advantages of sensitivity, selectivity, and cost-effectiveness compared to more sophisticated techniques like atomic absorption spectroscopy or ICP-MS, while maintaining sufficient accuracy for routine analytical applications.
Data Analysis and Validation
Calculation of Iron Concentration
For samples falling within the linear range of the calibration curve, the iron concentration is determined directly from the linear regression equation:
c = (A - b) / m
Where:
- c = iron concentration
- A = measured absorbance
- b = y-intercept of calibration curve
- m = slope of calibration curve
The molar absorptivity (ε) can be calculated from the slope of the calibration curve using the relationship:
ε = m × (l)⁻¹
Where l is the path length in cm (typically 1 cm).
Method Validation Parameters
To ensure reliable results, method validation should include assessment of:
- Linearity: Correlation coefficient (r²) typically >0.995 across the working range
- Limit of Detection (LOD): Approximately 0.1 μg/10 mL for preconcentration methods
- Limit of Quantification (LOQ): Approximately 0.3 μg/10 mL
- Precision: Relative standard deviation <5% for replicate analyses
- Accuracy: Determination via spike recovery studies (95-105% recovery)
The robust theoretical foundation provided by the Beer-Lambert Law, combined with the well-characterized iron-phenanthroline complex chemistry, makes this methodology particularly valuable for research applications requiring precise iron quantification across diverse sample matrices.
The spectrophotometric determination of iron using 1,10-phenanthroline is a fundamental method in analytical chemistry for assessing drinking water quality. The reliability of this analysis is heavily dependent on two critical reagent systems: hydroxylamine hydrochloride as a reducing agent and pH buffers to maintain the optimal analytical environment. This application note details their specific roles, protocols for use, and key considerations to ensure accurate and reproducible results. The method is based on the formation of a red-orange tris(1,10-phenanthroline)iron(II) complex, a chelate known for its high molar absorptivity and stability, which allows for the sensitive detection of trace iron levels in water samples [13] [14].
The Scientist's Toolkit: Essential Reagents and Their Functions
The successful determination of iron via this spectrophotometric method requires a specific set of reagent solutions. The table below catalogs these essential materials and explains their critical function within the analytical protocol.
Table 1: Key Research Reagent Solutions for the Spectrophotometric Determination of Iron
| Reagent Solution | Function in the Analysis |
|---|---|
| 1,10-Phenanthroline | A chelating agent that selectively reacts with Fe²⁺ ions to form the intensely colored Fe(phen)₃²⁺ complex, which is measured spectrophotometrically [13] [14]. |
| Hydroxylamine Hydrochloride | A critical reducing agent that converts any Fe³⁺ ions present in the sample to Fe²⁺, ensuring that the total dissolved iron is available for complexation [13]. It also maintains iron in the +2 state by counteracting re-oxidation by dissolved oxygen [13]. |
| Sodium Acetate Buffer | Maintains the reaction pH within the optimal range (pH 3 to 3.5). This ensures rapid and complete complex formation, prevents oxidation of Fe²⁺, and stops H⁺ ions from competing for the phenanthroline reagent [13] [14]. |
| Standard Iron Solution | A solution of known iron concentration, typically prepared from Fe(NH₄)₂(SO₄)₂•6H₂O (ferrous ammonium sulfate), used to construct the calibration curve for quantitative analysis [13]. |
| Sulfuric Acid (H₂SO₄) | Used in the preparation of the standard iron stock solution to prevent hydrolysis and precipitation of the iron salt, ensuring its stability [13]. |
Roles and Mechanisms of Critical Reagents
Hydroxylamine Hydrochloride: The Reducing Agent
Hydroxylamine hydrochloride (NH₂OH•HCl) serves a dual purpose in the analytical procedure. Its primary function is the quantitative reduction of Fe³⁺ to Fe²⁺. Since iron in aerated water is predominantly found in the +3 oxidation state, this reduction is essential for the method to measure total dissolved iron [13]. The reaction can be summarized as: 2Fe³⁺ + 2NH₂OH•HCl → 2Fe²⁺ + N₂↑ + 2H₂O + 4H⁺ + 2Cl⁻
Secondly, an excess of hydroxylamine is required to maintain the iron in its reduced state throughout the analysis. Dissolved oxygen in the solution can slowly reoxidize Fe²⁺ back to Fe³⁺ over time. The presence of the reducing agent acts as a sacrificial agent, preventing this reoxidation and thereby stabilizing the developed color and ensuring the analytical signal remains stable [13].
Sodium Acetate: The pH Buffer
The function of the sodium acetate buffer is to provide a stable and optimal pH environment, which is critical for the quantitative and reproducible formation of the iron-phenanthroline complex. The recommended pH range for the analysis is between 3.2 and 3.5 [13] [14]. The buffer's role is threefold:
- Ensures Complete Complexation: Within this pH window, the complexation of Fe²⁺ by three phenanthroline molecules proceeds rapidly and to completion.
- Prevents Iron Oxidation: At a pH that is too high (e.g., >9), the ferrous ion (Fe²⁺) is susceptible to oxidation to ferric ion (Fe³⁺), which does not form the colored complex with phenanthroline [13].
- Suppresses Reagent Protonation: At a pH that is too low (e.g., <3), the high concentration of H⁺ ions competes with Fe²⁺ for the basic nitrogen sites on the 1,10-phenanthroline molecule, leading to the formation of phenanthroline hydrochloride (phenH⁺) and resulting in incomplete complexation [13].
Experimental Protocols
Preparation of Reagent Solutions
The following solutions should be prepared for the analysis [13]:
- Hydroxylamine hydrochloride (0.29 M): Dissolve an appropriate mass of NH₂OH•HCl in deionized water.
- 1,10-Phenanthroline (5.0 x 10⁻³ M): Dissolve the chelating agent in deionized water.
- Sodium acetate buffer (1.2 M): Prepare a solution of sodium acetate in deionized water. The pH will naturally be in the required range.
- Standard iron stock solution (5.0 x 10⁻⁴ M): Accurately weigh about 0.100 g of ferrous ammonium sulfate hexahydrate (Fe(NH₄)₂(SO₄)₂•6H₂O, FW = 392.14). Transfer it quantitatively to a 500 mL volumetric flask. Add about 10 mL of 2 M H₂SO₄ and 50 mL of deionized water to dissolve the salt. Dilute to the mark with deionized water and mix thoroughly.
Sample and Calibration Standard Preparation
This procedure outlines the preparation of both calibration standards and unknown water samples for spectrophotometric measurement [13].
Figure 1: Sample and standard preparation workflow for the phenanthroline-based iron determination method.
- Prepare Working Standards: Pipet 0, 0.5, 1.0, 1.5, 2.0, and 2.5 mL of the standard iron stock solution into a series of six labeled 50 mL volumetric flasks. The '0' mL standard serves as the method blank.
- Prepare Water Samples: Pipet a 25 mL aliquot of the water sample (e.g., cold or hot tap water) into a separate 50 mL volumetric flask. If the iron concentration is expected to be high, a smaller volume should be used and diluted to the mark.
- Add Reagents Sequentially: To each flask, add the following reagents in order:
- 1.0 mL of 0.29 M hydroxylamine hydrochloride solution.
- 5.0 mL of 1.2 M sodium acetate solution.
- 5.0 mL of 5.0 x 10⁻³ M 1,10-phenanthroline solution.
- Dilute and Develop Color: Dilute each flask to the 50 mL mark with deionized water and mix thoroughly. Allow the solutions to stand for 10 minutes to ensure complete color development and complex formation. Mix the solutions again before measurement.
Spectrophotometric Measurement and Data Analysis
- Instrument Blanking: Use deionized water as a blank to zero the spectrophotometer. This corrects for any absorbance from the cuvette or the solvent.
- Measure Absorbance: Set the spectrophotometer to a wavelength of 508 nm. Rinse the cuvette with the solution to be measured three times, then fill it and measure the absorbance. It is good practice to work from the lowest to the highest concentration standard to minimize carryover [13].
- Construct Calibration Curve: Plot the average absorbance of the standard solutions against their iron concentration. The concentration of the working standards can be calculated, considering the dilution factor, and is typically expressed in mg/L (ppm). The table below provides an example calculation for the standard series.
Table 2: Preparation and Expected Data for Iron Calibration Standards
| Volume of Standard (mL) | Final [Fe] (mol/L) | Final [Fe] (ppm)* | Expected Absorbance (Example) |
|---|---|---|---|
| 0.0 | 0.00 x 10⁻⁵ | 0.00 | 0.000 |
| 0.5 | 0.50 x 10⁻⁵ | 0.28 | 0.105 |
| 1.0 | 1.00 x 10⁻⁵ | 0.56 | 0.210 |
| 1.5 | 1.50 x 10⁻⁵ | 0.84 | 0.315 |
| 2.0 | 2.00 x 10⁻⁵ | 1.12 | 0.420 |
| 2.5 | 2.50 x 10⁻⁵ | 1.40 | 0.525 |
*Calculated based on a 5.0x10⁻⁴ M stock diluted to 50 mL.
- Data Analysis: Perform linear regression on the standard data to obtain the Beer's Law equation in the form A = m[Fe] + b, where A is absorbance and [Fe] is the iron concentration. The molar absorptivity (ε) of the Fe(phen)₃²⁺ complex can be calculated from the slope (m) and the pathlength of the cuvette (usually 1 cm), using the relationship A = εbc. The literature value for ε is approximately 11,100 M⁻¹cm⁻¹ at 508 nm [13]. Use the calibration equation to determine the concentration of iron in the unknown water samples.
Troubleshooting and Quality Control
- Interferences: Strong oxidizing agents, cyanide, nitrite, phosphates, and high concentrations of certain metal ions like cobalt, copper, and nickel can interfere with the analysis [14]. The initial addition of acid and the excess hydroxylamine help mitigate some of these interferences.
- Quality Control: Analyze a challenge sample of known concentration ("spiked unknown") with each batch to verify method recovery and accuracy [13]. The recovery should ideally be between 95-105%.
- Non-zero intercept: A small non-zero intercept in the calibration curve is common and may be due to background matrix effects. The limit of detection (LOD) and limit of quantitation (LOQ) should be calculated based on the standard error of the calibration curve [13]. The phenanthroline method can achieve a detection limit for iron as low as 10 μg/L with a 5 cm pathlength cell [14].
Within the framework of research on the spectrophotometric determination of iron, identifying the optimal analytical wavelength is a fundamental step for achieving high sensitivity and accuracy. This protocol details the methodology for identifying the maximum absorption wavelength (λmax) of the iron(II)-1,10-phenanthroline complex, a critical parameter for quantitative analysis. The iron-phenanthroline complex exhibits an intense orange-red color, and its absorption maximum is consistently reported in the region of 508 nm to 510 nm [13] [15]. Establishing this λmax allows researchers to leverage the Beer-Lambert Law, which states a linear relationship between absorbance and concentration, thereby enabling the precise determination of iron concentration in unknown samples [6]. This document provides detailed application notes and standardized protocols for this essential analytical procedure.
Theoretical Foundations
The Beer-Lambert Law and Absorbance
The Beer-Lambert Law forms the cornerstone of quantitative absorption spectroscopy. It defines the logarithmic relationship between the attenuation of light through a substance and its properties. The law is mathematically expressed as:
A = ε * c * l
Where:
- A is the Absorbance (a dimensionless quantity) [6].
- ε is the molar absorption coefficient (M⁻¹cm⁻¹), a substance-specific property that measures its absorption strength at a given wavelength [6].
- c is the concentration of the absorbing species (M) [6].
- l is the optical path length (cm), typically the width of the cuvette used for measurement [6].
Absorbance (A) is quantitatively related to transmittance (T), which is the ratio of transmitted (I) to incident light (I₀). The relationship is defined as A = -log(T) [6]. This logarithmic dependence means that small changes in concentration result in measurable changes in absorbance, making it a robust quantitative tool. Key absorbance and transmittance pairings are summarized in Table 1.
Table 1: Fundamental Relationship Between Absorbance and Transmittance
| Absorbance (A) | Transmittance (T) |
|---|---|
| 0 | 100% |
| 1 | 10% |
| 2 | 1% |
| 3 | 0.1% |
| 4 | 0.01% |
| 5 | 0.001% |
The Iron(II)-1,10-Phenanthroline Complex
The determination of iron is based on its reaction with 1,10-phenanthroline (phen) to form a stable, intensely colored complex in solution:
Fe²⁺ + 3 phen → Fe(phen)₃²⁺
This complex, tris(1,10-phenanthroline)iron(II), is responsible for the distinct red-orange color and exhibits a strong absorption band in the visible region due to its molecular structure [13]. Since iron in environmental and biological samples often exists in the +3 oxidation state (Fe³⁺), a quantitative reduction to Fe²⁺ is a critical prerequisite. This is typically achieved using a reducing agent like hydroxylamine hydrochloride [13]. The complexation reaction is also pH-dependent; an appropriate pH range (3 to 9) is maintained using a sodium acetate buffer to ensure complete complex formation and prevent the oxidation of Fe²⁺ or protonation of the reagent [13].
The Scientist's Toolkit: Essential Research Reagents and Materials
The following table lists the key reagents, materials, and instruments required for the spectrophotometric determination of iron via the phenanthroline method.
Table 2: Essential Research Reagent Solutions and Materials
| Item | Function / Role in the Experiment |
|---|---|
| 1,10-Phenanthroline | The complexing agent that reacts with Fe²⁺ to form the colored Fe(phen)₃²⁺ complex [13]. |
| Hydroxylamine Hydrochloride | A reducing agent that converts all iron in the sample to the Fe²⁺ state, ensuring it is available for complexation [13]. |
| Sodium Acetate | A buffer used to maintain the reaction solution at an optimal pH (around 3.5) for complete and stable complex formation [13]. |
| Standard Iron Solution | A solution of known iron concentration (e.g., from Fe(NH₄)₂(SO₄)₂·6H₂O) used to construct the calibration curve [13]. |
| Spectrophotometer | Instrument used to measure the absorbance of light by the solution at specific wavelengths [13] [15]. |
| Cuvette | A container, typically with a 1 cm path length, that holds the sample solution during absorbance measurement [6] [13]. |
| Volumetric Flasks | For accurate preparation and dilution of standard and sample solutions [13]. |
Experimental Protocol
The following diagram outlines the complete experimental workflow for determining iron concentration, from sample preparation to data analysis.
Detailed Procedure for Identifying λmax and Quantifying Iron
A. Preparation of Working Standard Solutions [13]
- Pipet a series of known volumes (e.g., 0, 0.5, 1.0, 1.5, 2.0, and 2.5 mL) of a standard iron solution (e.g., 5.0 x 10⁻⁴ M) into a set of 50 mL volumetric flasks.
- To each flask, add the following reagents in sequence:
- 1 mL of hydroxylamine hydrochloride solution (0.29 M).
- 5 mL of sodium acetate solution (1.2 M).
- 5 mL of 1,10-phenanthroline solution (5.0 x 10⁻³ M).
- Dilute each flask to the 50 mL mark with deionized water and mix thoroughly.
- Allow the solutions to stand for at least 10 minutes to ensure full color development before measuring absorbance.
B. Spectrophotometric Measurement and λmax Identification
- Instrument Blank: Fill a cuvette with deionized water and use it to zero (blank) the spectrophotometer.
- Wavelength Scan: Using the intermediate concentration standard (e.g., 1.5 mL standard solution), measure its absorbance across a range of wavelengths, for example, from 450 nm to 550 nm.
- Identify λmax: Plot absorbance versus wavelength. The peak of this graph is the maximum absorption wavelength (λmax). For the Fe(phen)₃²⁺ complex, this is expected to be between 508 nm and 510 nm [13] [15]. An example of absorption spectra for a different but analogous system is shown in Figure 1.
Table 3: Example Absorbance Data from a Wavelength Scan
| Wavelength (nm) | Absorbance (A) |
|---|---|
| 450 | 0.105 |
| 470 | 0.230 |
| 490 | 0.598 |
| 500 | 0.745 |
| 505 | 0.805 |
| 508 | 0.811 |
| 510 | 0.808 |
| 512 | 0.800 |
| 515 | 0.760 |
| 530 | 0.450 |
| 550 | 0.150 |
C. Quantification of Iron via Calibration Curve
- Measure Standards: Using the λmax identified (e.g., 510 nm), measure the absorbance of all standard solutions prepared in Section A.
- Construct Calibration Curve: Plot the average absorbance of each standard solution against its known iron concentration. Perform linear regression to obtain the calibration equation in the form A = m[Fe] + b, where 'm' is the slope and 'b' is the y-intercept [13] [15].
- Analyze Unknowns: Prepare unknown samples (e.g., groundwater, tap water) following the same procedure as the standards. Measure their absorbance at λmax and use the calibration equation to calculate their iron concentration.
Data Analysis and Reporting
Calibration and Quantitative Results
Accurate reporting of experimental data is crucial for verification and reproducibility [16]. The quantitative data derived from the calibration curve should be clearly summarized. Table 4 provides a template for presenting calibration data, and Table 5 shows an example calculation for an unknown sample.
Table 4: Calibration Data for Iron Determination at 510 nm
| Standard Solution | Iron Concentration (mg/L) | Absorbance (A) | Linear Regression Fit (A) |
|---|---|---|---|
| Blank | 0.00 | 0.000 | 0.005 |
| Std 1 | 0.10 | 0.215 | 0.214 |
| Std 2 | 0.20 | 0.422 | 0.423 |
| Std 3 | 0.30 | 0.641 | 0.632 |
| Std 4 | 0.40 | 0.840 | 0.841 |
| Std 5 | 0.50 | 1.050 | 1.050 |
Calibration Equation: A = 2.083[Fe] + 0.005 | R² = 0.9998
Table 5: Determination of Iron in Unknown Water Samples
| Sample Description | Absorbance (A) | Calculated [Fe] (mg/L) | Compliance with Standard (e.g., ≤0.3 mg/L) |
|---|---|---|---|
| Cold Tap Water | 0.320 | 0.151 mg/L | Compliant |
| Hot Tap Water | 0.405 | 0.192 mg/L | Compliant |
| Groundwater Sample A | 0.680 | 0.324 mg/L | Exceeds Limit |
Calculation of Molar Absorptivity
The molar absorptivity (ε) is a key parameter representing the sensitivity of the method. It can be calculated from the slope (m) of the calibration curve and the path length (l) of the cuvette (typically 1 cm) using the following relationship derived from the Beer-Lambert Law:
ε = m / l
For example, with a slope of 2.083 M⁻¹ and a 1 cm path length, the molar absorptivity would be approximately 2,083 M⁻¹cm⁻¹. This value should be compared with literature values, such as the reported 11,100 M⁻¹cm⁻¹ for Fe(phen)₃²⁺ at 508 nm, with any differences explained by potential methodological variations [13].
Applications and Context in Research
This methodology is directly applicable in environmental monitoring and public health research. For instance, it has been employed to assess iron concentrations in groundwater, with studies confirming that most samples comply with the WHO and Libyan national standard of 0.3 mg/L, though some exceedances necessitate continuous monitoring [15]. The precision of the method is often verified using the standard addition technique, yielding linear equations with high correlation coefficients (e.g., r² = 0.9992), which confirms the reliability of the results and the absence of significant matrix interference [15]. The fundamental principles of absorbance measurement and the utility of λmax extend beyond this specific assay, forming the basis for the analysis of various compounds, including synthetic food dyes like Allura Red AC and Ponceau 4R, where shifts in λmax can be used to study acid-base properties and determine dissociation constants [17].
From Theory to Practice: Step-by-Step Protocols for Complex Matrices
This document outlines a standard operating procedure (SOP) for the spectrophotometric determination of iron via the formation of the red-orange tris(1,10-phenanthroline)iron(II) complex, commonly known as the phenanthroline method. This SOP is framed within ongoing thesis research aimed at refining analytical techniques for transition metal quantification, with applications in pharmaceutical development and environmental science [14] [13]. The method is based on the complexation of ferrous iron (Fe²⁺) with three 1,10-phenanthroline molecules to form a stable, colored complex suitable for quantitative analysis [14].
Principle of the Method
Iron present in a sample is first brought into solution and reduced from the ferric (Fe³⁺) to the ferrous (Fe²⁺) state using hydroxylamine hydrochloride [13] [18]. The ferrous iron then reacts with 1,10-phenanthroline at a controlled pH of 3.2 to 3.5 to form the tris(1,10-phenanthroline)iron(II) complex, which exhibits an intense orange-red color [14]. The absorbance of this complex is measured at 508 nm and is proportional to the iron concentration in the sample, adhering to the Beer-Lambert law [13] [18]. The method is effective for determining both dissolved and total iron, with a typical analytical range of 10 to 500 µg/L [14].
Research Reagent Solutions and Materials
Table 1: Essential Reagents and Materials for the Phenanthroline Method.
| Reagent/Material | Typical Composition/Specification | Function in the Procedure |
|---|---|---|
| 1,10-Phenanthroline | 5.0 x 10⁻³ M aqueous solution [13] | Chromogenic reagent; chelates Fe²⁺ to form the colored complex [14] [18]. |
| Hydroxylamine Hydrochloride | 0.29 M aqueous solution [13] | Reducing agent; converts Fe³⁺ to Fe²⁺ and prevents oxidation by dissolved oxygen [13] [18]. |
| Sodium Acetate Buffer | 1.2 M aqueous solution [13] | pH control; maintains the reaction pH between 3.2 and 3.5 for rapid and complete color development [14] [13]. |
| Sulfuric Acid | 2.0 M [13] or 1.0 M HCl [18] | Sample digestion; used to dissolve and bring iron into solution from solid samples [18]. |
| Standard Iron Solution | e.g., 5.0 x 10⁻⁴ M from Fe(NH₄)₂(SO₄)₂·6H₂O [13] | Calibration; used to prepare a series of standard solutions for constructing the calibration curve. |
| Deionized Water | -- | Solvent and diluent. |
Apparatus and Instrumentation
- Spectrophotometer or Photometer: Capable of measuring absorbance at a wavelength of 508 nm [13] [18].
- Cuvettes: 1 cm light path, or longer paths (e.g., 5 cm) for enhanced sensitivity with low iron concentrations [14].
- Volumetric Flasks: Various sizes (e.g., 50 mL, 500 mL, 1 L) for precise dilution [13] [18].
- Pipettes: Various capacities for accurate transfer of solutions.
- Beakers, Filtration Apparatus (for solid samples) [18].
Experimental Protocol
Sample Preparation
5.1.1 Water Samples: For the determination of total iron, collect a representative sample in a clean, acid-washed container. If necessary, acidify at the time of collection to prevent adsorption of iron to the container walls [14]. For dissolved iron, filter the sample through a 0.45 µm membrane filter immediately after collection [14].
5.1.2 Solid Samples (e.g., Pharmaceuticals, Biological Materials): Accurately weigh a representative portion of the homogenized solid (e.g., a crushed multivitamin pill) [18]. Transfer quantitatively to a beaker, add ~150 mL of 1.0 M HCl, and heat near boiling for 10 minutes to digest and dissolve the iron [18]. Cool, then vacuum-filter the solution to remove particulates. Transfer the clear filtrate to a 1 L volumetric flask and dilute to the mark with deionized water [18].
Reduction and Complex Development
The following procedure is adapted for preparing a 50 mL final volume, suitable for analysis in a cuvette [13].
- Pipette an appropriate aliquot of the sample (e.g., 25 mL for water samples) or standard solution into a 50 mL volumetric flask [13].
- Add 1 mL of hydroxylamine hydrochloride solution and mix [13] [18].
- Add 5 mL of sodium acetate buffer solution and mix. This establishes the optimal pH of 3.2-3.5 [13].
- Add 5 mL of 1,10-phenanthroline solution and mix [13] [18].
- Dilute to the 50 mL mark with deionized water and mix thoroughly.
- Allow the solution to stand for at least 10 minutes to ensure full color development [13].
Spectrophotometric Measurement
- Instrument Setup: Turn on the spectrophotometer and allow it to warm up. Set the wavelength to 508 nm [13] [18].
- Blank Preparation: Prepare a reagent blank using deionized water treated with the same reagents (steps 2-6 above).
- Calibration: Measure the absorbance of the standard solutions. Use the blank to zero the instrument.
- Sample Measurement: Measure the absorbance of the prepared sample solutions.
Data Analysis
- Calibration Curve: Plot the absorbance of the standard solutions against their known iron concentrations. Perform linear regression to obtain the equation of the line (A = m[Fe] + b) [13].
- Concentration Calculation: Use the calibration equation to calculate the concentration of iron in the sample solution based on its measured absorbance.
- Result Calculation: Account for all dilution factors to back-calculate the original iron concentration in the sample [18].
Workflow Visualization
Quality Assurance and Control
- Calibration Verification: Analyze a standard solution as a quality control check with each batch of samples.
- Reagent Blank: A reagent blank must be carried through the entire procedure to correct for any absorbance from impurities [14].
- Precision: Analyze samples in duplicate or triplicate.
- Holding Times: Samples should be analyzed within the specified holding time (e.g., 6 months for properly preserved water samples) [14].
Method Performance and Interferences
Table 2: Analytical Performance and Interfering Substances.
| Parameter | Specification | Notes |
|---|---|---|
| Detection Level | 10 µg/L [14] | With a 5 cm light path. |
| Applicable Range | Up to 500 µg/L and higher [14] | Can be extended by dilution or using a shorter path length. |
| Precision (RSD) | 25.5% [14] | At 300 µg/L level. |
| Color Stability | At least 6 months [14] | For prepared color standards. |
| Common Interferences | Strong oxidizing agents, cyanide, nitrite, phosphates (especially polyphosphates), and high concentrations of Co, Cu, Ni, Zn, Cd, Hg, Ag, Bi [14]. | Initial boiling with acid converts polyphosphates and removes cyanide/nitrite. Excess hydroxylamine counters oxidizers. Excess phenanthroline can mitigate metal ion interference [14]. |
The spectrophotometric determination of iron using the 1,10-phenanthroline method is a cornerstone technique in environmental and geochemical research. It relies on the formation of a stable, orange-red ferroin complex ([Fe(phen)₃]²⁺) with ferrous iron (Fe²⁺), which can be quantified by its absorbance at 510 nm [4] [19]. This method is prized for its sensitivity, selectivity for Fe²⁺, and overall robustness [20].
A significant challenge, however, arises when this method is applied to samples where iron has been extracted using oxalate-based solutions, a common practice in sequential extraction procedures for quantifying specific iron oxide phases in sediments and soils [4]. In such oxalate-rich matrices, the oxalate anion (C₂O₄²⁻) acts as a potent competing ligand, forming stable complexes with iron (e.g., [Fe(C₂O₄)₃]³⁻) that inhibit the subsequent formation of the colored ferroin complex, leading to substantial analytical underestimation [4].
This Application Note details a novel, robust, and cost-effective pretreatment protocol to overcome this matrix interference. The method is based on a critical pH adjustment step that disrupts the iron-oxalate complex, thereby enabling accurate iron quantification via the standard 1,10-phenanthroline method without the need for sophisticated instrumentation or extensive sample pretreatment [4].
The Mechanism of Interference and Resolution
The Competitive Complexation Environment
In an oxalate-rich extract, a competition exists for the available ferrous and ferric iron. The stability constants of the involved complexes dictate the equilibrium. Oxalate forms a highly stable complex with iron, which, under acidic to neutral conditions, is favored over the ferroin complex. The interference mechanism can be summarized as follows:
- Presence of Oxalate: The extract contains a high concentration of oxalate ions.
- Formation of Iron-Oxalate Complex: Iron (both Fe²⁺ and Fe³⁺) is sequestered into soluble, colorless oxalate complexes ([Fe(C₂O₄)₂]²⁻, [Fe(C₂O₄)₃]³⁻, etc.).
- Suppression of Ferroin Formation: The 1,10-phenanthroline reagent cannot effectively compete for the iron, resulting in weak or no color development.
The pH Adjustment Solution
The proposed method overcomes this interference by leveraging the pH dependence of ligand complexation. By adjusting the pH of the oxalate-rich sample to a weakly alkaline range (pH 7–9) before adding the phenanthroline reagents, the iron-oxalate complex is effectively destabilized [4].
The underlying principle is that in alkaline conditions, the oxalate ion can undergo reactions that reduce its effective concentration for complexing with iron. This shifts the equilibrium, liberating free iron ions. The hydroxylamine hydrochloride simultaneously reduces any Fe³⁺ to Fe²⁺, allowing the 1,10-phenanthroline to form the stable ferroin complex without competitive inhibition [4]. The diagram below illustrates this process and the experimental workflow.
Diagram 1: Visual summary of oxalate interference and the resolving pH adjustment workflow.
Reagents, Materials, and Instrumentation
The Scientist's Toolkit: Essential Research Reagents
Table 1: Key reagents and materials required for the protocol.
| Reagent/Material | Function & Specification | Notes for Preparation |
|---|---|---|
| Ammonium Oxalate Buffer | Common extractant for amorphous/poorly-crystalline iron (hydro)oxides [4]. | Prepared as a 0.2 M solution, pH 3.0-3.2, as per standard sequential extraction protocols. |
| Hydroxylamine Hydrochloride (10% m/v) | A reducing agent that ensures all iron is in the ferrous (Fe²⁺) state, which is necessary for complexation with 1,10-phenanthroline [4]. | Dissolve 10 g of NH₂OH·HCl in 100 mL of deionized water. |
| 1,10-Phenanthroline (0.5% m/v) | The primary complexing agent that forms the orange-red ferroin complex with Fe²⁺ [4] [19]. | Dissolve 0.5 g of 1,10-phenanthroline monohydrate in 100 mL of deionized water. |
| Sodium Hydroxide (10 M & 1 M) or Concentrated Ammonia | Used for the critical pH adjustment step to disrupt the iron-oxalate complex [4]. | Prepare from analytical-grade pellets. Ammonia is an effective alternative. |
| Hydrochloric Acid (25% v/v) | Used for creating an initial acidic environment if needed and for pH adjustment fine-tuning [4]. | Dilute concentrated HCl appropriately. |
| Iron Standard Solution | For calibration curve generation. A stock solution of 1000 mg/L Fe is typical. | Dilute to working standards (e.g., 1-5 mg/L) as required. |
| Deionized Water | Solvent and diluent for all reagents and samples. | Resistivity ≥18 MΩ·cm. |
| Spectrophotometer | Instrument for absorbance measurement of the ferroin complex. | Capable of measurements at 510 nm, using 1 cm pathlength cuvettes. |
| pH Meter | Critical for verifying the pH adjustment to the 7–9 range. | Calibrated with standard buffers. |
Detailed Experimental Protocol
Step-by-Step Procedure for Oxalate-Extractable Iron Measurement
Sample Preparation: Begin with the oxalate-rich extract obtained from your sediment or soil sequential extraction procedure [4]. Ensure the sample is well-mixed.
pH Adjustment (Critical Step):
- Transfer a known volume (e.g., 1-5 mL) of the oxalate extract into a clean test tube or volumetric flask.
- While monitoring with a pH meter, slowly add 10 M sodium hydroxide (NaOH) or concentrated ammonia dropwise with gentle swirling until the pH of the solution is stable within the 7.0 to 9.0 range [4]. This step is crucial for breaking the iron-oxalate complexes.
- Note: A slight precipitate may form but does not typically interfere.
Reduction and Complexation:
Dilution to Volume: Dilute the mixture to the final mark (e.g., 10 mL or 25 mL) with deionized water and mix thoroughly.
Color Development and Measurement:
Calibration:
- Prepare a series of iron standard solutions (e.g., 0, 1, 2, 3, 4, 5 mg/L) by diluting a stock iron standard.
- Subject these standards to the exact same procedure (steps 2-5) as the unknown samples. This is critical as it incorporates the matrix-matching principle, accounting for any residual effects from the reagents.
Data Analysis and Calculation
- Construct a calibration curve by plotting the absorbance of the standards against their known iron concentrations.
- Determine the concentration of iron in the sample extract ([Fe]ₛₐₘₚₗₑ) from the linear regression equation of the calibration curve.
- The concentration of oxalate-extractable iron in the original solid sample can be calculated using the following formula:
Iron (mg/kg) = ([Fe]ₛₐₘₚₗₑ × V × D) / MWhere:[Fe]ₛₐₘₚₗₑ= Iron concentration from calibration curve (mg/L)V= Final volume of the measured solution (L)D= Any additional dilution factorM= Mass of the original solid sample (kg)
Validation and Analytical Performance
The method's validity was confirmed through rigorous testing, demonstrating excellent correlation with theoretical values and robust performance characteristics [4].
Precision and Accuracy
Table 2: Summary of the method's key analytical performance metrics.
| Parameter | Result & Specification | Experimental Conditions |
|---|---|---|
| Optimal pH Range | 7 – 9 | Effective pH window for color development in the presence of oxalate [4]. |
| Linear Range | 1 – 5 mg/L (can be extended to 0.2-10 mg/L) | Abs = 0.1934 × Conc + 0.1360 (R² = 0.9997) [4]. |
| Molar Absorptivity (ε) | ~1.3 × 10⁴ L·mol⁻¹·cm⁻¹ | Confirms the maintained sensitivity of the ferroin complex [4]. |
| Color Stability | >4 days | When stored in a light-proof environment [4]. |
| Accuracy | Strong correlation between measured and theoretical iron concentrations. | Validated with spiked samples and standard reference materials [4]. |
Application Notes and Troubleshooting
- Preservation of Samples: For reproducible results, analyze oxalate extracts promptly after extraction. If storage is necessary, refrigerate and protect from light.
- Reagent Purity: Use analytical-grade reagents and high-purity water to minimize blank interference and background noise.
- Matrix Complexity: For samples with exceptionally high organic matter or other potential interferents, performing a standard addition calibration is recommended to verify accuracy.
- Troubleshooting Low Absorbance:
- Incomplete pH Adjustment: Confirm the final pH after adjustment is firmly within 7-9.
- Insufficient Reduction Time: Ensure the hydroxylamine hydrochloride has adequate time (≥10 min) to reduce all Fe³⁺.
- Incomplete Color Development: Allow the full 10-15 minutes after adding 1,10-phenanthroline before measurement.
- Alternative Applications: This pH-adjustment strategy shows promise for enabling the 1,10-phenanthroline method in other complexing matrices beyond oxalate, increasing the versatility of this classic spectrophotometric technique.
This Application Note presents a validated, simple, and effective protocol for the accurate determination of iron in oxalate-rich extracts using the standard 1,10-phenanthroline method. The core innovation—a single pH adjustment to a weakly alkaline condition (pH 7–9)—effectively neutralizes the primary matrix interference, unlocking the power of this accessible and cost-effective spectrophotometric technique for geochemical and environmental analysis. This method eliminates the need for complex sample pre-treatments or expensive instrumentation, making precise iron quantification accessible to a wider range of laboratories.
This application note provides detailed protocols for the preparation of stock solutions and validation of the linear range for calibration curves, framed within the context of spectrophotometric determination of iron using the phenanthroline complex. Designed for researchers, scientists, and drug development professionals, this guide covers fundamental principles, step-by-step procedures, and best practices to ensure the generation of reliable, high-quality analytical data. The methodologies outlined support robust quantitative analysis, which is fundamental to research and development activities, including pharmaceutical formulation.
In analytical chemistry, a calibration curve (also known as a standard curve) is a fundamental tool used to determine the concentration of an unknown substance by comparing it to a set of standard samples with known concentrations [21]. The relationship between the instrumental response (e.g., absorbance in spectrophotometry) and the analyte concentration is established, allowing for the quantitation of unknowns [21] [22]. The linear range is defined as the concentration interval over which the instrumental response is directly proportional to the concentration of the analyte [23]. For a method to provide results with an acceptable uncertainty, the working range must be established, which may sometimes be wider than the strictly linear range [23].
In the context of the spectrophotometric determination of iron using 1,10-phenanthroline, the iron(II) ions form a red-orange complex with the reagent, which absorbs light strongly in the visible range (~510 nm). The intensity of this color is proportional to the iron concentration, making a calibration curve essential for accurate determination. This document details the protocols for preparing the necessary stock solutions and for rigorously validating the linearity of this relationship.
The Scientist's Toolkit: Essential Research Reagent Solutions
The following table lists the key reagents, materials, and equipment required for the spectrophotometric determination of iron and the construction of a reliable calibration curve.
Table 1: Essential Materials and Reagents for Iron Determination via Phenanthroline Complex Method
| Item | Function/Brief Explanation |
|---|---|
| 1,10-Phenanthroline | The complexing agent that reacts with Fe²⁺ ions to form the stable red-orange [Fe(phen)₃]²⁺ complex, which is measured spectrophotometrically. |
| Iron Standard (e.g., Ferrous Ammonium Sulfate) | A high-purity compound used to prepare a primary stock solution with a precisely known concentration of iron. |
| Hydroxylamine Hydrochloride | A reducing agent added to ensure all iron is in the ferrous (Fe²⁺) state before complexation with phenanthroline. |
| Sodium Acetate Buffer | Maintains the reaction pH between 3 and 9 (optimal ~4-5) for stable and quantitative complex formation. |
| Volumetric Flasks | Used for preparing stock and standard solutions with high precision and accuracy. |
| Pipettes and Tips | For accurate measurement and transfer of specific liquid volumes during serial dilution. |
| UV-Vis Spectrophotometer | The instrument used to measure the absorbance of the iron-phenanthroline complex at a specific wavelength (~510 nm). |
| Cuvettes | Sample holders for the spectrophotometer; compatible with the visible wavelength range. |
Experimental Protocols
Protocol 1: Preparation of Stock and Standard Solutions
A accurately prepared stock solution is the critical first step for a reliable calibration curve.
Materials:
- Primary iron standard (e.g., high-purity ferrous ammonium sulfate, Fe(NH₄)₂(SO₄)₂·6H₂O)
- 1,10-Phenanthroline solution (e.g., 0.1% w/v in water)
- Hydroxylamine hydrochloride solution (e.g., 10% w/v in water)
- Sodium acetate buffer (e.g., 1 M, pH ~4.5)
- Deionized water
- Analytical balance
- Volumetric flasks (e.g., 100 mL, 50 mL, multiple 25 mL)
- Precision pipettes and tips
Procedure:
- Primary Stock Solution: Accurately weigh approximately 0.07 g of ferrous ammonium sulfate (exact mass recorded to 0.1 mg) and transfer quantitatively into a 100 mL volumetric flask. Dissolve and dilute to the mark with deionized water. Calculate the exact concentration of iron in this stock solution in µg/mL. (Note: The molecular weight of Fe(NH₄)₂(SO₄)₂·6H₂O is 392.14 g/mol, and the atomic weight of Fe is 55.85 g/mol).
- Intermediate Stock Solution: Pipette 10.0 mL of the primary stock solution into a 50 mL volumetric flask and dilute to the mark with deionized water. This intermediate dilution expands the dynamic preparation range.
- Working Standard Solutions (Calibration Standards): Using a serial dilution technique, prepare a minimum of five standard solutions covering the expected linear range (e.g., 0.5 - 5.0 µg/mL Fe). Label a series of 25 mL volumetric flasks.
- Pipette appropriate volumes of the intermediate stock solution (e.g., 0.5, 1.0, 2.0, 3.0, 4.0, 5.0 mL) into each flask.
- To each flask, add in sequence:
- 1.0 mL of hydroxylamine hydrochloride solution (to reduce Fe³⁺ to Fe²⁺).
- 2.0 mL of the 1,10-phenanthroline solution.
- 5.0 mL of sodium acetate buffer.
- Dilute each flask to the 25 mL mark with deionized water and mix thoroughly.
- Allow the color to develop for at least 15 minutes before measurement.
Protocol 2: Establishing the Calibration Curve and Assessing the Linear Range
This protocol describes how to generate the calibration data and statistically evaluate the linear range.
Materials:
- Prepared working standard solutions (from Protocol 1)
- UV-Vis Spectrophotometer
- Cuvettes
- Computer with data plotting software (e.g., Microsoft Excel)
Procedure:
- Spectrophotometer Measurement:
- Set the spectrophotometer to the appropriate wavelength (510 nm for the iron-phenanthroline complex).
- Using a reagent blank (containing all reagents except the iron standard) in a cuvette, zero the instrument.
- Measure the absorbance of each working standard solution, ideally in triplicate, to account for minor procedural variations [22].
- Record all absorbance values.
Data Analysis and Curve Fitting:
- Calculate the average absorbance for each standard concentration.
- Plot the data with absorbance on the y-axis and concentration (µg/mL) on the x-axis [21] [22].
- Using statistical software, perform a least-squares linear regression analysis on the data to obtain the best-fit line with the equation y = mx + b, where
mis the slope andbis the y-intercept [21] [22]. - Calculate the coefficient of determination (R²) to quantify the goodness of fit. An R² value >0.999 is typically indicative of excellent linearity in analytical methods [24] [22].
Linear Range Validation:
- The linear range is the concentration interval over which the analyte response is directly proportional to its concentration [23]. Visually inspect the plot for deviations from linearity.
- The calibration curve should be linear across the entire prepared range, covering 0-150% or 50-150% of the expected analyte concentration in unknown samples [23].
- Examine the plot for a non-linear section, known as the limit of linearity (LOL), which indicates the instrument is nearing saturation at high concentrations [22]. The validated linear range for the iron-phenanthroline method is typically from the limit of quantitation up to this LOL.
Table 2: Example Data Table for Iron-Phenanthroline Calibration Curve
| Standard Solution | Iron Concentration (µg/mL) | Absorbance (Replicate 1) | Absorbance (Replicate 2) | Absorbance (Replicate 3) | Mean Absorbance | Standard Deviation |
|---|---|---|---|---|---|---|
| Blank | 0.00 | 0.000 | 0.000 | 0.000 | 0.000 | 0.000 |
| 1 | 0.50 | 0.125 | 0.127 | 0.124 | 0.125 | 0.0015 |
| 2 | 1.00 | 0.248 | 0.251 | 0.249 | 0.249 | 0.0015 |
| 3 | 2.00 | 0.501 | 0.498 | 0.503 | 0.501 | 0.0025 |
| 4 | 3.00 | 0.749 | 0.752 | 0.748 | 0.750 | 0.0020 |
| 5 | 4.00 | 0.998 | 1.002 | 0.999 | 1.000 | 0.0020 |
| 6 | 5.00 | 1.250 | 1.247 | 1.252 | 1.250 | 0.0025 |
Linear Regression Result: y = 0.250x + 0.001; R² = 0.9999
Workflow Diagram: Calibration Curve Generation and Validation
The following diagram illustrates the logical workflow for creating and validating a calibration curve, from initial preparation to final acceptance for use in sample analysis.
Discussion and Best Practices
Critical Considerations for Linear Range
- Deviations from Linearity: At high concentrations, deviations from linearity can occur due to analyte or matrix effects causing instrumental saturation, analogous to the "self-absorbance" phenomenon in Beer's law [25]. For the iron-phenanthroline complex, this could manifest as a "turning over" or plateau of the absorbance signal at high iron concentrations [25]. If the linear range is too narrow, samples may require dilution to fall within the validated range [23].
- Matrix Effects: The linear range should be confirmed in the presence of the sample matrix, as other components can interfere with the complex formation or absorbance measurement [23] [24]. For instance, in a complex sample, the calibration curve is best prepared using the blank matrix (e.g., supernatant of unloaded nanoparticles in pharmaceutical development) to ensure accuracy [24].
Troubleshooting and Method Validation
- Precision and Accuracy: To fully validate the method, assess intra-day (repeatability) and inter-day (intermediate precision) precision by measuring quality control samples at low, mid, and high concentrations within the linear range on the same day and over different days [24]. Accuracy is typically determined via recovery studies, where a known amount of analyte is spiked into the matrix, and the measured value is compared to the theoretical value [24].
- Common Pitfalls:
- Inaccurate Stock Solution: The purity of the starting material and precise weighing are paramount.
- Poor Pipetting Technique: This is a major source of error in serial dilutions. Use calibrated pipettes and change tips between each standard.
- Incorrect pH: The iron-phenanthroline complex formation is pH-dependent. Ensure the buffer is functioning correctly.
- Insufficient Color Development Time: Allow adequate time for the red-orange complex to form completely before measurement.
Adherence to the detailed protocols for stock solution preparation and linear range validation outlined in this application note is fundamental for obtaining reliable quantitative results in the spectrophotometric determination of iron using the phenanthroline complex. A rigorously constructed and validated calibration curve, characterized by a high coefficient of determination (R²) and a demonstrated linear range suitable for the intended samples, forms the bedrock of defensible analytical data. These best practices ensure method robustness, directly contributing to the integrity and success of research and development projects.
The accurate determination of iron concentration is a critical analytical procedure in environmental monitoring, clinical chemistry, and pharmaceutical quality control. Spectrophotometric methods, prized for their cost-effectiveness, simplicity, and sensitivity, are widely employed for this purpose [26]. Among these, the 1,10-phenanthroline method stands as a classical technique for iron quantification. This application note details tailored protocols for determining iron in groundwater, biological serum, and pharmaceutical samples using the phenanthroline complex, framing these methods within ongoing research to enhance their robustness, overcome analytical interference, and enable field-portable applications.
The Scientist's Toolkit: Key Research Reagent Solutions
The following table catalogues essential reagents and materials required for the spectrophotometric determination of iron.
Table 1: Essential Reagents and Materials for Iron Determination
| Reagent/Material | Function/Brief Explanation |
|---|---|
| 1,10-Phenanthroline | Primary complexing agent; forms a stable orange-red complex (ferroin) with Fe²⁺ for measurement [4] [27]. |
| Hydroxylamine Hydrochloride | Reducing agent; ensures all iron is in the ferrous (Fe²⁺) state prior to complexation [4]. |
| Sodium Acetate/Acetic Acid | Buffer system; maintains the solution at the optimal pH (~3.5-7) for complex formation [4] [2]. |
| Desferrioxamine B (DFO) | Alternative complexing agent; forms a stable 1:1 complex with Fe³⁺, allowing direct total iron measurement without pre-reduction [26]. |
| Ammonia/Sodium Hydroxide | pH adjustment; critical for overcoming oxalate interference in sequential extraction samples [4]. |
| Oxalate Solution | Key extractant in sequential extraction procedures for speciating iron oxides in sediments [4]. |
| Triethylenetetramine (Trien) | Masking agent; eliminates copper interference in the 1,10-phenanthroline method [28]. |
Application-Specific Protocols & Data
Protocol 1: Iron Determination in Groundwater
The determination of iron in groundwater is vital for assessing water quality and compliance with safety standards, such as the WHO guideline of 0.3 mg/L [15].
Detailed Protocol:
- Sample Collection: Collect groundwater samples in clean, acid-washed polyethylene bottles. Acidify to pH < 2 with high-purity hydrochloric acid for preservation if analysis is not immediate [15].
- Reagent Preparation:
- Prepare a 10% (m/v) hydroxylamine hydrochloride solution in water.
- Prepare a 0.5% (m/v) 1,10-phenanthroline solution in ethanol.
- Prepare an acetate buffer by mixing sodium acetate and acetic acid to achieve pH ~4.5.
- Sample Pretreatment: Convert all iron to the soluble ferrous form. For total iron, ensure sample digestion if particulate iron is present.
- Color Development:
- Pipette a known volume (e.g., 50 mL) of sample into a clean flask.
- Add 1 mL of hydroxylamine hydrochloride solution and mix.
- Add 5 mL of the acetate buffer and 2 mL of the 1,10-phenanthroline solution.
- Dilute to the mark in a volumetric flask and allow 10-15 minutes for full color development.
- Absorbance Measurement: Measure the absorbance of the solution at 510 nm against a reagent blank using a spectrophotometer [15].
- Quantification: Determine the iron concentration from a calibration curve prepared with iron standard solutions treated identically to the samples.
Table 2: Performance Data for Groundwater Analysis (Orthophenanthroline Method)
| Parameter | Value/Result |
|---|---|
| Linear Range | 0.2 - 10 mg/L [4] |
| Correlation Coefficient (R²) | 0.9997 [4] |
| Molar Absorptivity (ε) | ~1.3 × 10⁴ L/mol·cm [4] |
| Reported Groundwater Concentrations | 0.03 - 0.37 mg/L [15] |
Figure 1: Groundwater analysis workflow for iron determination.
Protocol 2: Iron Determination in Serum
Monitoring iron in biological fluids like serum is crucial for diagnosing medical conditions. Desferrioxamine B (DFO) offers a robust method for total iron determination.
Detailed Protocol:
- Reagent Preparation: Prepare a 0.008 M Desferrioxamine B (DFO) solution in water.
- Sample and Standard Preparation:
- For serum samples, a deproteinization step may be required.
- Prepare a series of iron standard solutions from a commercial ICP standard (e.g., 1000 mg/L).
- Complex Formation:
- Pipette a known volume of sample or standard into a 25 mL volumetric flask.
- Add 5 mL of the 0.008 M DFO solution to ensure a ligand excess.
- Add a sufficient volume of NaOH (e.g., 0.1 M) to neutralize any acid from the standard and to achieve a final pH between 6.8 and 7.1, optimal for the [FeLH]+ complex.
- Dilute to the mark with water and mix thoroughly.
- Absorbance Measurement: Measure the absorbance of the intensely red-colored complex at its maximum absorption wavelength (~430-440 nm for the DFO complex) [26].
- Quantification: Calculate the total iron concentration in the unknown sample from a calibration curve. DFO automatically complexes with Fe³⁺, and any Fe²⁺ present is oxidized and complexed, providing the total iron content directly [26].
Table 3: Performance Data for Serum Analysis (DFO Method)
| Parameter | Value/Result |
|---|---|
| Linear Range | 4.5×10⁻⁵ M - 8×10⁻⁴ M [26] |
| Applicability | Control human urine and control serum [26] |
| Key Advantage | Single-step total iron determination, no pre-reduction needed [26] |
Protocol 3: Analysis in Complex Matrices and Pharmaceutical Samples
Analysis often faces challenges like interfering ions or complex sample matrices. Research has developed specific strategies to address these.
Overcoming Oxalate Interference in Sequential Extractions: A major research advancement enables the 1,10-phenanthroline method for iron extracted by oxalate, a common reagent in sediment sequential extraction [4].
- Interference: Oxalate competes with 1,10-phenanthroline for iron, inhibiting color development.
- Solution: After oxalate extraction, adjust the solution pH to 7–9 using sodium hydroxide or concentrated ammonia. This pH adjustment effectively negates the interference, allowing the ferroin complex to form stably for up to 4 days when kept in a light-proof environment [4].
Analysis of Pharmaceutical Formulations: An indirect method was developed for theophylline based on its oxidation and reaction with the iron(II)-bathophenanthroline complex.
- Oxidation: Theophylline is oxidized with a known excess of cerium sulfate in acidic medium.
- Complex Decomposition: The remaining unreacted cerium sulfate reacts with and decomposes the red-colored iron(II)-bathophenanthroline complex.
- Measurement: The absorbance of the remaining complex is measured at 534 nm. The decrease in color intensity is directly proportional to the theophylline concentration [29].
Table 4: Advanced Method Performance in Complex Matrices
| Application/Method | Key Parameter | Value/Result |
|---|---|---|
| Oxalate-Extractable Iron [4] | Optimal pH for interference removal | 7 - 9 |
| Color stability after pH adjustment | Up to 4 days (light-proof) | |
| Theophylline via Bathophenanthroline [29] | Linear Range | 2 - 23 µg/mL |
| Molar Absorptivity (ε) | 14,809 L/mol·cm |
Figure 2: Methodologies for analyzing complex matrices and pharmaceuticals.
Emerging Research & Portable Sensing
Recent research extends these principles into developing low-cost, field-portable instrumentation. One such device is an Iron Measurement System (IMS) based on the phenanthroline method [2].
- Design: It utilizes a paired emitter detector diode (PEDD) setup with an RGB LED and a photodiode sensor to measure absorption through the ferroin complex.
- Performance: The IMS demonstrated a sensitivity of 2.5 µg/L and a linear response from 25 to 1000 µg/L, making it suitable for direct field compliance checking with regulatory limits (e.g., the EU directive of 200 µg/L) [2]. This aligns with the broader thesis goal of making robust iron quantification more accessible and adaptable beyond the traditional laboratory.
The spectrophotometric determination of iron using phenanthroline and related complexes remains a versatile and vital analytical technique. The protocols detailed herein for groundwater, serum, and complex pharmaceutical samples, supported by data on overcoming interferences and leveraging novel complexing agents, provide a practical guide for researchers. Furthermore, the ongoing evolution of this field—from fundamental chemical solutions to interference masking and portable sensor design—highlights its dynamic nature and continued relevance in modern analytical science.
Ensuring Precision and Accuracy: Troubleshooting Common Pitfalls
The spectrophotometric determination of iron utilizing the 1,10-phenanthroline complex is a foundational method in analytical chemistry, valued for its sensitivity and selectivity [30]. The formation of a stable, orange-red tris(1,10-phenanthroline)iron(II) complex, commonly known as ferroin, provides the basis for quantitative analysis [31]. The reliability of this determination, however, is profoundly dependent on the precise control of experimental conditions. The stability of the Fe(II)-phenanthroline complex, and consequently the accuracy of the spectrophotometric measurement, can be significantly influenced by parameters such as pH, temperature, and light [4].
Understanding and optimizing these critical parameters is not merely an academic exercise but a practical necessity for researchers, scientists, and drug development professionals. In contexts ranging from quality control of pharmaceutical iron supplements [18] to environmental analysis of iron species in sediments [4], failure to control these factors can introduce substantial error. This application note, framed within broader thesis research on the spectrophotometric determination of iron, provides a detailed investigation into the effects of these parameters. It offers optimized protocols and structured data to ensure the highest levels of precision and accuracy in analytical results.
Effects of Critical Parameters on Complex Stability
The stability of the Fe(II)-phenanthroline complex is a function of its chemical environment. The following sections and summarized data detail the specific effects of pH, temperature, and light, based on experimental findings.
The Critical Role of pH
The pH of the solution is arguably the most crucial parameter governing the successful formation and stability of the complex. The complexation reaction between Fe²⁺ and 1,10-phenanthroline is optimal within a specific pH window. An overly acidic environment can lead to protonation of the ligand, reducing its complexing ability, while a highly basic pH may cause hydrolysis of the ferrous ion or precipitation of iron hydroxides [30].
Recent research has specifically addressed the challenge of measuring iron in the presence of oxalate, a common extractant in sequential extraction procedures for sediments. Oxalate competes with phenanthroline for iron, potentially suppressing complex formation. This interference has been successfully overcome by adjusting the solution's pH to the 7–9 range using sodium hydroxide or ammonia, which promotes stable color development even in this competitive environment [4].
Table 1: Effect of pH on the Fe(II)-Phenanthroline Complex
| pH Range | Effect on Complex Stability | Recommendation |
|---|---|---|
| 2.9 - 3.3 [30] | Optimal range for standard complex formation in absence of competing ligands. | Use acetate buffer for precise control. |
| < 2.9 | Risk of ligand protonation; slow and incomplete complex formation. | Avoid strongly acidic conditions. |
| > 3.3 | Increased risk of Fe²⁺ oxidation and hydrolysis. | Maintain pH within recommended range. |
| 7 - 9 [4] | Essential for stable complex formation in the presence of oxalate. | Use NaOH or NH₃ for pH adjustment. |
Influence of Temperature and Light
External physical factors such as temperature and light exposure also play a significant role in the analytical outcome. While the formation of the complex is relatively robust, its long-term stability for accurate spectrophotometric measurement can be compromised if these factors are not controlled.
The complex demonstrates notable thermal stability. Studies indicate that the developed color remains stable for up to 4 days when stored in a light-proof environment at room temperature [4]. This exceptional stability allows for high-throughput sample processing without concern for rapid degradation. Direct heating of the complex is generally not required for color development and should be avoided unless specified in specialized protocols.
Exposure to light, however, is a more critical concern. The Fe(II)-phenanthroline complex is a metal-to-ligand charge transfer (MLCT) complex, where an electron is promoted from a metal-based orbital to a π* orbital on the ligand upon absorption of light [31]. This photochemical property makes the complex susceptible to degradation upon prolonged exposure. Therefore, light-proof storage, such as using amber glassware or storing samples in the dark, is mandatory for maintaining stability over time [4].
Table 2: Effects of Temperature and Light on Complex Stability
| Parameter | Condition | Effect on Complex & Recommendation |
|---|---|---|
| Temperature | Room Temperature (Light-proof) | Color stability maintained for up to 4 days [4]. |
| Light | Ambient Light Exposure | Risk of photochemical degradation; instability over time. |
| Light-Proof Storage | Essential for long-term stability; use amber vials or dark storage [4]. |
Experimental Protocol for Determination of Iron in the Presence of Oxalate
The following protocol is adapted from a recent method developed for measuring oxalate-extractable iron, which requires specific pH adjustment to overcome ligand competition [4]. This detailed procedure is designed for researchers needing to accurately quantify iron in complex matrices.
Reagents and Solutions
- Hydroxylamine Hydrochloride Solution (10% m/v): Reduces all Fe(III) to Fe(II).
- 1,10-Phenanthroline Solution (0.5% m/v): Forms the colored complex with Fe(II).
- Sodium Hydroxide or Ammonia Solution (10 mol/L and 1 mol/L): For critical pH adjustment.
- Oxalate Extraction Solution (e.g., ammonium oxalate/oxalic acid).
- Standard Iron Solutions: Prepared from ferrous ammonium sulfate or similar salt for calibration curve.
- Hydrochloric Acid (25% v/v): For sample digestion/pH adjustment.
Step-by-Step Procedure
Sample Preparation: If analyzing solid samples (e.g., sediments), perform the oxalate extraction as per sequential extraction procedures [4]. For liquid samples, ensure iron is in solution, potentially using acid digestion.
Iron Reduction: Transfer an aliquot of the sample (containing 1-5 mg/L of iron) to a volumetric flask. Add 1 mL of 10% hydroxylamine hydrochloride solution to ensure all iron is in the Fe(II) state. Mix thoroughly and allow to stand for 10 minutes.
Critical pH Adjustment: This is the key step for analyses involving oxalate. To the solution, add sodium hydroxide or concentrated ammonia dropwise while monitoring the pH. Adjust the solution to a pH between 7 and 9. This neutralizes the acidic environment and mitigates the competitive complexation by oxalate, allowing the phenanthroline to bind the iron effectively [4].
Complex Formation: Add 1 mL of 0.5% 1,10-phenanthroline solution to the pH-adjusted sample. Dilute to the mark with deionized water and mix thoroughly. Allow the solution to stand for at least 10-15 minutes to ensure complete color development.
Spectrophotometric Measurement: Measure the absorbance of the solution at 510 nm against a reagent blank [4]. The blank should contain all reagents except the iron sample and be taken through the same pH adjustment process.
Calibration and Quantification: Prepare a series of standard iron solutions (e.g., 0, 1, 2, 3, 4, 5 mg/L) following the same procedure. Construct a calibration curve of absorbance versus concentration. The relationship should be linear (e.g., Abs = 0.1934 × Con + 0.1360, R² = 0.9997) [4]. Calculate the unknown iron concentration from the calibration curve.
The Scientist's Toolkit: Key Research Reagent Solutions
A successful analysis relies on the proper function of each reagent. The table below outlines the critical reagents used in the phenanthroline method and their specific roles in the analytical procedure.
Table 3: Essential Reagents for the Phenanthroline Iron Method
| Reagent | Function / Role in the Analysis |
|---|---|
| 1,10-Phenanthroline [30] | The primary chelating ligand; forms a stable orange-red tris-complex with Fe²⁺ for spectrophotometric detection. |
| Hydroxylamine Hydrochloride [18] | A reducing agent that ensures all iron is in the ferrous (Fe²⁺) state prior to complexation, which is essential for the reaction. |
| Sodium Acetate [18] | A buffering agent used to maintain the reaction pH within the optimal range (2.9-3.3) for standard complex formation. |
| Sodium Hydroxide/Ammonia [4] | Used for critical pH adjustment to 7-9 when analyzing samples containing oxalate, to overcome competitive ligand interference. |
| Hydrochloric Acid [4] [18] | Used for sample digestion to dissolve solid samples and release iron, and for creating an initial acidic environment. |
The spectrophotometric determination of iron via the 1,10-phenanthroline method is a robust analytical technique, but its accuracy is non-negotially tied to the strict control of experimental parameters. This research has demonstrated that the stability of the critical Fe(II)-phenanthroline complex is highly dependent on pH, temperature, and light exposure. The finding that a pH of 7 to 9 is essential for reliable analysis in oxalate-rich environments provides a crucial methodological refinement for environmental and pharmaceutical scientists. By adhering to the optimized protocols and critical parameter ranges detailed in this application note—particularly the mandatory light-proof storage and precise pH control—researchers can ensure the generation of precise, reliable, and reproducible data in their iron quantification studies, thereby supporting advanced research and quality assurance in drug development and beyond.
The spectrophotometric determination of iron using the phenanthroline complex is a classic and reliable method; however, its accuracy in complex real-world samples is frequently compromised by two primary challenges: competing ions and organic solvents. Competing ions, such as Cu²⁺, Zn²⁺, and Hg²⁺, can form complexes with phenanthroline or cause its precipitation, thereby reducing the available ligand for iron complexation and leading to signal suppression or enhancement [32] [33]. Organic solvents present a different set of obstacles, potentially altering the solubility of the complex, shifting its absorption maximum, or modifying the complexation kinetics [32] [33]. These interferences are particularly problematic in the analysis of pharmaceutical substances, environmental samples, and biological fluids, where complex matrices are the norm. This article details advanced strategies and optimized protocols to mitigate these effects, ensuring reliable and precise iron quantification. The methodologies are framed within a broader research context aimed at enhancing the robustness of spectrophotometric iron determination for critical applications in drug development and quality control.
Mitigating Interference from Competing Ions
The 1,10-phenanthroline ligand, while selective for iron, is susceptible to interference from other metal cations present in the sample matrix. The table below summarizes common interfering ions and the recommended resolution strategies.
Table 1: Common Competing Ions and Resolution Strategies
| Interfering Ion | Nature of Interference | Recommended Resolution Strategy | Key Experimental Parameters |
|---|---|---|---|
| Cu²⁺ (Copper) | Forms a pale blue complex with phenanthroline, competing for the ligand [33]. | Masking with thioglycolic acid [34]. | Add 1 mL of 10% thioglycolic acid solution to the sample prior to phenanthroline addition. |
| Zn²⁺, Co²⁺, Ni²⁺ | Can form complexes with phenanthroline [32] [33]. | Use of citrate or EDTA as a masking agent [34]. | Introduce 2 mL of 5% sodium citrate solution to complex interferents without affecting iron complexation. |
| Oxidizing Agents (e.g., Ce⁴⁺) | Oxidizes the ferrous-phenanthroline complex, degrading the color [34]. | Reduction with excess hydroxylamine hydrochloride [34]. | Ensure a sufficient concentration (e.g., 1 mL of 10% solution) of hydroxylamine hydrochloride is present. |
| Various Cations | Non-specific competition or precipitation. | Pre-concentration and separation using ion-association and membrane filtration [34]. | Use a nitrocellulose membrane filter to collect the Fe(phen)₃²⁺ complex as an ion-pair with dodecyl sulfate. |
Detailed Protocol: Masking with Thioglycolic Acid for Copper Interference
This protocol is designed for the determination of iron in samples containing high levels of copper ions, such as industrial or alloy digests.
Reagents:
- Sample solution
- Hydroxylamine hydrochloride solution (10% w/v)
- Sodium acetate buffer (1 M, pH ~4.5)
- 1,10-phenanthroline solution (0.2% w/v in ethanol/water)
- Thioglycolic acid solution (10% v/v)
Procedure:
- Sample Preparation: Transfer a known volume of sample (containing up to 50 µg of Fe²⁺) to a 25 mL volumetric flask.
- Reduction: Add 1 mL of 10% hydroxylamine hydrochloride solution to ensure all iron is in the ferrous (Fe²⁺) state. Mix thoroughly and allow to stand for 5 minutes.
- pH Adjustment: Add 2 mL of sodium acetate buffer to adjust the pH to the optimal range of 3-6 for complex formation.
- Masking: Add 1 mL of 10% thioglycolic acid solution. Swirl to mix. This agent will preferentially complex with Cu²⁺ ions, preventing their interaction with phenanthroline.
- Complexation: Add 2 mL of 0.2% 1,10-phenanthroline solution.
- Dilution and Measurement: Dilute to the mark with deionized water and mix well. Allow the color to develop for 15 minutes. Measure the absorbance at 510 nm against a reagent blank [32] [34].
- Calibration: Construct a calibration curve using standard iron solutions treated identically.
Managing Interferences from Organic Solvents
The presence of organic solvents can significantly impact the spectrophotometric assay by affecting the partitioning of the hydrophobic iron-phenanthroline complex. The following workflow and table outline strategies to leverage or counteract these effects.
Figure 1: A decision workflow for selecting the appropriate analytical strategy based on the nature of the organic solvent in the sample.
Table 2: Strategies for Analysis in Organic Solvent Matrices
| Strategy | Principle | Application Context | Advantages |
|---|---|---|---|
| Hydrogel Preconcentration [32] | The organic solvent swells a hydrophobic hydrogel loaded with phenanthroline. Upon exposure to an aqueous sample, the complex forms and is concentrated within the gel. | Detection of trace Fe²⁺ in opaque or complex aqueous matrices (e.g., milk). | Removes matrix opacity; preconcentrates the analyte; lowers detection limit to 0.01 ppm. |
| Organic-Soluble Carbon Dots (CA-CDs) [33] | Fluorescent carbon dots soluble in organic media selectively quench in the presence of Fe³⁺, enabling direct detection in the solvent. | Direct detection of Fe³⁺ in various organic solvents (e.g., ethanol, ethyl acetate, dichloromethane). | No pretreatment needed; applicable to a wide range of solvents; high selectivity for Fe³⁺. |
| Solvent Exchange | The organic solvent is evaporated, and the residue is reconstituted in an aqueous buffer suitable for the standard phenanthroline method. | Simple, well-defined organic matrices where analyte loss during evaporation is minimal. | Leverages the standard protocol; no specialized materials required. |
Detailed Protocol: Hydrogel Preconcentration for Opaque Aqueous Matrices
This protocol uses a poly(acrylamide-co-AMPS) hydrogel to concentrate the iron-phenanthroline complex, effectively removing it from an interfering opaque matrix like milk [32].
Reagents and Materials:
- PAAm-co-50%AMPS hydrogel disks (synthesized as per [32])
- Bathophenanthroline (BPhen) solution (0.2% w/v in ethanol)
- Hydroxylamine hydrochloride solution (10% w/v)
- Sodium acetate buffer (1 M, pH ~4.5)
- Test sample (e.g., milk)
Procedure:
- Hydrogel Loading: Soak the dry PAAm-co-50%AMPS hydrogel disk in the bathophenanthroline/ethanol solution for 24 hours to load the ligand into the matrix. Remove and air-dry briefly.
- Sample Pretreatment: To a known volume of sample, add 1 mL of hydroxylamine hydrochloride and 2 mL of sodium acetate buffer. Mix well.
- Analyte Partitioning: Immerse the ligand-loaded hydrogel disk into the pretreated sample. Allow it to swell and react for a minimum of 1 hour. During this time, Fe²⁺ ions partition into the gel and form a red complex with bathophenanthroline.
- Measurement: Remove the hydrogel disk from the sample. The colored complex is now retained within the gel matrix. Measure the absorbance of the gel disk directly using a suitable spectrophotometer equipped with a solid sample holder, or elute the complex with a small volume of 2-methoxyethanol and measure the absorbance of the eluate at 510 nm [32] [34].
- Quantification: Compare the absorbance to a calibration curve prepared using standard iron solutions subjected to the same hydrogel partitioning process.
The Scientist's Toolkit
Table 3: Essential Reagent Solutions for Iron Determination and Interference Management
| Reagent / Material | Function / Purpose | Key Notes |
|---|---|---|
| 1,10-Phenanthroline | Primary chelating agent forming a red-colored complex with Fe²⁺ [32] [34]. | A 0.2% solution in ethanol/water is typical. Bathophenanthroline offers higher sensitivity [32]. |
| Hydroxylamine Hydrochloride | Reducing agent to convert Fe³⁺ to Fe²⁺ and eliminate interference from oxidizing agents [34]. | Critical for quantitative formation of the Fe²⁺ complex. |
| Sodium Acetate Buffer | Maintains the reaction pH between 3 and 6, optimal for complex formation and stability [34]. | Prevents hydrolysis of metal ions. |
| Thioglycolic Acid | Masking agent for Cu²⁺ and other specific interfering cations [34]. | Forms stable complexes with interferents without reacting with iron. |
| Sodium Citrate / EDTA | General masking agents for a range of divalent cations (e.g., Zn²⁺, Co²⁺) [34]. | Use judiciously as high concentrations may slightly chelate iron. |
| PAAm-co-AMPS Hydrogel | Polymeric matrix for pre-concentrating the colored complex and removing sample matrix interferences [32]. | Ideal for opaque or complex samples. |
| Organic-Soluble Carbon Dots (CA-CDs) | Fluorescent nanosensor for direct Fe³⁺ detection in organic solvents without pretreatment [33]. | Synthesized from caffeic acid; provides a modern alternative to colorimetry. |
Successfully navigating the challenges posed by competing ions and organic solvents is paramount for the accurate spectrophotometric determination of iron. The strategies outlined herein—including strategic masking, advanced preconcentration via hydrogels, and the use of organic-soluble probes—provide a robust toolkit for researchers. By selecting the appropriate protocol based on the specific sample matrix, scientists in drug development and related fields can achieve reliable iron quantification, ensuring data integrity from early research to final product quality control.
In the spectrophotometric determination of iron using the 1,10-phenanthroline complex, the reliability of your final concentration data is directly dependent on the integrity of the raw absorbance measurements. Even the most carefully prepared samples can yield erroneous results if the instrumental readings are compromised by poor technique. Cuvette handling and baseline correction are two fundamental, yet often overlooked, aspects that form the bedrock of analytical accuracy. This application note details established protocols to minimize experimental error, ensuring that your iron quantification data is both precise and accurate, which is critical for researchers and drug development professionals demanding high data integrity.
Theoretical Foundation
The Beer-Lambert Law and Measurement Integrity
The Beer-Lambert Law (A = εlc) establishes the linear relationship between absorbance (A) and the concentration (c) of an absorbing species, such as the orange-red ferroin complex formed between Fe²⁺ and 1,10-phenanthroline [35]. The validity of this law hinges on the assumption that the measured absorbance is due solely to the analyte of interest. Flaws in technique that introduce path length variability (e.g., inconsistent cuvette placement) or baseline drift (e.g., unstable light sources) directly violate this assumption, leading to inaccurate concentration calculations [36] [35].
Consequences of Poor Technique
Neglecting proper cuvette handling and baseline management manifests in predictable yet critical errors:
- Negative Absorbance Values: Occur when the transmitted light intensity through a sample is higher than through the reference (blank). This is a direct warning sign of problems, often caused by an unstable baseline, improper blanking, or inconsistent cuvette positioning [36].
- Poor Standard Curve Correlation: A low R² value in your iron calibration curve may not stem from sample preparation errors alone but from irreproducible absorbance readings due to a wobbly cuvette fit or drifting instrument baseline [36].
- Eroded Data Confidence: When systematic errors from instrumentation and handling are introduced, the trustworthiness of all collected data is called into question, potentially invalidating experimental conclusions [36].
Best Practices for Reliable Absorbance
Cuvette Handling and Positioning
The cuvette is the primary interface between your sample and the light path. Its handling is paramount.
- Secure Fit and Orientation: The cuvette must fit snugly in the holder without any wobble, as this ensures a consistent path length. A secure holder provides tactile feedback upon insertion [36]. Always place the cuvette in the same orientation, typically using the manufacturer's marker line as a guide, to account for any minor imperfections in the cuvette's optical walls [36] [37].
- Optical Cleanliness: Before measurement, meticulously clean the external optical surfaces with a soft, lint-free tissue. Any fingerprints, smudges, or droplets will scatter or absorb light, interfering with the true measurement [35] [37].
- Avoiding Contaminants: Ensure the cuvette is sufficiently flushed between sample measurements to prevent carryover contamination. Additionally, tap the cuvette gently after filling to dislodge any air bubbles, which can scatter light and cause significant reading errors [35].
Baseline Correction and Instrument Stability
A stable and well-zeroed baseline is the foundation for all subsequent absorbance readings.
- Instrument Warm-Up: Allow the spectrophotometer's light source to warm up for the manufacturer's recommended time (up to 30 minutes) to reach thermal equilibrium. Light output can drift slightly until the source is stable, directly affecting baseline stability [36].
- Proper Blank Composition: The appropriate blank must contain all the reagents used in your sample preparation except for the analyte (iron). For the phenanthroline method, this includes hydroxylamine hydrochloride, the sodium acetate-acetic acid buffer, and 1,10-phenanthroline in the same matrix as your samples [38] [39]. Using only water or PBS is often insufficient [39].
- Frequent Re-referencing: Reestablish the baseline by recording frequent dark and reference measurements throughout an analytical session. A dark spectrum (with the light path blocked) accounts for any electronic drift, while a new reference (blank) scan corrects for any subtle changes in lamp output or environmental conditions [36].
Optimizing Acquisition Parameters
Software settings are crucial for obtaining a high-fidelity signal.
- Integration Time: Set the integration time so that the peak of the reference spectrum is at 80% to 90% of the full-scale detector count. This optimizes the use of the spectrometer's dynamic range and improves the signal-to-noise ratio [36].
- Spectral Averaging: Improve signal-to-noise (S:N) by acquiring and averaging multiple scans. The S:N ratio improves with the square root of the number of averages; for example, 9 averages improve S:N by a factor of 3 [36].
- Boxcar Smoothing: Apply a boxcar averaging function to smooth spectral noise. This performs a moving average across a defined number of adjacent detector pixels. A boxcar value of 1-2 is often sufficient; setting it too high can blur sharp spectral features [36] [37].
Workflow for Absorbance Measurement
The following diagram illustrates the integrated workflow for reliable absorbance measurement, combining cuvette handling, instrument preparation, and data acquisition into a single, coherent process.
The Scientist's Toolkit: Research Reagent Solutions
The following table outlines essential materials and reagents required for the spectrophotometric determination of iron via the phenanthroline method.
| Item | Function / Rationale |
|---|---|
| 1,10-Phenanthroline | The complexing agent that reacts specifically with Fe²⁺ to form the orange-red ferroin complex, which has a high molar absorptivity for sensitive detection [38] [14]. |
| Hydroxylamine Hydrochloride | A reducing agent that converts all iron in the sample to the ferrous (Fe²⁺) state, ensuring complete complexation with 1,10-phenanthroline [38] [14]. |
| Sodium Acetate-Acetic Acid Buffer | Maintains the reaction pH between 3.2 and 3.5, which ensures rapid color development and maximum color intensity [38] [14]. |
| Matched Cuvettes (1 cm pathlength) | Cuvettes with precisely matched optical characteristics are essential for accurate measurements across samples and blanks, minimizing path length as a variable [36]. |
| Square One Cuvette Holder | A well-engineered holder designed to securely and repeatably position cuvettes in the light path, minimizing variability from placement [36]. |
Quantitative Data for Quality Control
Empirical data demonstrates the level of precision achievable with meticulous technique. The following table summarizes performance metrics for absorbance repeatability.
Table 2: Absorbance Repeatability Data with Secure Cuvette Handling [36]
| Cuvette Type | Solution | Average Absorbance at 410 nm (AU) | Standard Deviation (AU) | Key Technical Factor |
|---|---|---|---|---|
| Quartz | Diluted Green Food Dye | 0.47 | 0.0007 | 10 removal/replacement cycles |
| Plastic Disposable | Concentrated Green Food Dye | 0.47 | 0.0008 | 10 removal/replacement cycles |
Experimental Protocol: Iron Determination by 1,10-Phenanthroline
This detailed protocol for determining iron in a pharmaceutical preparation exemplifies the application of the best practices outlined above [38].
Sample Digestion and Preparation
- Weigh approximately 0.1 g of a ground tablet sample into each of three clean, dry boiling tubes.
- Add 5 mL of analytical grade nitric acid to each tube and one blank tube. Allow to stand in a fume hood overnight (10-12 hours) for pre-digestion.
- Heat the tubes on a sand bath or hot block at 135-140°C for 2-3 hours to complete the extraction.
- Cool to room temperature, dilute with 10 mL distilled water, and mix well. Filter through #1 filter paper into a 250 mL volumetric flask. Make up to the mark with distilled water.
Colored Complex Formation
- Pipette 2 mL of the sample solution into a 100 mL volumetric flask.
- Add, in sequence, with mixing:
- 5 mL of 10% (w/v) hydroxylamine hydrochloride solution.
- 5 mL of 1M sodium acetate-acetic acid buffer (pH 5.0).
- 4 mL of 0.25% (w/v) aqueous 1,10-phenanthroline solution.
- Dilute to the mark with distilled water and allow to stand for one hour for full color development before measurement.
Spectrophotometric Measurement
- Power on the UV-Vis spectrophotometer and allow it to warm up and stabilize for at least 15-30 minutes [36] [38].
- Set the instrument to scan from 400-700 nm or to take measurements at the predetermined wavelength of maximum absorbance (λmax) for the ferroin complex (approximately 510 nm).
- Rinse a clean, matched cuvette with the prepared blank solution, then fill it. Wipe the external surfaces clean with a soft tissue [36] [35].
- Place the blank cuvette in the holder in its standard orientation and perform a baseline correction [38].
- Replace the blank with a cuvette containing the 1.0 µg/mL iron standard solution. Acquire a scan or reading to confirm the λmax.
- Measure the absorbance of all calibration standards and unknown sample solutions at the chosen λmax.
Data Analysis and Calculation
- Plot a calibration curve of Absorbance versus Iron concentration (µg/mL) for the standard solutions.
- Calculate the linear regression equation (y = mx + c) and the correlation coefficient (R²).
- Determine the iron concentration in the unknown sample solutions from the regression equation.
- Report the mean iron concentration in the original sample ± the standard deviation.
Integrating rigorous cuvette handling and robust baseline correction protocols is non-negotiable for generating reliable absorbance data. When applied to the spectrophotometric determination of iron with 1,10-phenanthroline, these practices directly enhance the accuracy and precision of the resulting quantification. By controlling these fundamental variables, researchers can have greater confidence in their data, ensuring that observed results reflect true sample composition rather than experimental artifact.
In the spectrophotometric determination of iron using the 1,10-phenanthroline complex, researchers routinely assume a linear relationship between absorbance and iron concentration as per the Beer-Lambert Law [40]. However, significant deviations from linearity frequently occur at higher concentrations due to chemical, physical, and instrumental factors, compromising measurement accuracy [41] [42]. These nonlinear effects include spectral band saturation at elevated iron concentrations, light scattering in heterogeneous samples, and detector response limitations in charge-coupled device (CCD) spectrometers [41] [43].
This Application Note provides advanced data processing protocols to identify, quantify, and correct for nonlinearities, specifically within the context of iron phenanthroline complex analysis. We present a structured framework encompassing detection methods, correction algorithms, and experimental validation protocols to enhance measurement reliability for researchers and drug development professionals.
Theoretical Foundations of Nonlinearity in Spectrophotometry
In the iron phenanthroline method, nonlinearities arise from distinct origins:
- Chemical Nonlinearities: At high iron concentrations (typically >5 ppm), the iron-phenanthroline complex can exhibit absorption band saturation, deviating from the Beer-Lambert law's assumption of proportionality [41]. Molecular interactions and hydrogen bonding can also alter band positions and intensities.
- Physical Nonlinearities: Scattering effects from particulate matter or imperfect sample clarity introduce multiplicative light path variations, particularly problematic in turbid biological or pharmaceutical samples [41] [44].
- Instrumental Nonlinearities: CCD spectrometers, commonly used for rapid analysis, demonstrate signal response nonlinearity, especially at high absorbance levels where detector saturation occurs [43]. Stray light and wavelength miscalibration further contribute to nonlinear response [43].
Mathematical Framework
The standard linear calibration model is expressed as:
X = CSᵀ + E
Where X is the spectral data matrix, C represents concentrations, S contains pure component spectra, and E is the residual matrix [41].
For nonlinear systems, this model generalizes to:
X = f(C, S) + E
Where f is a nonlinear function [41]. In the case of the iron phenanthroline complex, the relationship between absorbance and concentration may follow a "soft saturation" type nonlinearity, characterized by an initial linear region that smoothly transitions into a plateau at higher concentrations [42].
Detection and Assessment of Nonlinearity
Diagnostic Protocols
Table 1: Diagnostic Techniques for Identifying Nonlinearity
| Diagnostic Method | Procedure | Interpretation of Positive Result |
|---|---|---|
| Residual Analysis | Plot residuals (observed - predicted) vs. concentration or predicted values. | Non-random, systematic pattern (e.g., U-shaped curve) indicates unmodeled nonlinearity. |
| Loading Linearity Plot | Plot weights of the first PLS factor against wavelength [42]. | Non-straight line indicates presence of nonlinear spectral effects. |
| Standard Addition Method | Spike samples with known analyte increments and plot absorbance response. | Deviation from linear response curve indicates matrix-induced nonlinear effects. |
Quantitative Assessment
Table 2: Key Parameters for Nonlinearity Assessment in Iron Determination
| Parameter | Linear Ideal | Nonlinear Indicator | Typical Range in Fe(Phen)₃²⁺ Analysis |
|---|---|---|---|
| Calibration R² | >0.998 | <0.990 | 0.970-0.999 |
| Relative Prediction Error | <2% | >5% | 1-15% |
| Linearity Slope Deviation | Constant | Changing with concentration | Varies by instrument |
| Lack-of-Fit Test (p-value) | >0.05 | <0.05 | Dependent on replication |
Advanced Correction Methodologies
Protocol 1: Extended Variable Method with Linear Modeling
This approach handles soft saturation nonlinearities by adding transformed variables to the original spectral data before applying linear factor analysis [42].
Reagents and Materials
- Prepared iron phenanthroline complex solutions across calibration range
- Spectrophotometer with CCD detector (e.g., Hamamatsu C10082CA)
- MATLAB or Python computing environment
Procedure
- Spectral Acquisition: Collect absorbance spectra (
X_original) for a set of calibration samples with known iron concentrations. - Identify Transition Point: For each wavelength
j, estimate the concentrationk_jat which the absorbance-concentration relationship deviates from linearity. This can be achieved through numerical optimization, minimizing the prediction error [42]. - Generate Extended Variables: For each absorbance value
x_ijin the original data matrix, create a corresponding transformed variablez_ijusing a truncation function:z_ij = (x_ij - k_j)+where(value)+ = max(value, 0)[42]. - Construct Augmented Matrix: Combine the original and transformed data matrices into
X_augmented = [X_original | Z]. - Apply Linear Factor Analysis: Use Iterative Target Transformation Factor Analysis (ITTFA) or Partial Least Squares (PLS) on
X_augmentedto build the calibration model [42]. - Validation: Predict concentrations in unknown samples using the augmented model.
Workflow for Extended Variable Method
Protocol 2: Kernel Partial Least Squares (K-PLS) Regression
K-PLS efficiently handles nonlinearities by mapping data into a high-dimensional feature space where relationships become linear [41].
Procedure
- Data Preprocessing: Mean-center the spectral data (
X) and concentration values (y). - Kernel Matrix Calculation: Transform the spectral data into a kernel matrix
Kusing a nonlinear kernel function. A radial basis function (RBF) kernel is often effective for spectroscopic data:K(xᵢ, xⱼ) = exp(-||xᵢ - xⱼ||² / 2σ²)whereσis the kernel width parameter. - K-PLS Algorithm: Perform PLS regression on the kernel matrix
Kinstead of the original dataX[41]. - Parameter Optimization: Use cross-validation to optimize the number of latent variables and the kernel parameter
σ. - Model Deployment: Apply the trained K-PLS model to predict iron concentrations in unknown samples.
Protocol 3: Instrument Nonlinearity Correction
This protocol specifically addresses detector-induced nonlinearity in CCD spectrometers [43].
Reagents and Materials
- Set of stable light sources or absorbance standards
- CCD spectrometer (e.g., Ocean Optics, Avantes, or Hamamatsu models)
- Integration time control software
Procedure
- Characterize Response Curve: Measure the detector response (in counts) across a range of integration times using a stable light source.
- Identify Nonlinear Region: Determine the intensity threshold at which the response deviates from linearity (typically >50,000 counts for 16-bit CCDs) [43].
- Develop Correction Function: Fit a correction function to the nonlinear response. A simple two-parameter model is:
I_corrected = I_observed / (1 + β * I_observed)whereβis a device-specific parameter [43]. - Apply Correction: Implement the correction function in the spectrometer's data processing software or post-processing routines.
- Verify Linearity: Confirm improved linearity using iron phenanthroline standards across the concentration range.
Experimental Validation and Application
Validation Protocol for Iron Phenanthroline Assay
Experimental Design
- Prepare iron standard solutions (0.5-15 ppm) in triplicate using the 1,10-phenanthroline method [45].
- Include quality control samples at low (1 ppm), medium (5 ppm), and high (10 ppm) concentrations.
- Acquire absorbance spectra from 450-600 nm using a calibrated CCD spectrometer.
Validation Metrics
- Linearity: Coefficient of determination (R²) and lack-of-fit test.
- Accuracy: Percentage recovery of known standards (target: 95-105%).
- Precision: Relative standard deviation (RSD) of replicate measurements (target: <3%).
Table 3: Research Reagent Solutions for Iron Phenanthroline Complex Analysis
| Reagent/Material | Specification | Function in Analysis | Handling Notes |
|---|---|---|---|
| 1,10-Phenanthroline | ACS reagent grade, ≥99% | Chromogenic ligand forming orange-red Fe(Phen)₃²⁺ complex | Stable at room temperature; light-sensitive [45] |
| Hydroxylamine Hydrochloride | 1-2% (w/v) aqueous solution | Reducing agent converts Fe³⁺ to Fe²⁺ | Stable at room temperature; does not require refrigeration [45] |
| Sodium Acetate Buffer | 1M, pH ~4.5 | Maintains optimal pH for complex formation | Order of addition does not affect color intensity [45] |
| Iron Standard Solution | 1000 ppm in 1% HCl | Primary calibration standard | Traceable to NIST standard reference material |
Data Analysis Workflow
Spectral Data Analysis Decision Workflow
Effective management of nonlinear effects is crucial for accurate spectrophotometric determination of iron using the 1,10-phenanthroline complex. The protocols presented herein provide researchers with a systematic approach to diagnose and correct for common nonlinearities of chemical, physical, and instrumental origin.
For mild nonlinearities, the extended variable method coupled with linear factor analysis offers an interpretable solution. For more complex cases, K-PLS regression provides robust nonlinear modeling capabilities. Additionally, specific instrument correction protocols address detector-related nonlinearities in CCD spectrometers, which are increasingly common in modern laboratories.
Implementation of these advanced spectral data processing techniques enables researchers to extend the valid dynamic range of the iron phenanthroline method, improve accuracy at higher concentrations, and generate more reliable analytical data for pharmaceutical development and research applications.
Benchmarking Performance: Validation Protocols and Comparative Analysis with ICP-MS and AAS
Method validation is a critical process in analytical chemistry that provides documented evidence a method is fit for its intended purpose. For the spectrophotometric determination of iron using the 1,10-phenanthroline complex, establishing validation metrics including Limit of Detection (LOD), Limit of Quantification (LOQ), precision, and accuracy is fundamental to generating reliable and trustworthy data. This protocol outlines detailed procedures and acceptance criteria for these key parameters within a research context, particularly for pharmaceutical and environmental applications. The formation of a red-orange ferroin complex between Fe(II) and 1,10-phenanthroline provides a highly selective and sensitive basis for this determination [46].
Core Validation Parameters and Definitions
Key Metrics Table
The following table summarizes the core validation parameters, their definitions, and typical acceptance criteria for the phenanthroline-iron method.
| Parameter | Definition | Calculation/Description | Typical Acceptance Criteria |
|---|---|---|---|
| Limit of Detection (LOD) | The lowest concentration of an analyte that can be detected. | LOD = 3.3 × σ / SWhere σ is the standard deviation of the response (blank or low concentration), S is the slope of the calibration curve [47] [48]. | Signal-to-noise ratio ≥ 3:1 [49]. |
| Limit of Quantification (LOQ) | The lowest concentration of an analyte that can be quantified with acceptable precision and accuracy. | LOQ = 10 × σ / S [47] [48]. | Signal-to-noise ratio ≥ 10:1; Precision (RSD ≤ 20%) and Accuracy (80-120%) at the LOQ level [49]. |
| Precision | The degree of agreement among individual test results under prescribed conditions. | Expressed as %RSD (Relative Standard Deviation).%RSD = (Standard Deviation / Mean) × 100 [47] [48]. | Repeatability (Intra-day): RSD < 2% [47] [48].Intermediate Precision (Inter-day): RSD < 2% [48]. |
| Accuracy | The closeness of agreement between a test result and the accepted reference value. | Determined by spiking known amounts of analyte and calculating %Recovery.%Recovery = (Measured Concentration / Known Concentration) × 100 [47]. | %Recovery of 90-110% [47] [50]. |
Experimental Protocols
Reagent Preparation and Instrumentation
Research Reagent Solutions
The following table lists the essential materials and reagents required for the spectrophotometric determination of iron.
| Reagent/Material | Specification/Purity | Function/Role in the Assay |
|---|---|---|
| 1,10-Phenanthroline | Analytical Reagent Grade | Complexing Agent: Selectively forms a red-colored, water-soluble complex with Fe(II) ions [46] [50]. |
| Hydroxylamine Hydrochloride | Analytical Reagent Grade | Reducing Agent: Reduces any Fe(III) to Fe(II) to ensure total iron is measured as the Fe(II)-phenanthroline complex [46]. |
| Sodium Acetate Buffer | pH ~ 4.5, 1M | Buffer: Maintains the reaction pH in the optimal range (3-9) for rapid and complete complex formation [46] [26]. |
| Iron Standard Solution | Certified Reference Material (e.g., 1000 mg/L from Fe(NO₃)₃ in 0.3 M HNO₃) [26] | Calibration Standard: Used to prepare a series of standard solutions for constructing the calibration curve. |
| UV-Vis Spectrophotometer | Double-beam instrument with 1 cm quartz cuvettes [51] [48] | Detection Instrument: Measures the absorbance of the Fe(II)-phenanthroline complex at its λmax of 510 nm. |
Preparation of Solutions
- 1,10-Phenanthroline (0.5% w/v): Dissolve 0.5 g of 1,10-phenanthroline monohydrate in 100 mL of deionized water [50].
- Hydroxylamine Hydrochloride (10% w/v): Dissolve 10 g of NH₂OH·HCl in 100 mL of deionized water.
- Sodium Acetate Buffer (1 M, pH ~4.5): Mix appropriate volumes of 1 M sodium acetate and 1 M acetic acid to achieve the desired pH.
- Iron Standard Stock Solution (100 mg/L): Dilute the certified iron standard appropriately with deionized water. Prepare working standards from this stock.
Procedure for Method Validation
Linearity and Calibration
- Preparation of Standards: From the iron working standard, prepare at least five standard solutions covering the expected concentration range (e.g., 0.5 - 5.0 mg/L) by serial dilution.
- Complex Development: To each standard, add 1.0 mL of hydroxylamine hydrochloride solution, 2.0 mL of phenanthroline solution, and 5.0 mL of sodium acetate buffer. Dilute to the mark with deionized water in a 50 mL volumetric flask and mix thoroughly.
- Absorbance Measurement: Allow the solutions to stand for 15 minutes for full color development. Measure the absorbance of each standard against a reagent blank at the wavelength of maximum absorption (510 nm).
- Calibration Curve: Plot the average absorbance of each standard against its concentration. Perform linear regression analysis to obtain the equation (y = mx + c) and the correlation coefficient (r² or r). A value of r² > 0.995 indicates acceptable linearity [47].
Determination of LOD and LOQ
- Approach via Calibration Curve: Prepare and analyze multiple (n=10) independent reagent blanks or a very low concentration standard.
- Calculation:
- Calculate the standard deviation (σ) of the absorbance for the blank or the predicted concentrations for the low-level standard.
- From the calibration curve, obtain the slope (S).
- Compute LOD as (3.3 × σ)/S and LOQ as (10 × σ)/S [48]. For the phenanthroline method, LOD and LOQ values of 0.5 mg L⁻¹ and 0.07-1.3 mg L⁻¹, respectively, have been reported [46] [50].
Determination of Precision
- Repeatability (Intra-day Precision): Prepare and analyze six independent samples (n=6) from a homogeneous batch at 100% of the test concentration on the same day, by the same analyst, using the same instrument.
- Intermediate Precision (Inter-day Precision): Repeat the repeatability study on a different day (inter-day) or with a different analyst (inter-analyst).
- Calculation: For each precision level, calculate the mean concentration and the %RSD. An %RSD of less than 2% is generally considered acceptable for spectrophotometric methods [47] [48].
Determination of Accuracy
- Spiked Recovery Experiment: Select a known sample matrix (or placebo for pharmaceuticals) and spike it with known quantities of the iron standard at three different levels (e.g., 80%, 100%, and 120% of the target concentration). Analyze each level in triplicate.
- Calculation: For each spike level, calculate the percentage recovery using the formula:
% Recovery = (Measured Concentration / Known Concentration) × 100The mean recovery across all levels should fall within the 90-110% range [47] [50].
Workflow and Complexation Pathway
Experimental Workflow
The following diagram illustrates the logical workflow for the sample preparation and validation process.
Iron-Phenanthroline Complexation
This diagram depicts the chemical pathway of the complex formation central to this method.
Optimized Experimental Conditions Table
For reference, the table below consolidates key parameters from published studies utilizing the phenanthroline method in various analytical contexts.
| Parameter | Reported Optimal Conditions |
|---|---|
| Wavelength (λmax) | 510 nm [46] |
| Linear Range | 1–30 mg L⁻¹ [46], 0.07–1.00 & 1.00–7.00 mg/dm³ (DID system) [50] |
| Reported LOD/LOQ | LOD: 0.5 mg L⁻¹ [46], LOQ: 0.07 mg/dm³ [50], LOQ: 1.3 ppm (for Ascorbic Acid) [47] |
| Reported Precision (%RSD) | 2% (n=10) [46], 9.6-14.8% (for lower conc. in DID) [50], < 2% [48] |
| Reported Accuracy (%Recovery) | 95.8–104.5% [50], 103.5% [47] |
| Reaction Time | 70 s (automated flow system) [50], 15 min (manual, batch) [46] |
| pH Range | 3.5 - 8.0 (for DFO complex, analogous stable range) [26] |
The accurate determination of iron concentration is a critical requirement across numerous scientific and industrial fields, including environmental monitoring, pharmaceutical development, and materials science. Researchers and analysts must select from a range of established analytical techniques, each with distinct advantages and limitations. This application note provides a detailed comparative analysis of three prominent methods: the classical 1,10-phenanthroline spectrophotometric method, Flame Atomic Absorption Spectrometry (FAAS), and Inductively Coupled Plasma Mass Spectrometry (ICP-MS). Framed within the context of ongoing research into spectrophotometric iron determination using phenanthroline complexes, this work provides comprehensive experimental protocols, performance data, and application guidance to support method selection for specific analytical needs. The comparison focuses on key parameters including detection limits, precision, analytical range, operational requirements, and cost-effectiveness, with particular emphasis on iron speciation capabilities that are often crucial in pharmaceutical and environmental research.
The 1,10-phenanthroline method is a classical spectrophotometric technique based on the formation of an orange-red complex between ferrous iron (Fe²⁺) and 1,10-phenanthroline reagents, with absorbance measured at approximately 510 nm [14] [52]. This method allows for the specific determination of Fe²⁺, or total iron after reduction of Fe³⁺, and is particularly valued for its iron speciation capabilities [52].
Flame Atomic Absorption Spectroscopy (FAAS) operates on the principle of ground-state atoms absorbing light at characteristic wavelengths. Liquid samples are nebulized and introduced into a flame (typically air/acetylene), where atoms are liberated from their molecular bonds. A hollow cathode lamp emits element-specific light, which is absorbed by the analyte atoms in proportion to their concentration [53].
Inductively Coupled Plasma Mass Spectrometry (ICP-MS) utilizes a high-temperature argon plasma (6000-8000 K) to atomize and ionize sample constituents. The resulting ions are then separated based on their mass-to-charge ratio in a mass spectrometer and detected, providing exceptional sensitivity and multi-element capability [53] [54].
Table 1: Fundamental Characteristics of Analytical Techniques for Iron Determination
| Parameter | 1,10-Phenanthroline Method | Flame AAS | ICP-MS |
|---|---|---|---|
| Principle | Molecular absorption of Fe(II)-phenanthroline complex | Atomic absorption of ground-state atoms | Ionization in plasma with mass separation |
| Primary Application | Iron speciation studies, water analysis | Single-element quantification in various matrices | Ultra-trace multi-element analysis |
| Detection Mechanism | Visible light absorption at ~510 nm | Light absorption by atoms | Ion counting by mass-to-charge ratio |
| Sample Form | Aqueous solutions | Aqueous solutions after digestion | Aqueous solutions after dilution/digestion |
| Iron Speciation Capability | Yes (via selective complexation) | No (total element only) | Limited (requires coupling to separation techniques) |
Performance Comparison and Analytical Data
Direct comparison studies demonstrate that while all three techniques can reliably detect iron, their analytical performance characteristics differ significantly. Research comparing spectrophotometry, FAAS, and ICP-OES (a technique similar to ICP-MS in sensitivity) for determining trace iron in solar glass found differences in detection limits, accuracy, and precision, though all methods were applicable [55]. Another recent study comparing spectrophotometric methods with FAAS and ICP-MS for determining iron in acid cleaning and passivating stainless steel solutions found results were in satisfactory agreement with differences less than 5.0% [56].
Sensitivity and Detection Limits: ICP-MS provides the lowest detection limits, capable of measuring iron concentrations in the parts-per-trillion (ppt) range, making it indispensable for ultra-trace analysis [53] [54]. FAAS typically offers detection limits in the parts-per-million (ppm) range for flame operation, extending to parts-per-billion (ppb) with graphite furnace instrumentation [53]. The phenanthroline method generally achieves detection limits around 10 μg/L (ppb) with a 5 cm pathlength cell, suitable for most environmental and industrial applications where trace-level rather than ultra-trace analysis is required [14].
Precision and Accuracy: The phenanthroline method demonstrates good precision, with one study reporting a relative standard deviation of 25.5% at 300 μg/L concentration across multiple laboratories [14]. FAAS and ICP-MS typically offer better precision (often 1-5% RSD) due to their instrumental nature and reduced susceptibility to chemical interferences [53]. A comparative study showed that results from the phenanthroline method, FAAS, and ICP-MS were in satisfactory agreement with less than 5% difference for iron determination in stainless steel solutions [56].
Analytical Range: ICP-MS provides the widest dynamic range, capable of measuring from sub-ppb to hundreds of ppm concentrations [53]. FAAS has a more limited linear range, typically covering about two orders of magnitude [53]. The phenanthroline method follows Beer's Law and provides a linear response generally from approximately 25-1000 μg/L, extendable with dilution or pathlength adjustment [19].
Table 2: Quantitative Performance Comparison for Iron Determination
| Performance Metric | 1,10-Phenanthroline Method | Flame AAS | ICP-MS |
|---|---|---|---|
| Typical Detection Limit | 10 μg/L [14] | Few hundred ppb [53] | Few ppt [53] |
| Working Range | 25-1000 μg/L (extendable) [19] | ~ppb to ~ppm [53] | ppq to hundreds ppm [53] |
| Precision (RSD) | 25.5% at 300 μg/L [14] | 1-2% [53] | 1-3% [53] |
| Multi-element Capability | No | Limited (sequential) | Yes (simultaneous) |
| Sample Throughput | Moderate | High (with autosampler) | Very high (with autosampler) |
Detailed Experimental Protocols
1,10-Phenanthroline Method for Iron Determination
Principle: Iron is brought into solution, reduced to the ferrous state by boiling with acid and hydroxylamine, and treated with 1,10-phenanthroline at pH 3.2-3.3. Three molecules of phenanthroline chelate each atom of ferrous iron to form an orange-red complex that obeys Beer's Law, with color intensity independent of pH from 3 to 9 [14].
Reagents and Solutions:
- Hydroxylamine Hydrochloride Solution (10% w/v): Dissolve 10 g of hydroxylamine hydrochloride in 100 mL of reagent water. Prepare fresh weekly.
- 1,10-Phenanthroline Solution (0.5% w/v): Dissolve 0.5 g of 1,10-phenanthroline monohydrate in 100 mL of reagent water. Heat slightly if necessary to dissolve.
- Sodium Acetate Solution (50% w/v): Dissolve 500 g of sodium acetate trihydrate in 600 mL of reagent water. Dilute to 1 L.
- Iron Stock Solution (100 mg/L): Dissolve 0.7022 g of ferrous ammonium sulfate hexahydrate [Fe(NH₄)₂(SO₄)₂·6H₂O] in 50 mL of reagent water containing 1 mL of concentrated sulfuric acid. Dilute to 1 L with reagent water.
- Working Standard Solutions: Prepare by appropriate dilution of stock solution to cover concentration range of 0.1-2.0 mg/L.
Procedure:
- Sample Preparation: For total iron, ensure all iron is in solution. For suspended iron, homogenize sample and take representative portion. For dissolved iron, filter through 0.45-μm membrane filter immediately after collection [14].
- Digestion (if necessary): If noticeable amounts of color or organic matter are present, evaporate sample, gently ash residue, and redissolve in acid [14].
- Reduction Step: To 50 mL of sample or appropriate aliquot containing less than 200 μg iron, add 1 mL of hydroxylamine solution and 1 mL of hydrochloric acid (1:1). Boil until volume is reduced to 15-20 mL [14].
- pH Adjustment: Cool to room temperature and add 1 mL of phenanthroline solution. Add sodium acetate solution dropwise until pH is between 3.2 and 3.5 (pH paper or meter) [14]. For samples containing oxalate, recent research demonstrates that adjusting pH to 7-9 with sodium hydroxide or ammonia enables successful complexation despite competing ligands [4].
- Dilution and Mixing: Transfer to 100-mL volumetric flask, dilute to mark with reagent water, and mix thoroughly.
- Color Development and Measurement: Allow 10-15 minutes for full color development. Measure absorbance at 510 nm against reagent blank [14]. For portable applications, a custom instrument with RGB LED source and photodiode detector has been developed with sensitivity of 2.5 μg/L and linear range of 25-1000 μg/L [19].
- Calibration: Prepare calibration standards covering concentration range of 0.1-2.0 mg/L following same procedure. Plot absorbance versus concentration.
Interference Management:
- Strong oxidizing agents: Add excess hydroxylamine hydrochloride
- Cyanide, nitrite: Remove by initial boiling with acid
- Phosphates: Convert polyphosphates to orthophosphate by boiling with acid
- Copper, cobalt, nickel, zinc: Add excess phenanthroline; if excessive, use extraction method
- Color or organic matter: Evaporate, ash, and redissolve or digest before analysis [14]
FAAS Protocol for Iron Determination
Instrument Parameters:
- Wavelength: 248.3 nm (primary) or 372.0 nm (secondary)
- Slit Width: 0.2 nm
- Lamp: Iron hollow cathode lamp or electrodes discharge lamp
- Flame: Air-acetylene (oxidizing)
- Detection Limit: Approximately 0.1 mg/L [53]
Procedure:
- Sample Preparation: Ensure samples are in aqueous acidic medium (typically 1-2% nitric acid). Filter if necessary to remove particulates that could clog nebulizer.
- Calibration: Prepare standards in same acid matrix as samples, covering concentration range of 0.5-10 mg/L.
- Instrument Optimization: Align lamp, optimize burner height and fuel flow for maximum absorbance.
- Analysis: Aspirate standards and samples, measuring absorbance. Use three replicate readings for each solution.
- Quality Control: Include method blanks, duplicates, and certified reference materials.
ICP-MS Protocol for Iron Determination
Instrument Parameters:
- Isotope: ⁵⁶Fe (primary) or ⁵⁷Fe (secondary)
- RF Power: 1.5 kW
- Plasma Gas Flow: 15 L/min argon
- Auxiliary Gas Flow: 0.9 L/min argon
- Nebulizer Flow: 0.95 L/min argon
- Sampling Depth: 8-10 mm
- Detection Limit: <0.1 μg/L [53] [54]
Procedure:
- Sample Preparation: Dilute samples to appropriate concentration in 1-2% high-purity nitric acid. Total dissolved solids should be <0.2%.
- Calibration: Prepare multi-element standards covering expected concentration range. Include internal standards (e.g., Sc, Ge, Rh, Bi) to correct for matrix effects and instrumental drift.
- Instrument Tuning: Optimize lens settings, gas flows, and detector voltage using tuning solution to maximize sensitivity and minimize oxides (CeO/Ce < 2%).
- Analysis: Introduce samples via peristaltic pump and autosampler. Use quantitative analysis mode with three replicates.
- Interference Correction: Apply mathematical corrections for isobaric interferences and polyatomic ions.
Application Scenarios and Method Selection
The choice between phenanthroline method, FAAS, and ICP-MS depends on analytical requirements, sample characteristics, and available resources. The following workflow diagram illustrates the method selection process:
Phenanthroline Method Applications:
- Water Quality Monitoring: Ideal for compliance testing with regulatory limits (e.g., EU Drinking Water Directive limit of 200 μg/L) [19]. Portable versions enable field testing with sensitivity of 2.5 μg/L [19].
- Iron Speciation Studies: Capable of distinguishing Fe²⁺ and Fe³⁺ forms using sequential complexation at different wavelengths (396 nm for Fe³⁺ and 512 nm for Fe²⁺) [52]. Tandem systems with FAAS allow simultaneous determination of ionic forms and acid-leachable iron [52].
- Environmental Research: Effectively measures oxalate-extractable iron in sediments after pH adjustment to 7-9 to overcome competing complexation [4].
- Industrial Process Control: Suitable for monitoring iron in acid cleaning, pickling, and passivating solutions where concentrations are typically higher [56].
FAAS Applications:
- Clinical Analysis: Determination of iron in biological samples (blood, serum) where concentrations are in mg/L range.
- Food and Beverage Testing: Quality control for iron content in fortified foods and beverages.
- Metallurgical Analysis: Measurement of iron in alloys and metal products.
ICP-MS Applications:
- Ultra-trace Analysis: Determination of iron at sub-μg/L levels in high-purity water and pharmaceuticals.
- Multi-element Surveys: Simultaneous determination of iron alongside other elements in environmental and biological samples.
- Isotope Ratio Studies: Iron isotope ratio measurements for geochemical and metabolic tracing studies.
Research Reagent Solutions
Table 3: Essential Reagents and Materials for Iron Determination Methods
| Reagent/Material | Function/Purpose | Application in |
|---|---|---|
| 1,10-Phenanthroline | Forms orange-red complex with Fe²⁺ for spectrophotometric detection | Phenanthroline method |
| Hydroxylamine Hydrochloride | Reduces Fe³⁺ to Fe²⁺ prior to complexation | Phenanthroline method |
| Sodium Acetate | pH adjustment to optimal range (3.2-3.5) for complex formation | Phenanthroline method |
| Hollow Cathode Lamps | Element-specific light source for atomic absorption | FAAS |
| High-Purity Gases | Argon for plasma generation; Acetylene for flame | ICP-MS, FAAS |
| Certified Reference Materials | Quality control and method validation | All methods |
The 1,10-phenanthroline method remains a robust, cost-effective technique for iron determination, particularly valuable when iron speciation information is required, budget constraints exist, or field-based analysis is necessary. While FAAS provides better precision and higher throughput for total iron analysis, and ICP-MS offers superior sensitivity and multi-element capability, the phenanthroline method maintains significant relevance in both research and industrial applications. Recent advancements, including portable instrumentation and modified protocols for challenging matrices like oxalate extracts, continue to extend its applicability. Method selection should be guided by required detection limits, need for speciation information, sample throughput requirements, available instrumentation, and budgetary considerations, with the understanding that these techniques often provide complementary rather than competing information for comprehensive iron analysis.
The spectrophotometric determination of iron using the 1,10-phenanthroline complex is a well-established and reliable method for quantifying iron concentrations in various aqueous matrices, including drinking, mineral, and environmental waters [19] [57] [58]. The method is based on the reduction of all iron to the ferrous (Fe²⁺) state, followed by reaction with 1,10-phenanthroline to form an orange-red ferroin complex, which can be quantified by its absorbance in the visible region [19].
In analytical chemistry, demonstrating that a new or optimized method produces results that are in statistical agreement with established reference methods is paramount. This application note details the use of t-tests and F-tests to validate the performance of a portable photometric device employing the phenanthroline method against standard laboratory techniques, specifically Inductively Coupled Plasma Mass Spectrometry (ICP-MS). The framework provided is essential for researchers and scientists in drug development and environmental testing who require robust, statistically sound analytical data.
Key Principles of the Phenanthroline-Iron Method
The core reaction involves the complexation of Fe²⁺ ions with three 1,10-phenanthroline molecules to form the ferroin complex, which exhibits maximum absorbance between 510 nm and 550 nm [19]. The intensity of the color produced is directly proportional to the iron concentration, obeying the Beer-Lambert law.
Key advantages of this method include:
- High Selectivity: 1,10-phenanthroline is highly specific for Fe²⁺ ions.
- Excellent Sensitivity: The molar absorptivity of the complex is high, allowing for the determination of very low iron concentrations, down to microgram-per-liter (µg/L or ppb) levels [58].
- Color Stability: The formed complex is stable, allowing for reliable measurements [19].
Experimental Protocol
Reagents and Materials
- 1,10-Phenanthroline Solution: The primary complexing agent for Fe²⁺ [19] [57].
- Hydroxylamine Hydrochloride: Reduces Fe³⁺ to Fe²⁺, ensuring all iron is in the reactive ferrous state [19].
- Acetic Acid and Sodium Acetate: Used to buffer the solution to an optimal pH (~3.5-4.5) for complex formation [19].
- Iron Standard Solutions: Prepared from certified stock solutions for calibration.
- Sample Cuvettes: With a standard path length (e.g., 10 mm or 100 mm) for absorbance measurement [19] [58].
- Spectrophotometer or Photometric Device: For absorbance measurement.
The Scientist's Toolkit: Essential Research Reagents
Table 1: Key reagents for the spectrophotometric determination of iron.
| Reagent/Material | Function/Explanation |
|---|---|
| 1,10-Phenanthroline | The chromogenic agent; specifically chelates with Fe²⁺ to form the orange-red ferroin complex. |
| Hydroxylamine Hydrochloride | A reducing agent that converts all iron in the sample to the Fe²⁺ state prior to complexation. |
| Acetate Buffer | Maintains the reaction medium at an optimal acidic pH (approx. 4) for rapid and complete complex formation. |
| Solid Reagent Formulations | "Ready-to-use" powdered mixtures (e.g., Spectroquant tests) that integrate all necessary reagents, optimizing field deployment [19] [58]. |
Detailed Procedure
Sample Preparation: Collect water samples in clean containers. If immediate analysis is not possible, acidify samples with nitric acid to stabilize the iron and prevent precipitation [58]. For samples containing carbonic acid, degas in an ultrasonic bath.
Reduction and Complexation: a. To a known volume of sample (e.g., 10 mL), add 1 mL of hydroxylamine hydrochloride solution and mix. b. Add 1 mL of 1,10-phenanthroline solution. c. Add 2 mL of a sodium acetate-acetic acid buffer solution to adjust the pH. Alternatively, use a commercial solid reagent that incorporates all necessary chemicals for a streamlined process [19] [58]. d. Dilute to the mark in a volumetric flask (e.g., 25 mL or 50 mL) with deionized water and allow the color to develop for at least 10-15 minutes.
Absorbance Measurement: a. Zero (blank) the spectrophotometer using a prepared reagent blank. b. Measure the absorbance of the standards and samples at 510 nm. c. For portable devices, follow the manufacturer's protocol, which may involve direct measurement in a dedicated cuvette housed within the device [19].
Workflow for Method Comparison and Statistical Evaluation
The following workflow outlines the key steps for comparing a test method (e.g., a portable photometer) against a reference method and performing the requisite statistical tests.
Data Presentation and Statistical Analysis
Example Data Set from a Comparative Study
The following table presents simulated data from a comparative study, where iron concentrations in various water samples were determined using both a portable photometer (test method) and ICP-MS (reference method). This data will be used for the subsequent statistical calculations.
Table 2: Example data for iron concentration (µg/L) measured by a test method (portable photometer) and a reference method (ICP-MS).
| Sample ID | Test Method (µg/L) | Reference Method (ICP-MS, µg/L) | Difference (dᵢ) |
|---|---|---|---|
| 1 | 28.5 | 27.1 | 1.4 |
| 2 | 155.2 | 158.0 | -2.8 |
| 3 | 48.8 | 49.5 | -0.7 |
| 4 | 12.1 | 11.5 | 0.6 |
| 5 | 95.7 | 96.8 | -1.1 |
| 6 | 201.5 | 199.2 | 2.3 |
| 7 | 63.4 | 64.1 | -0.7 |
| 8 | 78.9 | 80.2 | -1.3 |
Statistical Evaluation Procedure
F-test for Comparison of Variances
The F-test assesses whether the precisions (variances) of the two methods are statistically equivalent.
Calculate Variances: Compute the variance (s²) for each method's results.
- Variance of Test Method (s_test²) = 3456.2
- Variance of Reference Method (s_ref²) = 3521.8
Compute F-statistic:
- F = stest² / sref² = 3456.2 / 3521.8 ≈ 0.98
Compare to Critical F-value: The critical F-value (F_crit) for a two-tailed test with 7 degrees of freedom for both numerator and denominator at α=0.05 is approximately 4.99.
- Since F (0.98) < F_crit (4.99), there is no significant difference in the variances of the two methods.
t-test for Comparison of Means (Paired t-test)
A paired t-test is used because the same samples are measured by both methods. It determines if there is a significant difference between the mean results.
Calculate the Mean Difference (đ):
- đ = Σdᵢ / n = (1.4 - 2.8 - 0.7 + 0.6 - 1.1 + 2.3 - 0.7 - 1.3) / 8 = -0.29 µg/L
Calculate the Standard Deviation of the Differences (s_d):
- s_d = 1.64 µg/L
Compute t-statistic:
- t = |đ| / (s_d / √n) = | -0.29 | / (1.64 / √8) ≈ 0.50
Compare to Critical t-value: The critical t-value (t_crit) for 7 degrees of freedom at α=0.05 is 2.365.
- Since t (0.50) < t_crit (2.365), the null hypothesis is not rejected. There is no evidence of a systematic bias between the two methods.
Table 3: Summary of statistical parameters for the method comparison.
| Statistical Parameter | Value | Conclusion |
|---|---|---|
| F-test | F-statistic = 0.98 | Variances are not significantly different (p > 0.05). |
| t-test | t-statistic = 0.50 | Means are not significantly different (p > 0.05). |
| Average Recovery | 99.7% | Further confirms the accuracy of the test method. |
The high recovery rates and the absence of significant statistical differences in both variance (F-test) and mean (t-test) demonstrate that the portable photometer provides results that are in excellent agreement with the reference ICP-MS method [58].
Visualization of the Statistical Decision Pathway
The logic of the statistical evaluation can be summarized in the following decision pathway, which integrates the F-test and t-test outcomes to reach a final conclusion regarding method agreement.
Discussion
The statistical evaluation using t-tests and F-tests provides a rigorous and standardized framework for validating analytical methods. In the context of the phenanthroline-based iron determination, this protocol confirms that modern portable photometers can achieve performance comparable to sophisticated laboratory instruments like ICP-MS for a wide range of iron concentrations [19] [58]. The high recovery rates (e.g., 89% to 106% as reported in comparative studies) further substantiate the accuracy and reliability of the method [58].
This validation is crucial for:
- Environmental Monitoring: Enabling reliable on-site testing of water bodies for compliance with regulatory limits (e.g., EU directive of 200 µg/L, U.S. EPA limit of 300 µg/L) [19] [58].
- Drug Development: Ensuring the purity of water used in pharmaceutical processes, where trace metals can catalyze degradation reactions.
- General Research: Providing scientists with a confident and statistically grounded tool for iron quantification.
By adhering to this protocol, researchers can generate defensible data, ensuring that their findings related to iron concentration are both accurate and precise.
Iron oxides and hydroxides (hereafter referred to as iron oxides) are crucial components in aquatic sediments, playing a pivotal role in the biogeochemical cycling of nutrients and pollutants. Their high specific surface area, active redox chemistry, and strong electron transfer ability make them effective in removing heavy metals, inorganic pollutants like phosphate, and organic compounds through adsorption and co-precipitation processes [4]. The reactivity of these iron minerals with pollutants varies significantly depending on their specific type and crystallinity; for instance, ferrihydrite can adsorb 32% more phosphate than goethite at pH 7 due to its much greater specific surface area [4]. Therefore, understanding the mineral types and their relative abundance, rather than just the total iron content, is essential for accurate evaluation of iron's environmental functions in sediment systems.
Sequential extraction procedures are widely recognized as effective methods for separating iron from different mineral pools in sediments [4]. These procedures apply specific extractants such as acetic acid, hydroxylamine hydrochloride, sodium dithionite, and oxalate to differentiate among carbonate-associated iron, easily reducible iron oxides, reducible iron oxides, and magnetite [4]. The oxalate extraction step specifically targets certain iron (hydr)oxides by dissolving minerals through complexation rather than reduction or protonation [4]. However, the subsequent quantification of dissolved iron in the oxalate extract presents analytical challenges due to interference from the oxalate itself when using common spectrophotometric methods.
The Analytical Challenge: Oxalate Interference with Conventional Phenanthroline Method
The 1,10-phenanthroline method is a well-established spectrophotometric technique for iron determination, known for its simplicity, cost-effectiveness, and short preparation time [4]. This method relies on the formation of a stable orange-red complex between 1,10-phenanthroline and ferrous iron (Fe²⁺), which produces a stable absorbance at a wavelength of 510 nm [4]. The method is applicable to both Fe(II) and Fe(III) when combined with a reducing agent like hydroxylamine hydrochloride.
However, when applied to oxalate extracts from sequential extraction procedures, a significant interference problem emerges. Oxalate acts as a competing complexing agent with 1,10-phenanthroline for iron, effectively preventing the formation of the Fe(II)-phenanthroline complex necessary for spectrophotometric detection [4]. This interference has traditionally necessitated complex pre-treatment steps such as microwave digestion to eliminate excess oxalate before iron analysis, making the process time-consuming, labor-intensive, and expensive [4].
Novel Methodology: Overcoming Oxalate Interference
Principle of the New Approach
Recent research has developed a novel pre-processing method that successfully enables the measurement of iron in oxalate extracts using the 1,10-phenanthroline colorimetric method with high accuracy and precision [4]. The key innovation involves addressing the interference caused by oxalate by adjusting the pH of the solution to optimize color formation during measurement [4].
The method specifically involves adjusting the solution's pH to 7-9 using sodium hydroxide or concentrated ammonia after the oxalate extraction [4]. This pH adjustment is crucial as it enables stable complexation between iron and 1,10-phenanthroline while minimizing the competing complexation by oxalate. Under these optimized conditions, the color development remains stable for up to 4 days when stored in a light-proof environment [4].
Research Reagent Solutions
Table 1: Essential Research Reagents for Oxalate-Extractable Iron Determination
| Reagent | Concentration/Preparation | Function in Protocol |
|---|---|---|
| Ammonium Oxalate | 0.2 M solution (pH 3.0) | Extraction reagent that selectively dissolves certain iron (hydr)oxides through complexation [4] |
| Hydroxylamine Hydrochloride | 10% (m/v) solution | Reducing agent that ensures complete reduction of Fe³⁺ to Fe²⁺ prior to complexation with phenanthroline [4] |
| 1,10-Phenanthroline | 0.5% (m/v) solution | Colorimetric reagent that forms stable orange-red complex with Fe²⁺ for spectrophotometric detection [4] |
| Sodium Hydroxide or Ammonia | 10 mol/L and 1 mol/L solutions | pH adjustment reagents to bring solution to optimal pH 7-9 for color development despite oxalate interference [4] |
| Hydrochloric Acid | 25% (v/v) solution | Creates acidic environment for sample preparation and pH adjustment [4] |
Experimental Workflow
The following diagram illustrates the complete workflow for the determination of oxalate-extractable iron in sediment samples using the novel pH-adjusted phenanthroline method:
Application in Sediment Research: Method Validation and Performance
Analytical Performance Metrics
The novel pH-adjusted phenanthroline method for oxalate-extractable iron determination has been rigorously validated, demonstrating excellent analytical performance as summarized in the table below:
Table 2: Analytical Performance of the Novel Phenanthroline Method for Oxalate-Extractable Iron
| Parameter | Performance Value | Experimental Conditions |
|---|---|---|
| Linear Range | 1-5 mg/L (optimal) | Abs = 0.1934 × Con + 0.1360 (R² = 0.9997) [4] |
| Extended Linear Range | 0.2-10 mg/L | Abs = 0.18073 × Con + 0.16154 (R² = 0.9979) [4] |
| Molar Absorptivity (ε) | ~1.3 × 10⁴ L/mol/cm | Calculated from standard curve [4] |
| Color Stability | Up to 4 days | When stored in light-proof environment [4] |
| Optimal pH Range | 7-9 | Critical for overcoming oxalate interference [4] |
| Precision | High | Demonstrated by strong linearity and minimal error accumulation [4] |
Detailed Experimental Protocol
Reagent Preparation
- Ammonium Oxalate Extractant (0.2 M): Prepare by dissolving 14.21 g of ammonium oxalate in 500 mL of deionized water. Adjust to pH 3.0 using hydrochloric acid [4].
- Hydroxylamine Hydrochloride Solution (10% m/v): Dissolve 10 g of hydroxylamine hydrochloride in 100 mL of deionized water. This solution is stable at room temperature and does not require refrigeration [4] [45].
- 1,10-Phenanthroline Solution (0.5% m/v): Dissolve 0.5 g of 1,10-phenanthroline in 100 mL of deionized water. Gentle heating may be required to facilitate dissolution.
- Sodium Hydroxide Solutions: Prepare 10 mol/L and 1 mol/L solutions for pH adjustment. Alternatively, concentrated ammonia can be used.
- Hydrochloric Acid (25% v/v): Carefully add 250 mL of concentrated HCl to 750 mL of deionized water.
Sample Processing and Extraction
- Oxalate Extraction: Weigh 0.1-0.5 g of sediment sample (depending on expected iron content) into a 50 mL centrifuge tube. Add 25 mL of 0.2 M ammonium oxalate solution (pH 3.0). Shake the mixture for 2-4 hours in the dark [4].
- Phase Separation: Centrifuge the extraction mixture at 4000 rpm for 10 minutes. Carefully collect the supernatant for analysis. Alternatively, filtration through a 0.45 μm membrane filter can be used.
Spectrophotometric Determination
- pH Adjustment: Transfer 1-5 mL of the oxalate extract to a 25 mL volumetric flask. Adjust the pH to 7-9 using sodium hydroxide or ammonia solution. This step is critical for overcoming oxalate interference [4].
- Reduction: Add 1 mL of 10% hydroxylamine hydrochloride solution to ensure all iron is reduced to Fe²⁺. Mix thoroughly and wait 2-5 minutes for complete reduction.
- Complexation: Add 2 mL of 0.5% 1,10-phenanthroline solution. The solution should develop an orange-red color indicating Fe(phen)₃²⁺ complex formation.
- Dilution and Incubation: Make up to volume with deionized water, mix thoroughly, and allow 10-15 minutes for full color development.
- Measurement: Measure the absorbance at 510 nm against a reagent blank prepared similarly but without sediment sample.
- Quantification: Determine iron concentration using the pre-established calibration curve.
Significance in Environmental Research Context
The ability to accurately quantify oxalate-extractable iron in sediments has significant implications for understanding environmental processes. Iron oxides play crucial roles in pollutant dynamics in aquatic systems, serving as key sinks for heavy metals and nutrients like phosphorus [4] [59]. The specific iron phases targeted by oxalate extraction (including ferrihydrite and other short-range-order iron oxides) are particularly reactive and important for nutrient cycling and contaminant immobilization.
In lake sediment studies, such as research on iron-treated peat lakes, the quantification of reactive iron pools helps explain phosphorus retention and release mechanisms [59]. These easily reducible iron(III) phases associated with organic matter can effectively bind phosphorus but may readily release it when bottom waters turn hypoxic [59]. The novel phenanthroline method provides a cost-effective and accessible approach for monitoring these environmentally significant iron fractions without requiring sophisticated instrumentation like ICP-OES or ICP-MS.
The method is particularly valuable for large-scale monitoring programs and resource-limited laboratories, making important environmental iron speciation studies more accessible to broader research communities. With approximately 55% of iron sequential extraction studies in sediments utilizing oxalate as an extractant [4], this methodological advancement has the potential to impact a significant segment of environmental geochemistry research.
Troubleshooting and Method Optimization
- Poor Color Development: Ensure precise pH adjustment to 7-9 range. Verify the freshness of 1,10-phenanthroline solution.
- Precipitation Issues: If precipitation occurs after pH adjustment, slightly dilute the sample or add reagents sequentially with thorough mixing.
- Matrix Effects: For organic-rich sediments, additional dilution may be necessary to minimize matrix interference.
- Calibration Linearity: Prepare fresh standard solutions regularly and verify linearity with each analytical batch. For higher iron concentrations (>5 mg/L), appropriate dilution is recommended to maintain linear response [4].
The novel pH-adjusted phenanthroline method represents a significant advancement in the spectrophotometric determination of oxalate-extractable iron, combining the reliability of traditional methods with practical solutions to overcome previous limitations in sediment analysis.
Conclusion
The 1,10-phenanthroline method remains a robust, cost-effective, and highly accessible technique for iron determination, as evidenced by its successful application across environmental, pharmaceutical, and clinical samples. Recent methodological innovations, particularly in managing complexing interferents like oxalate through pH control, have significantly expanded its utility. When properly optimized and validated, this spectrophotometric method demonstrates excellent agreement with more sophisticated and expensive techniques like ICP-MS and AAS. For biomedical research, the future lies in further miniaturization and automation of this protocol for high-throughput clinical serum analysis, development of even more selective ligands to reduce sample pre-treatment, and its integration as a reliable detection module in lab-on-a-chip diagnostic platforms. Its continued refinement ensures it will remain an indispensable tool for drug development and clinical diagnostics.
References
- 1. Ferroin [https://en.wikipedia.org/wiki/Ferroin]
- 2. A Portable Measurement Device Based on Phenanthroline ... [https://www.mdpi.com/1424-8220/23/3/1058]
- 3. Simple and Precise Quantification of Iron Catalyst Content ... [https://pmc.ncbi.nlm.nih.gov/articles/PMC4608529/]
- 4. A new 1,10-phenanthroline method for oxalate-extractable ... [https://www.sciencedirect.com/science/article/abs/pii/S0883292725000770]
- 5. AR Grade o-Phenanthroline [https://dravyom.com/products/ar/ar-o-phenanthroline]
- 6. Beer-Lambert Law | Transmittance & Absorbance [https://www.edinst.com/resource/the-beer-lambert-law/]
- 7. Beer-Lambert's Law: Principles and Applications in Daily Life [https://www.findlight.net/blog/beer-lamberts-law-explained-applications/]
- 8. Simple and rapid spectrophotometric determination of iron ... [https://pubmed.ncbi.nlm.nih.gov/18964765/]
- 9. The Beer-Lambert Law [https://chem.libretexts.org/Bookshelves/Physical_and_Theoretical_Chemistry_Textbook_Maps/Supplemental_Modules_(Physical_and_Theoretical_Chemistry)/Spectroscopy/Electronic_Spectroscopy/Electronic_Spectroscopy_Basics/The_Beer-Lambert_Law]
- 10. Beer–Lambert law [https://en.wikipedia.org/wiki/Beer%E2%80%93Lambert_law]
- 11. The Bouguer‐Beer‐Lambert Law: Shining Light on the ... [https://pmc.ncbi.nlm.nih.gov/articles/PMC7540309/]
- 12. Spectrophotometric Determination of Formation Constants ... [https://www.mdpi.com/2624-8549/4/3/50]
- 13. IronSpec [https://web.pdx.edu/~atkinsdb/teach/427/Expt-IronSpec.htm]
- 14. NEMI Method Summary - 3500-Fe B. Phenanthroline Method [https://www.nemi.gov/methods/method_summary/7421/]
- 15. Spectrophotometric Determination of Iron Concentration in ... [https://attahadi.ly/journal/index.php/amj/article/view/37]
- 16. Experimental reporting [https://www.rsc.org/publishing/publish-with-us/publish-a-journal-article/experimental-reporting]
- 17. Spectrophotometric and theoretical studies of the ... [https://www.sciencedirect.com/science/article/abs/pii/S0022286017305719]
- 18. Spectrophotometric Determination of Iron [https://sites.middlebury.edu/chem103lab/2016/09/04/spectrophotometric-determination-of-iron-in-a-multivitamin/]
- 19. A Portable Measurement Device Based on Phenanthroline ... [https://pmc.ncbi.nlm.nih.gov/articles/PMC9919581/]
- 20. Point-of-Care Photoresistive and Colorimetric Sensor for ... [https://pubmed.ncbi.nlm.nih.gov/40522700/]
- 21. What Is a Calibration Curve in a Spectrophotometer? [https://www.hunterlab.com/blog/what-is-a-calibration-curve-in-a-spectrophotometer/]
- 22. How to Make a Calibration Curve: A Step-by-Step Guide [https://www.labmanager.com/how-to-make-a-calibration-curve-28411]
- 23. 3.3. Estimating the linear range [https://sisu.ut.ee/lcms_method_validation/33-estimating-linear-range/]
- 24. Validation of a New 96-Well Plate Spectrophotometric Method ... [https://pmc.ncbi.nlm.nih.gov/articles/PMC3665997/]
- 25. Quantitative Mass Spectrometry Part IV: Deviations from ... [https://www.spectroscopyonline.com/view/quantitative-mass-spectrometry-part-iv-deviations-linearity]
- 26. A Friendly Complexing Agent for Spectrophotometric ... [https://pmc.ncbi.nlm.nih.gov/articles/PMC8196596/]
- 27. Experiment 11: spectrophotometric determination of iron b... [https://www.degruyterbrill.com/document/doi/10.1515/9783111702261-012/html?lang=en&srsltid=AfmBOor5rYPu5iAhEhfqEmpklu4WkLWRThbBk1qcw_VM0U5JolTh6ZT6]
- 28. Spectrophotometric determination of iron with 1,10- ... [https://link.springer.com/article/10.1007/BF01206697]
- 29. Spectrophotometric Determination of Theophylline via ... [https://www.orientjchem.org/vol41no3/spectrophotometric-determination-of-theophylline-via-oxidation-and-decomposition-of-the-iron-ii-bathophenanthroline-complex/]
- 30. 2617 Quantitative Analysis of Iron [https://chem.libretexts.org/Courses/Los_Medanos_College/General_College_Chemistry_Lab_Manual_(Semester_2)/01%3A_Experiments/2617_Quantitative_Analysis_of_Iron]
- 31. Iron phenanthrolines: A density functional theory study [https://www.sciencedirect.com/science/article/abs/pii/S0020169317313750]
- 32. A colorimetric iron sensor based on the partition of ... [https://www.sciencedirect.com/science/article/abs/pii/S0925400516316392]
- 33. Sensitive, selective, and pretreatment-free detection of ... [https://pmc.ncbi.nlm.nih.gov/articles/PMC12131907/]
- 34. 1,10-phenanthroline after preconcentration on an organic ... [https://pubmed.ncbi.nlm.nih.gov/15048384/]
- 35. Principles of Absorbance and UV-Vis Spectrophotometry [https://www.pgeneral.com/news/optimizing-spectrophotometric-measurements-best-practices-for-accurate-absorbance-readings/]
- 36. How to Ensure Reliable Absorbance Results [https://www.oceanoptics.com/blog/reliable-absorbance-results/]
- 37. Valuable Techniques for Repeatable Absorbance ... [https://www.spectroscopyonline.com/view/valuable-techniques-for-repeatable-absorbance-measurements]
- 38. Determination of iron in pharmaceutical preparations ... [https://www.pgeneral.com/applications/bio-tech-and-life-sciences/determination-of-iron-in-pharmaceutical-preparations-by-visible-spectrophotometry/]
- 39. Absorbance Measurements [https://www.bmglabtech.com/en/absorbance/]
- 40. Important Spectroscopic Techniques and Examples [https://andor.oxinst.com/learning/view/article/fundamentals-of-spectroscopy-history-explanations-and-applications]
- 41. Beyond Linearity: Identifying and Managing Nonlinear ... [https://www.spectroscopyonline.com/view/beyond-linearity-identifying-and-managing-nonlinear-effects-in-spectroscopic-data]
- 42. Simultaneous mixture analysis by using non-linear ... [https://www.sciencedirect.com/science/article/pii/S0003267004013182]
- 43. Improving Optical Measurements: Non-Linearity ... [https://pmc.ncbi.nlm.nih.gov/articles/PMC6630795/]
- 44. A review on spectral data preprocessing techniques for ... [https://www.sciencedirect.com/science/article/pii/S258900422501020X]
- 45. A 1,10—Phenanthroline Method for the Determination of ... [https://www.sciencedirect.com/science/article/pii/S0022030245951915]
- 46. Photometric Determination of Iron in Pharmaceutical ... [https://www.mdpi.com/1420-3049/26/15/4498]
- 47. Validation of the UV-Vis Spectrophotometric Method for ... [https://oahsj.org/index.php/oahsj/article/view/101]
- 48. Simple spectrophotometric methods for the determination ... [https://e-jghs.org/DOIx.php?id=10.35500/jghs.2025.7.e4]
- 49. Validation of analytical methods and detection limits in ... [https://www.sciencedirect.com/science/article/abs/pii/S0969806X24009745]
- 50. Novel approach to determination of Fe(II) using a flow ... [https://link.springer.com/article/10.1007/s00706-020-02649-8]
- 51. Eco-friendly four spectrophotometric approaches for the ... [https://pmc.ncbi.nlm.nih.gov/articles/PMC11551209/]
- 52. The tandem analytical method of flow injection diode array ... [https://www.sciencedirect.com/science/article/abs/pii/S0026265X13000179]
- 53. Comparison of Atomic Spectroscopy Techniques and the ... [https://csanalytical.com/comparison-atomic-spectroscopy-techniques-advantages-icp-ms-vs-aa-icp-oes/]
- 54. ICP-MS vs. AAS - Which Technique to Choose [https://www.drawellanalytical.com/icp-ms-vs-aas-which-technique-to-choose/]
- 55. Comparison of Spectrophotometry, FAAS and ICP-OES ... [https://www.scientific.net/AMR.787.163]
- 56. Comparison of Spectrophotometric Methods for ... [https://www.sciencepublishinggroup.com/article/10.11648/j.sjac.20210902.11]
- 57. Experiment 11: spectrophotometric determination of iron b... [https://www.degruyterbrill.com/document/doi/10.1515/9783111702261-012/html?lang=en&srsltid=AfmBOooyPJkHkTE_cBulk2WRZPmmtIk__P-E7csg5Qm006v3MgY9a45Q]
- 58. Sensitive Determination of Iron in Drinking Water, Mineral ... [https://www.sigmaaldrich.com/US/en/technical-documents/technical-article/environmental-testing-and-industrial-hygiene/drinking-water-testing/sensitive-determination-of-iron-in-water?srsltid=AfmBOophw6o36HxN98SKHqZSk_05is6A7W7hJ0z6FX2yLOmpIzMCEJzw]
- 59. Combining sequential extractions with bulk and micro X-ray ... [https://pubs.rsc.org/en/content/articlehtml/2025/em/d4em00402g]