HPLC vs. UV-Vis for Inorganic Analysis: A Strategic Guide for Scientists
This article provides a comprehensive comparison of High-Performance Liquid Chromatography (HPLC) and Ultraviolet-Visible (UV-Vis) Spectrophotometry for the analysis of inorganic samples.
HPLC vs. UV-Vis for Inorganic Analysis: A Strategic Guide for Scientists
Abstract
This article provides a comprehensive comparison of High-Performance Liquid Chromatography (HPLC) and Ultraviolet-Visible (UV-Vis) Spectrophotometry for the analysis of inorganic samples. Tailored for researchers and drug development professionals, it explores the fundamental principles, methodological applications, and key considerations for each technique. The content delves into practical troubleshooting, method optimization, and the critical validation parameters required for regulatory compliance. By synthesizing foundational knowledge with advanced comparative analysis, this guide aims to empower scientists in selecting the most appropriate and effective analytical method for their specific inorganic analysis challenges, ultimately enhancing accuracy and efficiency in pharmaceutical and biomedical research.
Understanding the Core Principles: How HPLC and UV-Vis Work for Inorganic Species
Ultraviolet-visible (UV-Vis) spectroscopy is an analytical technique that measures the amount of discrete wavelengths of UV or visible light that are absorbed by or transmitted through a sample in comparison to a reference or blank sample [1]. This property is influenced by the sample composition, providing information on both the identity and concentration of analytes present. The technique operates on the principle that electrons in molecules can be promoted to higher energy states by absorbing a specific amount of energy corresponding to particular wavelengths of light [1]. The UV-vis region of the electromagnetic spectrum covers 1.5 - 6.2 eV, which corresponds to a wavelength range of 200 - 800 nm [2]. This fundamental mechanism of light absorption forms the basis for both qualitative identification and quantitative analysis across numerous scientific fields, from pharmaceutical research to environmental monitoring.
Core Principles of Light Absorption
The Beer-Lambert Law
The quantitative foundation of UV-Vis spectroscopy is the Beer-Lambert Law, which establishes the relationship between the concentration of an analyte in solution and the amount of light it absorbs [2]. This principle can be mathematically expressed as:
A = εbc
Where:
- A is the measured absorbance (unitless)
- ε is the molar absorptivity coefficient (M⁻¹cm⁻¹)
- b is the path length of the sample cell (cm)
- c is the concentration of the analyte (M) [2]
The absorbance (A) is defined as the logarithm of the ratio of incident light intensity (I₀) to transmitted light intensity (I): A = log(I₀/I) [3]. This logarithmic relationship means that absorbance is directly proportional to both the concentration of the absorbing species and the path length of the light through the sample. The molar absorptivity coefficient (ε) is a characteristic of each compound at a specific wavelength, representing how strongly it absorbs light at that wavelength [2].
Electronic Transitions
The absorption of UV or visible light energy promotes electrons from the ground state to the first singlet excited state of a compound or material [2]. The specific amount of energy required for this transition depends on the electronic structure and bonding environment of the molecule [1]. Different functional groups (chromophores) and molecular structures absorb light at characteristic wavelengths, creating unique spectral fingerprints that can be used for identification. The energy of light is inversely proportional to its wavelength, meaning shorter wavelengths of UV light carry more energy than longer wavelengths of visible light [1]. This energy relationship determines which electronic transitions can occur in different molecular systems.
Instrumentation and Components
Spectrophotometer Configuration
A UV-Vis spectrophotometer consists of several key components that work together to measure light absorption. There are two primary optical arrangements: single beam and double beam systems [3]. In a single beam instrument, light passes through a monochromator to select a specific wavelength, then travels directly through the sample to the detector [3] [2]. This configuration is simpler but requires frequent recalibration with a reference sample. In a double beam system, the monochromatic light is split into two beams—one passing through the sample and the other through a reference blank [3] [2]. This allows for simultaneous measurement of both signals, compensating for solvent absorption and instrumental drift. More advanced simultaneous instruments use a diode array detector to measure absorbance at all wavelengths at once, without needing a monochromator between the sample and source [2].
Diagram Title: Double-Beam UV-Vis Spectrophotometer Configuration
Key Component Functions
Table 1: Essential Components of a UV-Vis Spectrophotometer
| Component | Function | Common Types |
|---|---|---|
| Light Source | Provides broad-spectrum UV and visible light | Deuterium lamp (UV), Tungsten/Halogen lamp (Vis), Xenon lamp [1] |
| Wavelength Selector | Isolates specific wavelengths from light source | Monochromator (diffraction grating), Absorption filters, Interference filters [1] |
| Sample Holder | Contains sample solution for measurement | Quartz cuvette (UV), Glass/plastic cuvette (Vis) [1] |
| Detector | Converts transmitted light to electrical signal | Photomultiplier tube (PMT), Photodiodes, Charge-coupled devices (CCD) [1] |
| Data System | Processes and displays spectral data | Computer with spectroscopy software [1] |
The light source must provide stable, continuous radiation across the UV and visible wavelength range. Many instruments use two lamps—a deuterium lamp for UV wavelengths (approximately 200-400 nm) and a tungsten or halogen lamp for visible wavelengths (approximately 350-800 nm) [1]. The monochromator contains a diffraction grating with typically 1200 grooves per mm or higher to provide sufficient optical resolution [1]. Sample holders for UV measurements must be made of quartz, as glass and plastic absorb most UV light [1]. Detectors such as photomultiplier tubes are particularly sensitive for detecting very low light levels, while photodiodes and CCD arrays offer advantages for simultaneous multi-wavelength detection [1].
Quantitative Analysis Methodology
Calibration Curve Development
For accurate quantitative analysis, establishing a proper calibration curve is essential [2]. The process involves preparing a series of standard solutions with known concentrations of the analyte and measuring their absorbance at the wavelength of maximum absorption (λmax). A calibration curve is then constructed by plotting absorbance versus concentration, which should yield a linear relationship in accordance with the Beer-Lambert Law [3] [2]. The correlation coefficient (R²) of an acceptable calibration curve should be 0.9 or better, with higher values indicating greater reliability for concentration determination of unknown samples [2]. Ideally, at least five concentration levels spaced relatively equally apart should be used, prepared accurately with volumetric glassware to minimize errors [2].
Experimental Protocol: Quantitative Analysis
Wavelength Selection: Scan the standard solution across the UV-Vis range (typically 200-800 nm) to identify the wavelength of maximum absorption (λmax) for the analyte [4].
Preparation of Standard Solutions: Precisely prepare a series of standard solutions covering the expected concentration range of the unknown samples. For example, in Levofloxacin analysis, concentrations from 0.05-300 µg/ml might be used [4].
Blank Measurement: Use the solvent or matrix without the analyte as a blank reference to zero the instrument [1] [2].
Absorbance Measurement: Measure the absorbance of each standard solution at the predetermined λmax.
Calibration Curve Construction: Plot absorbance values against corresponding concentrations and perform linear regression analysis to obtain the equation: y = mx + c, where y is absorbance, m is slope, x is concentration, and c is the y-intercept [4] [2].
Sample Analysis: Measure the absorbance of unknown samples under identical conditions and calculate their concentrations using the calibration equation.
Validation: Perform recovery studies using spiked samples to validate method accuracy. For example, in pharmaceutical analysis, recovery rates of 96.37±0.50% to 110.96±0.23% have been reported for HPLC methods [4].
Research Reagent Solutions and Materials
Table 2: Essential Research Reagents and Materials for UV-Vis Spectroscopy
| Item | Specification/Type | Function/Application |
|---|---|---|
| Solvents | HPLC-grade water, methanol, acetonitrile, buffer solutions | Sample dissolution and dilution; mobile phase preparation [4] |
| Standard Reference Materials | Certified purity (e.g., Levofloxacin ≥99%) | Calibration curve preparation, method validation [4] |
| Cuvettes/Cells | Quartz (UV), glass/plastic (Vis), path lengths 1 mm-10 cm | Sample containment during measurement [1] |
| Buffer Salts | Analytical grade (e.g., KH₂PO₄, tetrabutylammonium bromide) | Mobile phase modification, pH control [4] |
| Filters | 0.45 µm or 0.22 µm membrane filters | Sample clarification to remove particulates [1] |
| Volumetric Glassware | Class A volumetric flasks, pipettes | Precise solution preparation [2] |
The selection of appropriate reagents and materials is critical for obtaining accurate and reproducible results. Solvents must be transparent in the spectral region of interest and free from absorbing impurities [1]. Sample cells must be chosen based on the wavelength range—quartz is essential for UV measurements below 350 nm, while glass or plastic may be adequate for visible light measurements [1]. High-purity reference standards are necessary for establishing valid calibration curves, with concentrations prepared accurately using volumetric flasks and pipettes rather than graduated cylinders to minimize errors [2].
Comparative Analysis: HPLC vs. UV-Vis for Inorganic Samples
Performance Characteristics Comparison
Table 3: Comparison of HPLC and UV-Vis Spectroscopic Techniques
| Parameter | UV-Vis Spectroscopy | HPLC |
|---|---|---|
| Linear Range | 0.05-300 µg/ml (Levofloxacin) [4] | 0.05-300 µg/ml (Levofloxacin) [4] |
| Regression Equation (Levofloxacin) | y = 0.065x + 0.017 [4] | y = 0.033x + 0.010 [4] |
| Correlation Coefficient (R²) | 0.9999 [4] | 0.9991 [4] |
| Recovery Rates (Low/Medium/High) | 96.00±2.00/99.50±0.00/98.67±0.06% [4] | 96.37±0.50/110.96±0.23/104.79±0.06% [4] |
| Separation Capability | Limited; requires selective wavelength | Excellent for complex mixtures [5] |
| Analysis Time | Minutes per sample | 10-30 minutes per run [5] |
| Cost | Lower initial and operational costs | High cost for instruments, columns, and solvents [5] |
| Sample Requirements | Limited sample preparation needed | Often requires extensive sample cleanup [5] |
Advantages and Limitations in Context
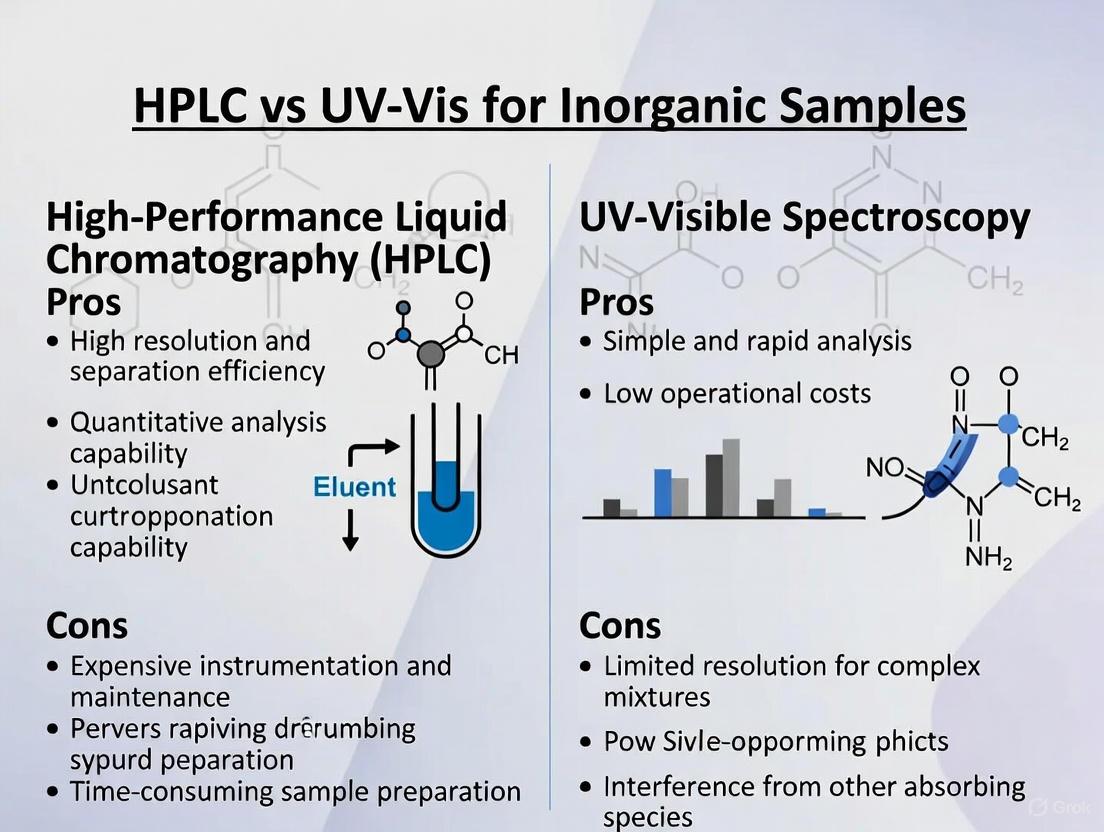
UV-Vis spectroscopy offers simplicity, rapid analysis, and cost-effectiveness for routine quantitative analysis of inorganic compounds with characteristic chromophores [1]. Its limitations include susceptibility to interference from other absorbing species in complex matrices and limited capability for analyzing multi-component mixtures without prior separation [1] [2]. In contrast, HPLC provides superior separation power for complex samples, effectively isolating analytes from potential interferents before detection [5]. This makes HPLC particularly valuable for analyzing inorganic samples with complex matrices, though it comes with higher operational costs, greater solvent consumption, and requires more skilled operation [5].
The fundamental difference in mechanism between these techniques dictates their application scope. While UV-Vis measures direct light absorption by the sample, HPLC separates components first, then typically uses UV-Vis detection to quantify the separated analytes [5] [1]. For simple systems where the analyte of interest has distinct absorption characteristics and minimal matrix interference, UV-Vis provides efficient and accurate quantification. However, for complex inorganic samples with multiple components or significant background interference, HPLC with UV-Vis detection offers the separation necessary for accurate quantification of individual components [4].
Diagram Title: Analytical Method Selection Decision Tree
The fundamental mechanism of UV-Vis spectroscopy—measuring the absorbance of light by chemical species—provides a powerful, versatile tool for quantitative analysis of inorganic compounds. Its reliance on the Beer-Lambert Law enables precise concentration measurements, while its instrumental simplicity offers practical advantages for routine analysis. However, when applied to complex inorganic samples with interfering substances, the technique's limitations become apparent. In such contexts, HPLC with UV-Vis detection combines separation power with quantitative detection, overcoming many of the limitations of standalone UV-Vis spectroscopy while maintaining its quantitative capabilities. The choice between these techniques ultimately depends on the specific sample matrix, required precision, available resources, and analytical objectives, with understanding of the core mechanism of light absorption remaining essential for effective application of either methodology.
High-Performance Liquid Chromatography (HPLC) is a powerful analytical technique that separates, identifies, and quantifies components in a mixture. Its operation is a two-stage process: first, the physical separation of compounds within a column, followed by their detection and quantification as they exit the column [6] [7]. This guide details the core principles, instrumentation, and methodologies of HPLC, providing a framework for researchers to evaluate its advantages and limitations against UV-Vis spectroscopy for inorganic sample analysis.
Core Principle: The Separation Mechanism
The fundamental principle of HPLC is the differential partitioning of analytes between a stationary and a mobile phase. The sample, dissolved in the mobile phase, is forced under high pressure through a column packed with the stationary phase [8] [5].
The Chromatographic Process
Each component in the sample interacts differently with the stationary phase due to varying physical and chemical properties, such as size, charge, polarity, and hydrophobicity. Components with stronger interactions with the stationary phase migrate more slowly and have longer retention times, while those with a higher affinity for the mobile phase elute faster [7]. The time at which a specific analyte emerges from the column is its identifying retention time [7].
Modes of Separation
The nature of the stationary and mobile phases determines the primary separation mechanism [8].
- Reversed-Phase Chromatography: The most common mode, it uses a non-polar stationary phase (e.g., C18-bonded silica) and a polar mobile phase (e.g., water/acetonitrile or water/methanol mixtures) [8] [7]. Separation is based on hydrophobic interactions, where more hydrophobic molecules have longer retention times [8].
- Normal-Phase Chromatography: This mode uses a polar stationary phase (e.g., silica) and a non-polar mobile phase (e.g., hexane). Separation is based on analyte polarity [8].
- Ion Exchange Chromatography: The stationary phase contains charged functional groups that interact with ions of the opposite charge in the sample. Separation is based on electrostatic interactions [8].
Table 1: Primary HPLC Separation Modes
| Mode | Stationary Phase | Mobile Phase | Separation Basis |
|---|---|---|---|
| Reversed-Phase | Non-polar (e.g., C18) | Polar (e.g., Water/Acetonitrile) | Hydrophobicity |
| Normal-Phase | Polar (e.g., Silica) | Non-polar (e.g., Hexane) | Polarity |
| Ion Exchange | Charged functional groups | Aqueous Buffer | Ionic Charge |
Instrumentation and Detection
After separation, the individual components must be detected. The HPLC system is composed of several key components that work in sequence [8] [7].
HPLC System Workflow
Key Instrument Components
- High-Pressure Pump: Delivers a constant, pulseless flow of the mobile phase through the system at high pressures (typically 50-1400 bar) [5] [7].
- Injector: Introduces a precise, small volume (typically microliters) of the sample mixture into the high-pressure mobile phase stream [8]. Modern systems use automated samplers for reproducibility [5].
- Chromatographic Column: The core of the separation, typically a stainless-steel tube packed with micron-sized particles coated with the stationary phase [8] [7]. The quality of the column directly determines the resolution of the separation.
- Detector: Located immediately after the column, it generates a signal proportional to the amount of analyte present as each component elutes [6] [7]. The choice of detector depends on the analyte's properties.
Common HPLC Detectors
Table 2: Comparison of Common HPLC Detection Methods
| Detection Method | Principle | Analyte Requirements | Typical Detection Limit | Destructive? |
|---|---|---|---|---|
| UV-Vis | Absorbance of UV-Vis light | Chromophore (light-absorbing group) | Nanograms | No [6] |
| Diode Array (DAD) | Full UV-Vis spectrum acquisition | Chromophore | Nanograms | No [6] |
| Fluorescence (FLD) | Emission of light after excitation | Native fluorescence or can be derivatized | Femtograms | No [6] |
| Refractive Index (RID) | Change in refractive index | Differing RI from mobile phase | Micrograms | No [6] |
| Evaporative Light Scattering (ELSD) | Light scattering by dried particles | Less volatile than mobile phase | Nanograms | Yes [6] |
| Charged Aerosol (CAD) | Charge transfer to aerosol particles | Non- and semi-volatile | Picograms | Yes [6] |
| Mass Spectrometry (MS) | Mass-to-charge ratio (m/z) | Ionizable | Picograms | Yes [6] |
Experimental Protocol: HPLC Analysis of Bakuchiol in Cosmetics
The following detailed methodology is adapted from a recent study comparing quantification techniques, illustrating a practical application of HPLC [9] [10].
Research Reagent Solutions
Table 3: Essential Materials for Bakuchiol HPLC Analysis
| Item | Function / Specification |
|---|---|
| HPLC System | Equipped with a pump, autosampler, column oven, and DAD or UV-Vis detector [9]. |
| Chromatographic Column | Reverse-phase, C18 (end-capped), e.g., 250 mm x 4.6 mm, 5 µm [9]. |
| Mobile Phase | Acetonitrile with 1% formic acid. Isocratic elution [9]. |
| Bakuchiol Standard | High-purity reference material for system calibration and quantification [9]. |
| Sample Solvent | Acetonitrile or ethanol for extracting/dissolving cosmetic samples [9]. |
| Syringe Filters | 0.45 µm, PTFE or nylon, for sample filtration before injection [9] [5]. |
Detailed Step-by-Step Procedure
Sample Preparation:
- Weigh a precise amount of the cosmetic product (e.g., serum).
- Extract the bakuchiol using an appropriate solvent (e.g., ethanol or acetonitrile) with shaking or sonication.
- Centrifuge the sample if necessary to separate insoluble matrix components.
- Critically, filter the supernatant through a 0.45 µm syringe filter to prevent column clogging [5].
Mobile Phase Preparation:
- Prepare the mobile phase by mixing HPLC-grade acetonitrile with 1% (v/v) formic acid [9].
- Degas the mobile phase thoroughly using sonication or sparging with an inert gas (e.g., helium) to remove dissolved gases that can interfere with pump performance and detection.
HPLC Instrument Setup:
- Install the C18 reverse-phase column and set the column temperature to a constant value (e.g., 25-40°C).
- Set the mobile phase flow rate, typically 1.0 mL/min for a standard 4.6 mm column [9].
- Set the detector wavelength to 260-262 nm, the maximum absorbance for bakuchiol [9].
- Allow the system to equilibrate until a stable baseline is achieved.
Calibration Curve:
- Prepare a series of standard solutions of known bakuchiol concentration.
- Inject each standard solution and record the peak area at the bakuchiol retention time.
- Plot peak area versus concentration to generate a linear calibration curve.
Sample Analysis and Quantification:
- Inject the prepared cosmetic sample.
- Identify the bakuchiol peak based on its retention time matching the standard.
- Measure the peak area and use the calibration curve to calculate the concentration in the original sample.
HPLC in Context: Comparison with UV-Vis Spectroscopy
When selecting an analytical technique, understanding the relative strengths and weaknesses of HPLC and UV-Vis is critical.
Advantages of HPLC
- High Separation Efficiency: Can resolve complex mixtures into individual components, eliminating interference from the sample matrix [5].
- Strong Qualitative and Quantitative Capability: Retention time provides a identification point, while peak area allows for precise quantification [5].
- Broad Applicability: Suitable for non-volatile, thermally unstable, and high molecular weight compounds that are not amenable to gas chromatography [5].
- High Sensitivity: When coupled with detectors like MS or FLD, it can detect analytes at trace levels [6] [5].
Limitations of HPLC
- High Cost: Instruments, columns, and high-purity solvents are expensive [5].
- Operational Complexity: Method development and system maintenance require skilled personnel [5].
- High Solvent Consumption: Generates significant waste, requiring management and disposal [5].
- Stringent Sample Preparation: Often requires extensive cleanup and filtration to protect the column [5].
UV-Vis Spectroscopy: A Complementary Technique
UV-Vis spectroscopy measures the absorption of light by a sample across UV and visible wavelengths [1]. It is primarily used for quantitative analysis of light-absorbing compounds (those with chromophores) based on the Beer-Lambert Law [1].
- Key Advantages: Extremely easy to use, low cost, rapid analysis, and high reproducibility [11].
- Key Limitations: It is a non-selective technique; it measures the total absorbance of the sample at a given wavelength and cannot distinguish between different compounds that absorb at the same wavelength [9] [11]. It is unsuitable for compounds lacking a chromophore.
Comparative Analysis for Inorganic Samples
For inorganic species, the choice between HPLC and UV-Vis depends on the analytical goal.
- Use UV-Vis for simple, fast quantification of a known inorganic ion or complex in a relatively pure solution (e.g., determining the concentration of nitrate in water at 220 nm).
- Use HPLC (often with Ion Chromatography or paired with an ICP-MS detector for inorganics) when analyzing complex mixtures containing multiple inorganic species, or when the matrix is complex and requires separation for accurate quantification. A study on bakuchiol quantification highlights this distinction: while UV-Vis could detect bakuchiol, it was prone to interference from other cosmetic ingredients, whereas HPLC provided accurate quantification by physically separating bakuchiol from the matrix [9].
In the realm of analytical chemistry, defining the sample matrix is a fundamental prerequisite for selecting the appropriate analytical technique. Within the context of a broader comparison of High-Performance Liquid Chromatography (HPLC) and Ultraviolet-Visible (UV-Vis) Spectroscopy, a clear definition of an "inorganic sample" is critical. The optimal technique hinges on the specific analytical question, the complexity of the sample, and the nature of the target analytes. This guide provides a technical framework for scoping inorganic samples, contrasting the capabilities of HPLC and UV-Vis to equip researchers and drug development professionals with the knowledge to make informed methodological choices.
Core Definition and Key Characteristics
An inorganic sample is any sample matrix—be it solid, liquid, or gas—in which the primary analytes of interest are inorganic species. These analytes encompass a broad range of substances not primarily based on carbon-hydrogen bonds, including:
- Elements in their atomic, ionic, or elemental forms.
- Ionic species, such as sodium (Na⁺), potassium (K⁺), chloride (Cl⁻), sulfate (SO₄²⁻), and nitrate (NO₃⁻) [12].
- Inorganic complexes and coordination compounds, notably those involving transition metals like iron, copper, chromium, and arsenic [13] [14].
- Small molecules and minerals, such as carbonates (e.g., CaCO₃) [15], arsenic oxides, and silicates.
The sample matrix itself—the medium containing the analytes—can be diverse. For inorganic analysis, common matrices include drinking water, groundwater, soil extracts, pharmaceutical excipients, and industrial raw materials [16] [13]. The matrix can contain everything from other salts to solvents and organic compounds, and its composition profoundly influences sample preparation, chromatographic mode, and detection method selection [16].
The Analytical Challenge of Matrix Effects
A central challenge in analyzing inorganic samples, particularly with HPLC, is the matrix effect. This refers to the tendency of other components in the sample to alter the detection or quantification of the target analyte, leading to biased results [16]. Matrix effects can manifest as:
- Co-elution of an interfering compound with the analyte [16].
- Ion suppression in mass spectrometric detection [16].
- Alteration of the analyte's retention factor by sample pH [16].
Mitigation strategies include sample dilution, extraction to remove interfering components, using 2D-LC, or switching to a more selective detection method [16].
HPLC for Inorganic Analysis: Separation and Speciation
HPLC is a powerful tool for inorganic analysis, particularly when the separation of multiple ionic or coordinative species is required. Its principal strength lies in its ability to speciate—that is, to identify and quantify different chemical forms of an element.
HPLC Methodologies for Inorganic Samples
The choice of HPLC methodology depends on the physicochemical properties of the target inorganic analytes [17].
Table 1: HPLC Modes for Inorganic Analysis
| HPLC Mode | Separation Mechanism | Typical Analytes | Application Example |
|---|---|---|---|
| Ion Exchange Chromatography | Separation based on analyte charge using cationic or anionic stationary phases [17]. | Inorganic anions (Cl⁻, NO₃⁻, SO₄²⁻) and cations (Na⁺, K⁺, Ca²⁺) [17] [12]. | Determination of anion impurities in water for injection [12]. |
| Ion Chromatography (IC) | A sub-set of ion exchange using specialized columns and suppressed conductivity detection [12]. | Same as above, with higher sensitivity and specificity. | Analysis of common anions in environmental water samples [12]. |
| Reversed-Phase HPLC with Ion Pairing | Use of ion-pair reagents to impart retention of ionic analytes on a standard C18 column [17]. | Strong acids or bases [17], arsenic species [13]. | Speciation of arsenite and arsenate in water [13]. |
| Size Exclusion Chromatography | Separation based on molecular size in aqueous or organic solvents [17]. | High molecular weight compounds, polymers. | Separation of synthetic polymers or macromolecules. |
Detection Methods for HPLC in Inorganic Analysis
Following chromatographic separation, the choice of detector is paramount. No single detector is universal, and the selection is dictated by the analyte's properties and the required sensitivity [18] [6].
Table 2: HPLC Detectors for Inorganic Analytes
| Detection Method | Analyte Requirements | Key Strengths | Key Limitations | Approx. Detection Limit |
|---|---|---|---|---|
| Conductivity Detection (CD) | Ionic species [12]. | Universal for ions; simple and robust [12]. | Requires chemical suppression; not for non-ionic species [12]. | Low ppm to ppb [12]. |
| UV-Vis Absorbance | Must possess a chromophore (UV-Vis absorbing group) [18] [6]. | Widely available, highly reproducible, quantitative [19]. | Cannot detect non-chromophoric analytes (e.g., many ions) [12] [19]. | Nanograms [6]. |
| Mass Spectrometry (MS) | Capable of forming gas-phase ions [6]. | High specificity and sensitivity; provides structural information [6]. | Expensive instrumentation; complex operation [13]. | Picograms [6]. |
| Inductively Coupled Plasma-MS (ICP-MS) | Elemental composition. | Exceptional sensitivity and element specificity; ideal for speciation [13]. | Very expensive; dedicated to elemental analysis [13]. | <1 ppb [13]. |
| Charged Aerosol Detection (CAD) | Non- and semi-volatile analytes [6] [12]. | Near-universal response; good for analytes lacking a chromophore [12] [19]. | Non-linear response; requires volatile mobile phases [12]. | Picograms [6]. |
| Refractive Index (RI) | Any analyte with a RI different from the mobile phase [18] [12]. | Universal detection [12]. | Low sensitivity; not compatible with gradients; sensitive to temperature [6] [12]. | Micrograms [6]. |
| Electrochemical Detection (ECD) | Undergoes redox reaction [6]. | Extremely sensitive and selective for electroactive species [6]. | Requires specific analyte properties; can be prone to fouling [6]. | Femtograms [6]. |
Detailed Experimental Protocol: Speciation of Inorganic Arsenic in Water by HPLC-UV/MS
The following protocol, adapted from a published study, demonstrates the practical application of HPLC for the sensitive speciation of inorganic arsenic [13].
1. Objective: To separate, identify, and quantify arsenite (As(III)) and arsenate (As(V)) in deionized and ground water samples using anion-exchange HPLC with UV and MS detection.
2. Materials and Reagents:
- Standards: Sodium arsenite (99.995%) and sodium arsenate (99.995%).
- Mobile Phase: Aqueous ammonium carbonate and methanol.
- Columns: Strong Anion Exchange (SAX) column.
- Instrumentation: HPLC or UPLC system coupled to a UV detector and a mass spectrometer (e.g., Waters Acquity TQ MS).
- Solvents: 0.1 N sodium hydroxide for stock solutions, HPLC-grade water.
3. Sample Preparation:
- Prepare stock solutions of arsenite and arsenate in 0.1 N sodium hydroxide.
- Serially dilute stock solutions with deionized water or the sample matrix (e.g., ground water) to create calibration standards in the range of 0.50 to 25 μg/mL.
- Filter all samples and standards using a 0.2 μm syringe filter prior to injection.
4. Instrumental Conditions:
- Chromatography:
- Column: Strong Anion Exchange (SAX).
- Mobile Phase: Ammonium carbonate in water/methanol.
- Elution: Isocratic or gradient mode.
- Flow Rate: Optimized for separation (e.g., 0.2-0.5 mL/min).
- Injection Volume: 1-10 μL.
- Detection:
- UV Detection: Wavelength set to 190-210 nm or an optimized wavelength. An atypical reference wavelength can be used to improve sensitivity [13].
- MS Detection: Electrospray Ionization (ESI) in negative ion mode. Data acquired in Selected Ion Recording (SIR) or Multiple Reaction Monitoring (MRM) for enhanced sensitivity and specificity.
5. Analysis and Quantification:
- Inject standards to establish a calibration curve of peak area versus concentration.
- The correlation coefficients (R²) for the linear regression should be >0.99 [13].
- Inject samples and quantify arsenite and arsenate concentrations by comparing their peak areas to the calibration curve.
6. Results and Performance:
- The study demonstrated that MRM MS detection provided the highest sensitivity (5 ng/mL), followed by SIR MS (50 ng/mL), and UV detection (500 ng/mL) [13].
- This methodology meets the EPA drinking water limit for arsenic of 10 ppb when using MS detection [13].
UV-Vis Spectroscopy for Inorganic Analysis: Direct Quantification
UV-Vis spectroscopy is an analytical technique that measures the absorption of ultraviolet and visible light by a chemical substance in solution [15] [14]. It is primarily a quantitative technique that provides information about electronic transitions, which for inorganic compounds often involve d-d transitions in transition metal complexes or charge-transfer transitions [14].
Applications and Methodology
UV-Vis is widely used for the direct determination of absorbing species or, more commonly, following a derivatization reaction to create an absorbing species [15].
Table 3: UV-Vis Applications in Inorganic Analysis
| Analytic Category | Example | Methodological Approach |
|---|---|---|
| Transition Metal Complexes | [Fe(H₂O)₆]³⁺, [Cu(NH₃)₄]²⁺ | Direct measurement of d-d transition absorption to determine concentration or study ligand field effects [14]. |
| Direct Determination | Nitrate (NO₃⁻) | Measurement of absorbance at a specific wavelength (e.g., 208 nm for nitrate), though matrix interferences can be an issue [15]. |
| Derivatization Methods | Cr(VI), Fe(II) | Chromium: Reaction with 1,5-diphenylcarbazide under acidic conditions to form a red-violet complex measured at 540 nm [15]. Iron: Reaction with 1,10-phenanthroline to form an orange-red complex measured at 510 nm [15]. |
| Carbonate Ions | CaCO₃ | Direct measurement of absorbance at wavelengths less than ~250 nm, with characterized peaks at 233.42, 254.91, and 356.52 nm [15]. |
Detailed Experimental Protocol: Determination of Hexavalent Chromium with Diphenylcarbazide
This is a standard UV-Vis method for the selective determination of Cr(VI) [15].
1. Objective: To determine the concentration of Cr(VI) in a water sample using complex formation with 1,5-diphenylcarbazide.
2. Materials and Reagents:
- Research Reagent Solutions:
- 1,5-Diphenylcarbazide Solution: Dissolve 0.25 g of 1,5-diphenylcarbazide in 100 mL of acetone. Store in a brown bottle (light-sensitive).
- Sulfuric Acid Solution: Dilute concentrated H₂SO₄ to approximately 0.2 N.
- Chromium Standard: Prepare a stock solution of K₂Cr₂O₇ in water.
- Instrumentation: UV-Vis spectrophotometer with 1 cm pathlength cuvettes.
3. Sample Preparation:
- Pipette a known volume (e.g., 25 mL) of the water sample or standard into a clean flask.
- Adjust the sample to a pH of ~2 using the sulfuric acid solution.
- Add 1.0 mL of the 1,5-diphenylcarbazide solution and mix thoroughly.
- Allow the color to develop for 5-10 minutes.
4. Instrumental Measurement:
- Set the spectrophotometer to measure absorbance at 540 nm.
- Zero the instrument using a reagent blank prepared with deionized water treated with acid and reagent.
- Measure the absorbance of the standards and samples.
5. Analysis and Quantification:
- Prepare a calibration curve using standard solutions of known Cr(VI) concentration.
- Determine the concentration of Cr(VI) in the unknown sample from the calibration curve using the Beer-Lambert law.
- The molar absorptivity for the complex is high (30,000 - 80,000 L·mol⁻¹·cm⁻¹), allowing for detection limits of ~5 μg/L under optimized conditions [15].
Comparative Decision Framework: HPLC vs. UV-Vis
The choice between HPLC and UV-Vis is not a matter of which is universally better, but which is more fit-for-purpose given the analytical challenge.
Table 4: Technique Comparison for Inorganic Analysis
| Parameter | HPLC | UV-Vis Spectroscopy |
|---|---|---|
| Primary Strength | High-resolution separation of complex mixtures; speciation analysis. | Rapid, direct quantification of single analytes or simple mixtures. |
| Analyte Specificity | Excellent for resolving multiple species; hyphenation with MS provides ultimate specificity. | Limited specificity; relies on selective reactions or non-overlapping absorptions. |
| Sensitivity | Can be very high with MS, CAD, or FLD detection (pg-fg levels) [6]. | Good for targeted assays with derivatization (μg-ng levels) [15]. |
| Sample Throughput | Lower throughput per sample due to longer run times. | Very high throughput; analysis times of seconds to minutes. |
| Method Development Complexity | High; requires optimization of column, mobile phase, and detector [16] [17]. | Low; method development is typically straightforward. |
| Equipment and Operational Cost | High capital and maintenance costs. | Low capital and maintenance costs. |
| Data Output | Chromatogram (signal vs. time) providing retention time, peak area, and spectral data. | Spectrum (absorbance vs. wavelength) or single absorbance value. |
Workflow Diagram for Technique Selection
The following diagram outlines a logical decision pathway for selecting between UV-Vis and HPLC for inorganic sample analysis.
The Scientist's Toolkit: Essential Research Reagents and Materials
Table 5: Key Reagents and Materials for Inorganic Analysis
| Item | Function | Typical Application |
|---|---|---|
| Ion-Pair Reagents (e.g., alkyl sulfonates) | Imparts retention to ionic analytes on reversed-phase HPLC columns [17]. | Separation of arsenite/arsenate [13]. |
| Buffers for Mobile Phase (e.g., ammonium carbonate, phosphate) | Controls pH to ensure consistent ionization and retention of analytes [13] [17]. | Ion exchange and reversed-phase HPLC. |
| Derivatization Reagents (e.g., 1,5-diphenylcarbazide) | Chemically reacts with the target analyte to form a highly absorbing complex for UV-Vis detection [15]. | Spectrophotometric determination of Cr(VI). |
| Strong Anion/Exchange (SAX/SCX) Columns | Stationary phases designed to separate ions based on their charge [13] [17]. | Separation of inorganic anions and cations. |
| Solid Phase Extraction (SPE) Cartridges | Selective purification and concentration of target analytes; removal of interfering matrix [16]. | Sample clean-up prior to HPLC analysis. |
| Volatile Buffers (e.g., ammonium formate, TFA) | Compatible with mass spectrometric detection, as they do not cause ion suppression or source fouling [19]. | HPLC-MS methods for inorganic speciation. |
Defining an inorganic sample by its target inorganic analytes and complex matrix components is the critical first step in analytical scoping. HPLC stands out as the superior technique for resolving complex mixtures and performing essential speciation analyses, albeit with greater cost and operational complexity. UV-Vis spectroscopy offers a robust, cost-effective solution for rapid quantification of single analytes, particularly when paired with selective derivatization protocols. The decision between them is not mutually exclusive; in many laboratories, UV-Vis serves as a rapid screening tool, while HPLC provides definitive, detailed analysis. The choice ultimately rests on the specific requirements for resolution, sensitivity, throughput, and information content demanded by the research or quality control objective.
The Critical Role of Chromophores and UV Activity in Detection
In pharmaceutical analysis and inorganic research, the ability to accurately detect and quantify substances hinges on their interaction with light. The presence or absence of chromophores—specific functional groups that absorb ultraviolet (UV) or visible light—directly dictates the choice of analytical technique and the success of the analysis [20]. This fundamental relationship is critical when comparing High-Performance Liquid Chromatography (HPLC) with UV-Vis spectrophotometry, especially for the analysis of inorganic samples which often lack inherent chromophores [21].
UV-Visible spectroscopy operates on the principle of electronic transitions, where molecules absorb light energy, promoting electrons from ground states to excited states [20]. The Beer-Lambert Law (A = εcl) forms the quantitative foundation, establishing that the absorbance (A) of a solution is directly proportional to the concentration (c) of the absorbing species, its molar absorptivity (ε), and the path length (l) of the light through the sample [22] [20]. The efficiency of this absorption is governed by the chromophore's structure, with compounds containing conjugated double-bond systems typically absorbing strongly in the UV-Vis region [18].
For inorganic ions, which frequently lack these natural chromophores, analysts must often employ post-column derivatization techniques, complexing the metal ions with organic ligands to form colored complexes that can be detected [23] [22]. This additional step introduces both complexity and opportunity in method development, creating a significant point of differentiation between the direct measurement capabilities of UV-Vis and the separation power of HPLC.
Fundamental Concepts: Chromophores and UV Activity
What are Chromophores?
A chromophore is defined as the part of a molecule responsible for its absorption of ultraviolet or visible radiation [20]. Structurally, chromophores are characterized by the presence of valence electrons with relatively low excitation energies, typically found in:
- π-Electrons in systems with conjugated double bonds (e.g., -C=C-C=C-)
- Non-bonding (n) electrons present in heteroatoms such as oxygen, nitrogen, and sulfur [18]
When exposed to UV-Vis light, these electrons undergo transitions from their ground state (highest occupied molecular orbital, or HOMO) to excited states (lowest unoccupied molecular orbital, or LUMO). The energy difference between these orbitals determines the wavelength of maximum absorption (λmax), while the probability of the transition influences the molar absorptivity (ε) [20].
Electronic Transitions and Spectral Characteristics
The primary electronic transitions relevant to analytical detection include:
- π→π* transitions: Typically found in alkenes, alkynes, and aromatic compounds, generally producing strong absorption bands.
- n→π* transitions: Characteristic of carbonyl and nitro groups, yielding weaker absorption bands.
- n→σ* transitions: Associated with saturated compounds with heteroatoms [18].
The following diagram illustrates these fundamental electronic transitions that occur when chromophores absorb UV-Vis light:
UV Activity in Inorganic Compounds
Most simple inorganic ions (e.g., Ca²⁺, Mg²⁺, Na⁺, Cl⁻) do not possess chromophores in the conventional organic chemistry sense. Their electronic configurations typically involve tightly bound electrons that require high energy for excitation, often outside the conventional UV-Vis range [23]. This fundamental limitation necessitates strategic approaches for detection:
- Complexation Reactions: Inorganic ions can be complexed with organic ligands that contain chromophores. The resulting coordination compounds often exhibit intense charge-transfer bands in the UV-Vis region [23] [22].
- Redox Chemistry: Some inorganic species undergo oxidation or reduction reactions that produce colored products measurable by UV-Vis [24].
- Indirect Detection: For HPLC, alternative detection methods that don't rely on UV activity can be employed, including conductivity, mass spectrometry, or evaporative light scattering detection [24] [25].
The challenge of detecting weakly UV-active compounds is particularly pronounced in pharmaceutical analysis, where approximately 20-30% of drug substances and their impurities lack strong chromophores, necessitating specialized HPLC detection approaches [21].
HPLC Detection Technologies
High-Performance Liquid Chromatography separates complex mixtures before detection, making it uniquely powerful for analyzing multiple components simultaneously. The choice of detector in HPLC is critical and depends heavily on the chemical properties of the analytes, particularly their UV activity [18]. HPLC detectors can be categorized into several types based on their operational principles:
- Bulk Property Detectors: Measure differences in a physical property of the mobile phase with and without the analyte (e.g., Refractive Index Detection) [18]
- Analyte-Specific Property Detectors: Respond to a characteristic unique to the analyte (e.g., UV-Vis, Fluorescence, Electrochemical Detection) [18]
- Mobile Phase Modification Detectors: Change the mobile phase post-column to induce detectable changes in analyte properties (e.g., Evaporative Light Scattering Detection) [18]
- Hyphenated Techniques: Couple HPLC with independent analytical technologies (e.g., LC-MS, LC-NMR) [18]
HPLC Detectors for Compounds with Weak Chromophores
For inorganic samples and organic compounds with weak UV activity, several specialized HPLC detectors offer viable alternatives to conventional UV detection:
- Refractive Index (RI) Detectors: Measure the deflection of a light beam due to refractive index differences between pure mobile phase and analyte-containing mobile phase [24]. RI detectors are universal but have limited sensitivity (microgram range) and are sensitive to temperature and flow fluctuations [24] [26].
- Evaporative Light Scattering Detectors (ELSD): Convert the column effluent to an aerosol, evaporate the mobile phase, and detect the remaining analyte particles by light scattering [24]. ELSD detects non-volatile analytes independent of chromophores, with sensitivity in the nanogram range [24].
- Charged Aerosol Detectors (CAD): Similar to ELSD but with higher sensitivity, CAD charges aerosol particles and detects the resulting current, offering uniform response for non-volatile and semi-volatile analytes regardless of chemical structure [24].
- Mass Spectrometric (MS) Detectors: Ionize analytes and separate them based on mass-to-charge ratio, providing exceptional sensitivity (picogram to femtogram range) and structural information without requiring chromophores [24] [26].
- Electrochemical Detectors (ECD): Measure current generated by oxidation/reduction of electroactive compounds at an electrode surface, offering high sensitivity for specific analyte classes [24].
The following workflow illustrates the decision process for selecting an appropriate HPLC detector based on analyte properties:
Quantitative Comparison of HPLC Detectors
The selection of an appropriate HPLC detector requires careful consideration of sensitivity, linear dynamic range, and applicability to specific analytical challenges. The following table provides a comparative overview of common HPLC detection methods:
Table 1: Performance Comparison of HPLC Detection Methods
| Detection Method | Sensitivity Range | Linear Dynamic Range | Chromophore Required? | Key Applications |
|---|---|---|---|---|
| UV-Vis [24] | Nanograms | Limited | Yes | Pharmaceuticals with strong chromophores |
| Fluorescence (FLD) [24] | Femtograms to picograms | Wide | Yes (or derivatization) | Trace analysis of native fluorophores |
| Refractive Index (RID) [24] [26] | Micrograms | Wide | No | Sugars, polymers, non-UV active compounds |
| Evaporative Light Scattering (ELSD) [24] | Nanograms | Non-linear | No | Lipids, carbohydrates, natural products |
| Charged Aerosol (CAD) [24] | Picograms | Wider than ELSD | No | Impurity profiling, formulation analysis |
| Electrochemical (ECD) [24] | Femtograms to picograms | Wide | No (redox activity required) | Neurotransmitters, catecholamines, antioxidants |
| Mass Spectrometry (MS) [24] [26] | Picograms to femtograms | Limited | No | Metabolite identification, biomarker discovery |
UV-Vis Spectrophotometry for Inorganic Analysis
Fundamental Principles and Instrumentation
UV-Vis spectrophotometry measures the absorption of ultraviolet or visible light by a substance in solution, providing both qualitative and quantitative analytical information [20]. The fundamental components of a UV-Vis spectrophotometer include:
- Light Source: Typically deuterium lamps for UV range, tungsten-halogen lamps for visible range [20]
- Monochromator: Diffraction grating or prism that separates polychromatic light into individual wavelengths [20]
- Sample Holder: Cuvette with standard path length of 10 mm, constructed from quartz, glass, or plastic [20]
- Detector: Photodiode or photomultiplier tube that converts transmitted light intensity to electrical signals [20]
Modern spectrophotometers may be single-beam (measuring reference and sample sequentially) or double-beam (simultaneously measuring reference and sample) designs, with diode array instruments capable of capturing entire spectra rapidly by dispersing light after it passes through the sample [18].
Complexation Strategies for Inorganic Ion Detection
Since most inorganic ions lack inherent chromophores, complexation with organic ligands represents the most common strategy for enabling their detection by UV-Vis spectrophotometry [23] [22]. This approach involves:
- Selection of Appropriate Complexing Agents: Ligands with specific donor atoms that coordinate effectively with target metal ions [23]
- Optimization of Reaction Conditions: pH, temperature, and reaction time significantly impact complex formation and stability [23]
- Wavelength Selection: Identification of λmax for the metal-ligand complex, which often differs from the absorption maximum of the free ligand [22]
A representative example is the detection of calcium ions (Ca²⁺) using Calmagite (1-(1-Hydroxy-4-methyl-2-phenylazo)-2-naphthol-4-sulfonic acid), which forms a colored complex measurable at specific wavelengths [23]. The resulting complex exhibits a strong correlation between calcium concentration and absorbance (R² = 0.997), enabling quantitative determination [23].
Colorimetry for Metal Ion Analysis
Colorimetry represents a specialized form of visible spectrophotometry focused specifically on measurements in the visible region (400-800 nm) [22]. This technique is particularly valuable for inorganic analysis through:
- Complementary Color Principles: A compound absorbs light complementary to its perceived color (e.g., a red compound absorbs green light) [22]
- Standard Calibration Curves: Absorbance measurements of standards with known concentrations create a linear relationship for determining unknown concentrations [22]
- Application to Colored Complexes: Naturally colored metal ions (e.g., Cu²⁺ blue, Cr³⁺ green) or those forming colored complexes with specific ligands [22]
For example, the quantitative determination of iron concentration as FeSCN²⁺ exemplifies colorimetric analysis, where the intense red color of the iron(III) thiocyanate complex allows quantification at specific wavelengths following Beer-Lambert's Law [22].
Comparative Analysis: HPLC vs. UV-Vis for Inorganic Samples
Direct Comparison of Technical Capabilities
When selecting between HPLC and UV-Vis for inorganic analysis, researchers must consider multiple technical factors that directly impact method performance and applicability:
Table 2: Direct Technical Comparison of UV-Vis and HPLC for Inorganic Analysis
| Parameter | UV-Vis Spectrophotometry | HPLC with Various Detectors |
|---|---|---|
| Selectivity | Limited without separation; relies on specific complexation [27] | Excellent; separation precedes detection [27] |
| Sensitivity | Good for simple assays; depends on molar absorptivity [27] | Superior; can detect low-level impurities [27] |
| Multi-component Analysis | Limited without mathematical deconvolution [20] | Excellent; inherent separation capability [27] |
| Sample Preparation | Minimal for direct analysis [27] | Often requires optimization of mobile phase, columns [27] |
| Analysis Speed | Fast for single analytes [27] | Moderate to slow; separation time required [27] |
| Instrument Cost | Low; simple setup [27] | High; complex instrumentation [27] |
| Operator Skill Required | Basic training sufficient [20] | Requires skilled operation [27] |
| Chromophore Dependency | High; requires absorption or derivatization [21] | Variable; multiple detection options available [24] |
Experimental Evidence: Case Study Comparison
A direct comparative study of Levofloxacin analysis demonstrated measurable differences between HPLC and UV-Vis methods [4]. When analyzing Levofloxacin-loaded composite scaffolds, researchers established standard curves for both techniques:
- HPLC Method: Regression equation y = 0.033x + 0.010 with R² = 0.9991 [4]
- UV-Vis Method: Regression equation y = 0.065x + 0.017 with R² = 0.9999 [4]
Despite the excellent linearity of both methods, recovery studies revealed significant accuracy differences. For medium concentrations (25 µg/ml), HPLC showed recovery of 110.96±0.23% compared to 99.50±0.00% for UV-Vis, suggesting potential matrix interference effects in the HPLC method [4]. The study concluded that UV-Vis might inaccurately measure drug concentrations in complex composite systems, with HPLC being preferred for evaluating sustained release characteristics [4].
Analysis of Weaknesses and Limitations
Each technique presents specific limitations that must be considered during method selection:
UV-Vis Limitations:
- Limited Specificity: Cannot distinguish between compounds with similar chromophores in mixture [27]
- Matrix Interference: Sample components may contribute to background absorption [4]
- Derivatization Requirements: Additional steps needed for non-absorbing species increase complexity [23]
- Dynamic Range Constraints: May require dilution for concentrated samples [20]
HPLC Limitations:
- Cost and Complexity: Higher initial investment and maintenance requirements [27]
- Method Development Time: Extensive optimization needed for separation and detection [27]
- Solvent Consumption: Environmental considerations with mobile phase disposal [27]
- Detection Limitations: Even with advanced detectors, some analytes remain challenging [25]
A notable example of HPLC limitations appears in the analysis of SKF-99085, where UV detection at 280 nm indicated high purity (>99.9%), but alternative detection methods (LC-MS, RI) revealed significant reduction impurities that lacked chromophores, explaining the discrepancy between impurity profile (99.9% pure) and actual assay results (96.6% w/w) [25].
Experimental Protocols for Inorganic Analysis
HPLC Method for Metal Ion Analysis with Post-Column Derivatization
This protocol adapts HPLC with post-column derivatization for the detection of metal ions that lack chromophores, based on established analytical approaches [23] [25].
Research Reagent Solutions:
Table 3: Essential Reagents for Metal Ion Analysis by HPLC
| Reagent | Function | Specifications |
|---|---|---|
| Methanol (HPLC-grade) [4] | Mobile phase component | Low UV absorbance, high purity |
| Tetrabutylammonium bromide [4] | Ion-pairing reagent | Analytical standard, ≥99% |
| Potassium dihydrogen phosphate (KH₂PO₄) [4] | Buffer component | Analytical grade |
| Calmagite indicator [23] | Complexing agent for calcium | 1-(1-Hydroxy-4-methyl-2-phenylazo)-2-naphthol-4-sulfonic acid |
| Nitric acid (trace metal grade) | System cleaning | Purified to eliminate metal contamination |
| Metal standard solutions | Calibration standards | Certified reference materials |
Experimental Procedure:
Mobile Phase Preparation: Prepare 0.01 mol/L KH₂PO₄ buffer solution in HPLC-grade water. Adjust to pH 8.0 using dilute NaOH solution. Mix with methanol in 75:25 ratio (buffer:methanol). Add 0.5 mol/L tetrabutylammonium hydrogen sulphate as an ion-pairing reagent [4].
Chromatographic Conditions:
Post-Column Derivatization System:
- Prepare Calmagite solution (0.1 mM) in alkaline buffer (pH 11.0) [23]
- Connect post-column reagent delivery system with mixing tee
- Maintain reagent flow rate at 0.3 mL/min
- Use reaction coil (1.0 mL volume) maintained at 40°C
Calibration Standards:
- Prepare stock solution of target metal ion (1000 μg/mL) in ultrapure water
- Prepare serial dilutions covering expected concentration range (e.g., 0.05-300 μg/mL) [4]
- Include quality control samples at low, medium, and high concentrations
Sample Preparation:
- Filter samples through 0.45 μm membrane filter
- For solid samples, use appropriate extraction procedure
- Adjust pH to optimize complex formation if necessary
System Suitability Testing:
- Inject system suitability standard to verify resolution, peak shape, and retention time reproducibility
- Confirm peak area RSD <2% for replicate injections
UV-Vis Method for Calcium Determination via Complexation
This protocol describes the determination of calcium concentration in aqueous solutions using complexation with Calmagite, based on established spectrophotometric methods [23].
Procedure:
Reagent Preparation:
Sample Derivatization:
Spectrophotometric Measurement:
Calibration Curve:
Calculation:
- Determine sample concentration from calibration curve
- Apply dilution factor if necessary
Method Validation:
- Determine linear range, limit of detection (LOD), and limit of quantification (LOQ)
- Assess precision through replicate analyses (RSD <5%)
- Evaluate accuracy through spike recovery experiments (85-115%)
The critical role of chromophores and UV activity in detection remains a fundamental consideration when selecting analytical methods for inorganic samples. UV-Vis spectrophotometry offers simplicity, cost-effectiveness, and rapid analysis for samples that can be complexed to form chromophores, while HPLC provides superior separation capabilities and diverse detection options for complex mixtures, albeit with higher complexity and cost [27].
The continuing evolution of detection technologies addresses current limitations in inorganic analysis. Hybrid detection systems that combine complementary techniques offer particularly promising directions [27]. For example, LC-MS-MS systems couple separation power with structural elucidation capabilities, while diode-array detectors enable peak purity assessment during HPLC analysis [27]. The emergence of charged aerosol detection provides more uniform response factors for non-UV absorbing compounds compared to traditional ELSD [24].
Miniaturization and portable detection systems represent another significant trend, enabling field-based analysis of inorganic species without compromising sensitivity [26]. These advancements, coupled with green analytical chemistry approaches that reduce solvent consumption and waste generation, will likely shape the future landscape of inorganic analysis [27].
For researchers and drug development professionals, the selection between HPLC and UV-Vis methodologies must be guided by specific analytical requirements, including sensitivity needs, sample complexity, available resources, and regulatory considerations. Understanding the fundamental role of chromophores and the available strategies to overcome detection limitations ensures appropriate method selection and reliable analytical results for inorganic sample analysis.
High-Performance Liquid Chromatography (HPLC) serves as a powerful analytical technique for separating, identifying, and quantifying components in complex mixtures, including inorganic compounds [28]. The choice of detector is a critical strategic decision that directly impacts method sensitivity, selectivity, and regulatory compliance in pharmaceutical, environmental, and industrial applications [29]. Unlike organic compounds that often contain chromophores for UV detection, inorganic analytes present unique detection challenges due to their diverse physicochemical properties [30].
For inorganic analysis, three detectors are particularly significant: Ultraviolet-Visible (UV-Vis) for metal complexes and ions with suitable absorbance, Refractive Index (RI) as a universal but less sensitive option, and Conductivity as the premier choice for ionic species [31] [29]. This guide provides an in-depth technical examination of these three detection modalities, focusing on their operational principles, application scope, methodological requirements, and comparative advantages for inorganic samples within the broader context of analytical technique selection.
Fundamental Principles and Detector Types
Ultraviolet-Visible (UV-Vis) Absorbance Detectors
Principle of Operation: UV-Vis detectors measure the absorption of ultraviolet or visible light by analyte molecules as they elute from the chromatographic column [29]. The fundamental relationship between absorption and concentration is governed by the Beer-Lambert law, which states that absorbance (A) is proportional to the concentration (c) of the absorbing species, the pathlength (b) of the flow cell, and the molar absorptivity (ε) of the analyte [18]. This relationship is expressed mathematically as:
[ A = \varepsilon bc = \log{10}\left(\frac{I0}{I}\right) ]
where (I_0) is the incident light intensity and (I) is the transmitted light intensity [18].
Key Variants: Modern HPLC systems offer three primary types of UV-Vis detection:
- Variable Wavelength Detectors (VWD): Use a rotating grating to select a single wavelength for illumination, offering high sensitivity for targeted analysis [6].
- Photodiode Array Detectors (PDA): Expose the sample to the entire spectrum and disperse the transmitted light across an array of photodiodes, enabling simultaneous multi-wavelength detection and peak purity assessment [18] [6].
- Multiple Wavelength Detectors (MWD): Similar to PDA but with technical differences in optical implementation [6].
For inorganic applications, many metal ions and inorganic anions can be detected directly if they absorb in the UV-Vis range, or indirectly after derivatization with chromogenic reagents to form light-absorbing complexes [31].
Refractive Index (RI) Detectors
Principle of Operation: RI detectors function as bulk property detectors that measure the change in the refractive index of the mobile phase as analytes elute from the column [18] [31]. These detectors do not rely on specific chromophores but instead detect any compound that alters the overall refractive index of the eluent [29]. The most common design is the deflection-type RI detector, which utilizes a dual-cell configuration (sample and reference) to compare against the pure mobile phase [6].
When an analyte passes through the sample flow cell, the direction of light passing through the cell changes in proportion to the concentration of the analyte due to the difference in refractive index between the pure mobile phase and the analyte-containing mobile phase [6]. This deflection is measured quantitatively when the system is properly calibrated for the specific analyte/mobile phase combination [6].
Key Characteristics: RI detectors are considered universal detectors because they respond to virtually all solutes, making them particularly valuable for inorganic compounds lacking UV absorption [29]. However, this universality comes with significant limitations, including sensitivity to temperature and flow fluctuations, incompatibility with gradient elution, and relatively low sensitivity compared to other detection methods [6] [31] [29].
Conductivity Detectors
Principle of Operation: Conductivity detectors measure changes in the electrical conductivity of the mobile phase resulting from the presence of ionic species [31] [29]. These detectors are exceptionally selective for charged inorganic compounds and operate by applying an alternating voltage between two electrodes in the flow cell and measuring the resulting current [29].
The detection mechanism relies on the fact that different ions have characteristic molar conductivities, and the overall conductivity of the solution is proportional to the concentration of ions present [31]. In non-suppressed conductivity detection, the mobile phase must have a low background conductivity, typically achieved by using weak organic acids or specially formulated eluents [31]. For enhanced sensitivity, suppressed conductivity detection may be employed, which chemically reduces the background conductivity of the eluent before detection [29].
Key Characteristics: Conductivity detection offers exceptional sensitivity for ionic inorganic compounds and is particularly well-suited for ion chromatography applications [31] [29]. These detectors are highly selective for charged species but ineffective for neutral compounds, and they require careful control of mobile phase composition to maintain optimal performance [29].
Comparative Analysis of Detector Performance
The selection of an appropriate HPLC detector for inorganic analysis requires careful consideration of performance characteristics relative to analytical requirements. The following table provides a systematic comparison of UV-Vis, RI, and conductivity detectors across key parameters:
Table 1: Performance Comparison of HPLC Detectors for Inorganic Analysis
| Parameter | UV-Vis Detectors | Refractive Index Detectors | Conductivity Detectors |
|---|---|---|---|
| Detection Principle | Light absorption by chromophores [29] | Change in refractive index [29] | Change in electrical conductivity [29] |
| Selectivity | Selective for compounds with UV-Vis absorption [29] | Universal [29] | Selective for ionic species [29] |
| Sensitivity | Moderate to High (nanogram range) [6] | Low (microgram range) [6] [29] | High (picogram range for some ions) [29] |
| Linear Dynamic Range | ~10³-10⁴ | ~10²-10³ | ~10³-10⁴ |
| Gradient Elution Compatibility | Excellent [6] | Poor [6] [29] | Possible with limitations [29] |
| Temperature Sensitivity | Low to Moderate | Very High [29] | Moderate [29] |
| Primary Inorganic Applications | Metal complexes, ions with direct UV absorption, derivatized inorganics [31] | Sugars, alcohols, polymers, non-UV absorbing inorganics [29] | Anions, cations, inorganic ions, ion chromatography [31] [29] |
Table 2: Advantages and Limitations for Inorganic Analysis
| Detector Type | Key Advantages | Key Limitations |
|---|---|---|
| UV-Vis | High sensitivity for suitable compounds; excellent gradient compatibility; robust and cost-effective [29] | Limited to compounds with chromophores; may require derivatization for many inorganics; susceptible to mobile phase absorption interferences [29] |
| Refractive Index | Universal response; simple operation; effective for non-UV absorbing inorganics [29] | Low sensitivity; temperature sensitive; not compatible with gradient elution [29] |
| Conductivity | Excellent sensitivity for ionic species; highly selective for inorganics; ideal for ion chromatography [31] [29] | Limited to ionic compounds; requires controlled mobile phase composition; can be affected by background conductivity [29] |
Experimental Methodologies and Protocols
Method Development for UV-Vis Detection of Inorganics
Sample Preparation Protocol:
- Digestion: For solid inorganic samples, begin with appropriate acid digestion (e.g., nitric acid for metals) to ensure complete dissolution and liberation of target analytes.
- Derivatization: For metal ions without inherent chromophores, implement derivatization procedures using complexing agents such as 4-(2-pyridylazo)resorcinol (PAR) for transition metals or arsenazo III for rare earth elements.
- Filtration: Centrifuge or pass all samples through a 0.45 µm or 0.2 µm membrane filter to remove particulates that could damage the column or cause background interference [32].
- pH Adjustment: Adjust sample pH to optimize complex formation for derivatized metals or to maintain stable ionization states for inorganic ions.
Instrumental Parameters:
- Wavelength Selection: Based on the maximum absorbance of the target analyte or metal complex (e.g., 520-540 nm for PAR-metal complexes).
- Mobile Phase Optimization: Utilize phosphate or borate buffers for pH control with methanol or acetonitrile as organic modifiers, ensuring UV transparency at the detection wavelength.
- Column Selection: Employ C18 or C8 reversed-phase columns for most metal complexes; ion-pairing columns for ionic species.
Method Development for Conductivity Detection of Inorganic Ions
Sample Preparation Protocol:
- Dilution: Prepare samples in high-purity water (18 MΩ·cm resistivity) to minimize background conductivity.
- Matrix Elimination: Implement pretreatment procedures such as solid-phase extraction or precipitation to remove interfering organic matrices when analyzing environmental or biological samples.
- Filtration: Use 0.2 µm membrane filters specifically designed for ion analysis to prevent contamination with ionic impurities.
Instrumental Parameters for Ion Chromatography:
- Eluent Selection: Isocratic carbonate/bicarbonate mixtures (e.g., 1.7 mM NaHCO₃/1.8 mM Na₂CO₃) for anion analysis; methanesulfonic acid solutions for cation analysis.
- Suppressor Settings: When using suppressed conductivity detection, optimize suppressor current and regeneration schedule according to manufacturer specifications.
- Column Temperature: Maintain at 30-35°C for improved retention time reproducibility.
Quality Control Measures for RI Detection
Critical Stabilization Protocol:
- Temperature Equilibration: Allow the detector to thermally equilibrate for at least 2 hours before analysis, maintaining ambient temperature fluctuations within ±0.1°C.
- Mobile Phase Degassing: Implement rigorous helium sparging or online degassing to prevent bubble formation that causes baseline instability.
- System Purification: Flush the reference cell extensively with the mobile phase until a stable baseline is achieved (typically 30-60 minutes).
HPLC vs. UV-Vis Spectrophotometry for Inorganic Analysis
When evaluating analytical techniques for inorganic samples, researchers must consider the fundamental differences between HPLC with various detectors and standalone UV-Vis spectrophotometry. A comparative study of levofloxacin analysis demonstrated that HPLC provided superior accuracy in drug delivery system evaluation compared to UV-Vis spectrophotometry, with the latter showing limitations in accurately measuring drug concentrations in complex composite scaffolds [4].
Key Comparative Advantages of HPLC:
- Separation Capability: HPLC provides physical separation of complex mixtures before detection, eliminating spectral interferences from co-existing compounds [4].
- Specificity: With retention time as an additional identification parameter, HPLC offers higher specificity than direct spectrophotometric measurements [4].
- Quantitative Precision: HPLC typically demonstrates better reproducibility and precision, with relative standard deviation often below 1% for retention times and peak areas in modern UHPLC systems [30].
Key Comparative Advantages of UV-Vis Spectrophotometry:
- Simplicity and Speed: Direct spectrophotometric measurements require less sample preparation and are significantly faster for single-analyte determination.
- Cost Effectiveness: UV-Vis instrumentation has lower capital and maintenance costs compared to HPLC systems.
- Method Development Ease: Minimal method development is required for routine quantitative analysis of single components.
The decision between these techniques should be guided by sample complexity, required specificity, and available resources. For simple inorganic mixtures, direct UV-Vis may suffice, while complex samples or those requiring high specificity benefit from HPLC separation coupled with appropriate detection.
Research Reagent Solutions and Materials
Table 3: Essential Research Reagents for HPLC Analysis of Inorganics
| Reagent/Material | Function/Purpose | Application Notes |
|---|---|---|
| Ion-Pairing Reagents (e.g., Tetrabutylammonium salts) | Enable separation of ionic species on reversed-phase columns [4] | Critical for metal anion analysis; typically used at 5-20 mM concentration |
| Chromogenic Derivatization Agents (e.g., PAR, Dithizone) | Form UV-absorbing complexes with metal ions [31] | Essential for sensitive UV detection of non-absorbing metals; requires pH control |
| High-Purity Buffers (e.g., Ammonium formate, phosphate) | Mobile phase pH control and ion strength modification [30] | Must be HPLC grade; filter through 0.2 µm membrane to prevent system damage |
| HPLC-Grade Solvents (Methanol, Acetonitrile) | Mobile phase organic modifiers | Low UV cutoff essential for sensitive detection; acetonitrile preferred for low UV wavelengths |
| Ion Chromatography Eluents (Carbonate/Bicarbonate, MSA) | Mobile phase for ion exchange separations | Prepare daily from high-purity reagents; suppressors extend conductivity detector sensitivity |
Operational Workflows and Decision Pathways
The following workflow diagram illustrates the logical decision process for selecting an appropriate HPLC detector based on inorganic analyte characteristics:
Detector Selection Workflow for Inorganic Analysis
The selection of an appropriate HPLC detector for inorganic analysis represents a critical methodological decision that directly impacts analytical performance. UV-Vis detection offers excellent sensitivity for metal complexes and derivatized inorganics but requires specific analyte characteristics. Refractive Index detection provides universal response but with limited sensitivity and operational constraints. Conductivity detection delivers exceptional performance for ionic species and represents the gold standard for ion chromatography applications.
Within the broader context of analytical technique selection, HPLC with specialized detection provides distinct advantages over standalone UV-Vis spectrophotometry for complex inorganic samples, offering physical separation of components and enhanced specificity. As detector technologies continue to evolve, particularly with improved mass spectrometric interfaces and emerging detection principles, the capabilities for inorganic analysis by HPLC will further expand, solidifying its role as an indispensable tool in the analytical scientist's arsenal.
Strategic Method Selection and Real-World Application Scenarios
Ultraviolet-visible (UV-Vis) spectroscopy is an analytical technique that measures the amount of discrete wavelengths of UV or visible light that are absorbed by or transmitted through a sample in comparison to a reference or blank sample [1]. The fundamental principle is that light has a specific amount of energy inversely proportional to its wavelength. When this energy corresponds to the exact amount needed to promote electrons in a substance to a higher energy state, absorption occurs [1]. The technique directly provides information on what is in the sample and at what concentration, making it invaluable for quantitative analysis.
The instrumentation typically involves a light source (xenon lamp, or separate deuterium and tungsten/halogen lamps), a wavelength selector such as a monochromator, a sample holder, and a detector (photomultiplier tube or photodiode) to convert light into an electronic signal [1]. The output is typically presented as an absorption spectrum—a graph of absorbance versus wavelength—which can be used for both identification and quantification of substances based on Beer-Lambert's law [1].
Core Strengths and Ideal Applications for UV-Vis
UV-Vis spectroscopy offers distinct advantages that make it the preferred choice for specific analytical scenarios, particularly when compared to more complex techniques like High-Performance Liquid Chromatography (HPLC).
Key Advantages Driving Technique Selection
- Ease of Use and Reliability: UV-Vis spectrophotometers feature user-friendly designs with intuitive interfaces, making them accessible to personnel with minimal training. This translates to reduced training costs and seamless integration into daily workflows [33].
- Cost-Effectiveness: These instruments offer a compelling advantage in both initial investment and operational expenses, with low maintenance requirements and long-term durability contributing to their lifetime cost-effectiveness [33].
- High-Speed Analysis: UV-Vis provides results in a matter of seconds, enabling rapid quantification that is essential for high-throughput environments and quality control processes [33].
- Excellent Quantitative Accuracy: For target analytes, UV-Vis spectrophotometers achieve precise and accurate measurements with high sensitivity and resolution, reliably quantifying analytes across various concentrations [33].
When UV-Vis is the Preferred Technique
UV-Vis spectroscopy is the unequivocal choice in these specific scenarios:
- Analysis of Simple Mixtures: When the sample contains a single chromophore, or multiple chromophores with non-overlapping absorption peaks, UV-Vis provides straightforward, accurate quantification without need for separation [1].
- High-Throughput Quantitative Analysis: In applications requiring rapid analysis of many samples, such as bacterial culturing, nucleic acid purity checks, and beverage industry quality control, the speed of UV-Vis is unmatched [1] [33].
- Routine Concentration Measurements: For dedicated analysis of a specific compound in a known matrix, where the absorption characteristics are well-understood, UV-Vis offers a simple and robust solution [33].
Table 1: Comparative Analysis of UV-Vis and HPLC for Key Parameters
| Parameter | UV-Vis Spectroscopy | HPLC with UV Detection |
|---|---|---|
| Analysis Speed | Seconds to minutes [33] | Minutes to tens of minutes [4] |
| Sample Complexity | Ideal for simple mixtures or pure compounds [1] | Handles complex mixtures with multiple components [4] |
| Cost (Instrument & Operation) | Lower initial investment and operational costs [33] | Significantly higher capital and running costs |
| Ease of Use | User-friendly, minimal training required [33] | Requires significant technical expertise |
| Quantitative Accuracy | Excellent for target analytes in simple matrices [33] | Excellent, even in complex matrices [4] |
| Specificity | Limited; requires selective chromophores | High; combines separation with detection [4] |
Practical Experimental Protocols
Standard Methodology for UV-Vis Concentration Determination
This protocol details the general workflow for quantifying a target compound, such as Levofloxacin, using UV-Vis spectroscopy, adapted from published methodologies [4].
1. Wavelength Selection:
- Prepare standard solutions of the target analyte at high, medium, and low concentrations (e.g., 5, 25, and 50 µg/ml) in an appropriate solvent (e.g., simulated body fluid for pharmaceutical applications) [4].
- Fill a quartz cuvette with the standard solution. Note: Quartz is essential for UV analysis, as glass and plastic absorb UV light [1].
- Place a matched cuvette containing only the pure solvent in the reference beam to blank the instrument.
- Scan the standard solutions across the relevant wavelength range (e.g., 200–400 nm) using the spectrophotometer.
- Identify the wavelength of maximum absorbance (λmax) from the resulting absorption spectrum. For Levofloxacin, this is typically ~290 nm [4].
2. Calibration Curve Construction:
- Prepare a series of standard solutions covering the expected concentration range of the unknown samples (e.g., 0.05–300 µg/ml) [4].
- Measure the absorbance of each standard at the predetermined λmax against the blank.
- Plot absorbance (y-axis) versus concentration (x-axis). The data should yield a linear relationship. Perform linear regression to obtain an equation in the form of y = mx + c, where 'y' is absorbance, 'm' is the slope, 'x' is concentration, and 'c' is the y-intercept. A strong correlation (R² > 0.999) is desirable [4].
3. Sample Analysis and Quantification:
- Prepare the unknown sample in the same solvent as the standards.
- Measure its absorbance at the same λmax.
- Use the regression equation from the calibration curve to calculate the concentration of the target analyte in the unknown sample.
Detailed Workflow Visualization
The following diagram illustrates the core workflow of a UV-Vis spectroscopy experiment, from sample preparation to data analysis.
Essential Research Reagent Solutions
The following table lists key materials and reagents required for successful UV-Vis analysis, emphasizing the importance of material compatibility and purity.
Table 2: Essential Materials and Reagents for UV-Vis Analysis
| Item | Function / Critical Specification |
|---|---|
| Quartz Cuvettes | Sample holder; must be used for UV range analysis as quartz is transparent to most UV light, unlike glass or plastic [1]. |
| High-Purity Solvents | (e.g., Water, Buffers, Methanol). Dissolve and dilute samples; must be transparent in the wavelength range of interest to avoid interfering absorbance [4]. |
| Standard Reference Material | Highly pure analyte used to prepare calibration standards; purity is critical for accurate quantification [4]. |
| Buffer Salts | (e.g., KH₂PO₄). Maintain a stable pH environment for the analyte, which can affect its absorption spectrum [4]. |
Understanding the Limitations: When to Choose HPLC
Despite its advantages in simplicity and speed, UV-Vis spectroscopy has significant limitations that necessitate the use of HPLC in many research contexts, especially for inorganic samples or complex mixtures.
- Lack of Separation Power: The most critical limitation is the inability to separate mixture components. If a sample contains multiple chromophores with overlapping absorptions, UV-Vis cannot distinguish or individually quantify them. HPLC, in contrast, physically separates components before detection, providing unambiguous individual quantification [4] [33].
- Susceptibility to Interference: UV-Vis results can be easily skewed by interfering substances that absorb at the same wavelength as the target analyte, or by turbidity which causes light scattering [4]. This is a major drawback for complex biological or environmental samples.
- Lower Sensitivity and Specificity for Complex Samples: A direct comparative study on drug delivery systems highlighted that UV-Vis provided less accurate measurements of Levofloxacin concentration compared to HPLC when the drug was mixed with composite scaffold materials. The recovery rates for HPLC (96.37% - 110.96%) were more accurate and consistent than those for UV-Vis (96.00% - 99.50%) in this complex matrix [4].
The fundamental design differences between the instruments explain this disparity in performance. While both use similar detection principles, an HPLC UV detector is engineered for sensitivity in a small, precisely-aligned flow cell with a wide spectral bandpass to maximize light throughput. A stand-alone UV-Vis spectrophotometer prioritizes spectral resolution with a narrow bandpass and a larger sample cell, making it less sensitive for low-volume, low-concentration analytes typically analyzed in HPLC [34]. Therefore, for the analysis of inorganic species in complex matrices, or for any sample where interference is likely, HPLC is the unequivocally preferred and more accurate method [4].
High-Performance Liquid Chromatography (HPLC) is a cornerstone analytical technique in modern laboratories, playing a critical role in separating, identifying, and quantifying compounds in complex chemical mixtures across pharmaceutical, environmental, and life science research [35] [36]. For researchers and drug development professionals evaluating analytical methods, the choice between HPLC and Ultraviolet-Visible (UV-Vis) spectrophotometry is pivotal. While UV-Vis is a valuable technique for simple, chromophore-containing samples, HPLC provides a powerful solution for the intricate separations required in contemporary research on complex inorganic and organic samples [4] [35]. This guide details the specific scenarios where HPLC is the indispensable choice, framed within a broader evaluation of its advantages and limitations compared to UV-Vis.
Core Principles: How HPLC Manages Complexity
The Mechanism of Separation
HPLC operates on the principle of partitioning analytes between a pressurized liquid mobile phase and a stationary phase packed within a column [36]. The sample, carried by the mobile phase, interacts with the stationary phase; components within the mixture interact with this phase to varying degrees due to differences in their physiochemical properties such as size, charge, and polarity [36]. These differential interactions cause each compound to move through the column at a distinct speed, leading to their physical separation before reaching the detector [35] [36]. The result is a chromatogram, a graphical output where each separated component appears as a peak at a characteristic retention time, providing a detailed fingerprint of the sample's composition [35].
Key Instrumentation and Workflow
A standard HPLC system comprises four major hardware components [36] [5]:
- Pump: Drives the mobile phase through the system at a stable, high pressure.
- Autosampler: Precisely injects the sample into the mobile phase stream.
- Chromatographic Column: The core separation unit packed with a high-efficiency stationary phase.
- Detector: Measures the eluted analytes, generating a signal proportional to concentration.
The general workflow involves the mobile phase beginning to flow, sample injection, compound separation on the column, analyte detection, and final chromatogram generation by a chromatography data system (CDS) [36].
HPLC vs. UV-Vis: A Quantitative Comparison for Complex Samples
The fundamental distinction between HPLC and UV-Vis is that HPLC separates a mixture before measurement, whereas UV-Vis analyzes the entire sample without separation. This makes UV-Vis susceptible to interference from other absorbing substances in the sample, a significant drawback for complex matrices [4].
A direct comparison study investigating Levofloxacin released from a composite scaffold highlights these differences conclusively [4].
Table 1: Quantitative Method Comparison for Levofloxacin Analysis
| Parameter | HPLC Method | UV-Vis Method |
|---|---|---|
| Regression Equation | y = 0.033x + 0.010 | y = 0.065x + 0.017 |
| Linearity (R²) | 0.9991 | 0.9999 |
| Recovery (5 µg/ml) | 96.37 ± 0.50% | 96.00 ± 2.00% |
| Recovery (25 µg/ml) | 110.96 ± 0.23% | 99.50 ± 0.00% |
| Recovery (50 µg/ml) | 104.79 ± 0.06% | 98.67 ± 0.06% |
| Key Finding | Preferred for sustained-release characterization; accurate in complex scaffolds [4]. | Not accurate for measuring drugs loaded on biodegradable composites [4]. |
The data shows that while both methods can demonstrate excellent linearity, the recovery rates for HPLC, especially at medium and high concentrations, showed greater variability. The study concluded that UV-Vis is not accurate for measuring drug concentration in complex, scaffold-based drug-delivery systems due to impurity interference, establishing HPLC as the preferred method for such applications [4].
When HPLC is the Unambiguous Choice
Scenario 1: Samples with Co-eluting Interferences
HPLC is mandatory when the target analyte lacks a unique chromophore or when other matrix components absorb at similar wavelengths as the analyte. UV-Vis cannot distinguish between different compounds that absorb light at the same wavelength, leading to inaccurate results [4] [25]. HPLC's physical separation step resolves this by isolating the analyte from interferents before detection.
Scenario 2: Requirement for Multi-Component Quantitation
When a sample contains multiple analytes of interest that need to be identified and quantified individually, HPLC with a versatile detector like UV or MS is the optimal tool. It generates a profile where each component is resolved, whereas UV-Vis can typically only provide a single, combined measurement for the whole sample [30].
Scenario 3: Need for High Specificity and Confidence
Coupling HPLC to Mass Spectrometry (LC-MS) provides unsurpassed specificity and sensitivity. The mass spectrometer detects analytes based on their mass-to-charge ratio (m/z), providing an unambiguous molecular signature that confirms identity even for co-eluting peaks [35] [30]. This makes LC-MS the standard for bioanalytical testing, trace residue analysis, and life science research [35] [30].
Scenario 4: Analysis of Ionizable Compounds
HPLC offers powerful control over the separation of ionizable compounds through mobile phase pH adjustment. Modifying the pH can dramatically alter the retention and selectivity for acids and bases, enabling the fine-tuning needed to separate complex mixtures of ionic species [37]. This level of control is absent in basic UV-Vis analysis.
Experimental Protocols: Implementing an HPLC Method for Complex Mixtures
Method Development and Optimization
Developing a robust HPLC method for a complex mixture requires systematic optimization of several parameters [35]:
- Column Chemistry Selection: The choice of stationary phase is paramount. While C18 columns are a common starting point, specialized columns (e.g., HILIC for polar compounds, chiral for enantiomers, ion-exchange for charged molecules) can dramatically improve separation based on analyte properties [35].
- Mobile Phase Optimization: For complex samples, a gradient elution is typically used. This involves programming a change in the mobile phase composition (e.g., increasing the percentage of organic solvent over time) to elute components with a wide range of polarities effectively [35] [36].
- pH Control: For ionizable analytes, using a buffered mobile phase and adjusting the pH is a powerful tool to control retention and selectivity. To ensure robustness, the mobile-phase pH should be at least 1.5 pH units away from the analyte's pKa [37].
- Temperature: Controlling the column temperature affects the viscosity of the mobile phase and analyte interactions, which can improve peak shape and reproducibility [35].
Detailed Protocol: Analysis of a Drug in a Composite Scaffold
The following methodology is adapted from a study comparing HPLC and UV-Vis for Levofloxacin analysis [4].
1. Equipment and Reagents:
- HPLC System: Shimadzu liquid chromatograph with LC-2010AHT pump, CBM-20A controller, and UV-Vis detector.
- Column: Sepax BR-C18 column (250 × 4.6 mm; 5 µm particle diameter).
- Chemicals: Levofloxacin standard, Ciprofloxacin (internal standard), HPLC-grade methanol, KH₂PO₄, tetrabutylammonium hydrogen sulphate.
- Other: High-speed centrifuge, ultrasonic cleaner, analytical balance.
2. Chromatographic Conditions [4]:
- Mobile Phase: A mixture of 0.01 mol/L KH₂PO₄, methanol, and 0.5 mol/L tetrabutylammonium hydrogen sulphate (75:25:4, v/v).
- Flow Rate: 1.0 mL/min.
- Column Temperature: 40°C.
- Detection Wavelength: 290 nm.
- Injection Volume: 10 µL.
3. Sample Preparation:
- Precisely weigh 30.00 mg of Levofloxacin standard and dissolve in simulated body fluid (SBF) in a 10 mL volumetric flask to make a 3 mg/mL stock solution.
- Serially dilute the stock solution with SBF to create standard solutions across the required concentration range (e.g., 0.05–300 µg/mL).
- For the internal standard, prepare a 500 µg/mL solution of Ciprofloxacin in methanol.
4. Sample Pre-Treatment (for complex matrices):
- Add 10 µL of the standard or unknown sample solution to 100 µL of blank SBF.
- Add 10 µL of the Ciprofloxacin internal standard solution.
- Vortex-mix the solution for 5 minutes.
- Add 800 µL of dichloromethane, vortex-mix for another 5 minutes, and centrifuge at 7,155 × g for 5 minutes at 25°C.
- Extract 750 µL of the supernatant, dry it under a nitrogen stream in a 50°C water bath, and reconstitute the residue for injection [4].
5. Data Analysis:
- Construct a calibration curve by plotting the peak area ratio of Levofloxacin to the internal standard against the known concentration of Levofloxacin standards.
- Use the regression equation from the calibration curve to calculate the concentration of Levofloxacin in unknown samples.
Advanced Techniques for Extreme Complexity
For exceptionally complex samples, such as those in proteomics or natural product extracts, advanced HPLC techniques are employed:
- Two-Dimensional Liquid Chromatography (2D-LC): This technique uses two different separation mechanisms (e.g., reverse-phase followed by HILIC) in a single analysis, achieving a peak capacity unattainable with a single column [35] [30].
- Ultra-High-Performance Liquid Chromatography (UHPLC): UHPLC uses columns packed with smaller particles (<2 µm) and systems capable of withstanding pressures beyond 1000 bar, providing higher resolution, sensitivity, and faster analysis times compared to standard HPLC [30] [36].
Essential Reagents and Materials
The following table lists key reagents and materials required for setting up and performing HPLC analysis, as exemplified in the protocol above.
Table 2: Research Reagent Solutions for HPLC Analysis
| Reagent/Material | Function in the Analysis | Example from Protocol |
|---|---|---|
| Chromatographic Column | The core separation unit containing the stationary phase. | Sepax BR-C18 column (250 x 4.6 mm, 5 µm) [4]. |
| Analytical Standards | Used for calibration and quantification of the target analyte. | Levofloxacin reference standard [4]. |
| Internal Standard | Added to samples to correct for variability in sample preparation and injection. | Ciprofloxacin solution [4]. |
| HPLC-Grade Solvents | Used to prepare the mobile phase; high purity is critical to minimize baseline noise and damage to the column. | Methanol [4]. |
| Buffer Salts | Used to prepare the aqueous component of the mobile phase, controlling pH and ionic strength. | KH₂PO₄, tetrabutylammonium hydrogen sulphate [4]. |
Workflow and Decision Pathway
The following diagram illustrates the logical workflow for HPLC analysis and the decision-making process for method selection.
Diagram 1: Analytical Method Selection and HPLC Workflow
Advantages and Limitations in Context
The Prominent Advantages of HPLC
- High Separation Efficiency: Small particle stationary phases yield high theoretical plate numbers and resolution, effectively separating complex matrices [30] [5].
- Broad Applicability: Suitable for a wide range of compounds, including thermally unstable, non-volatile, and high-molecular-weight molecules that are not amenable to gas chromatography [30] [5].
- Excellent Qualitative and Quantitative Capability: Provides precise and accurate quantification of multiple components in a single run, which is essential for quality control and stability testing in the pharmaceutical industry [30].
- Superior Specificity with Hyphenated Detectors: Coupling with mass spectrometry (LC-MS) provides unambiguous identification and is rapidly becoming the standard for bioanalytical testing and trace analysis [35] [30].
The Practical Limitations of HPLC
- High Cost: Instruments, columns, and high-purity organic solvents contribute to significant capital and operational expenses [5].
- High Solvent Consumption and Environmental Impact: Large volumes of solvents like acetonitrile and methanol are used, necessitating waste management and driving interest in "green chromatography" approaches [5].
- Operational Complexity and Regulatory Burden: Method development, maintenance, and troubleshooting require skilled personnel. Testing in regulated environments (GMP) can be arduous due to stringent documentation and validation requirements [30] [5].
For the analysis of complex mixtures requiring separation, High-Performance Liquid Chromatography is an unambiguous and essential choice. Its power to physically resolve components before detection grants it a definitive edge over non-separative techniques like UV-Vis spectrophotometry, especially in the presence of interfering substances or for multi-analyte quantification [4] [30]. While considerations of cost, operational complexity, and environmental impact are valid, the strengths of HPLC—particularly its high resolution, broad applicability, and unparalleled specificity when coupled with MS—solidify its role as an indispensable pillar of modern analytical chemistry. For researchers and drug development professionals, mastering HPLC is key to unlocking the molecular puzzles in today's most challenging samples.
Sample Preparation Protocols for Aqueous Inorganic Samples
The preparation of aqueous inorganic samples for instrumental analysis is a critical and often time-consuming stage of the entire analytical process, with the greatest impact on the reliability of the final results [38]. The core challenges in analyzing such samples typically involve a complex matrix, low analyte concentrations, and the presence of interferents that can obstruct accurate detection and quantification. Sample preparation primarily aims to concentrate the analytes of interest, isolate them from the sample matrix, and remove potential interferents, sometimes also involving a change of the sample matrix or derivatization of the analytes to make them detectable [38]. Within the context of pharmaceutical and environmental research, the choice of analytical technique—be it High-Performance Liquid Chromatography (HPLC) or Ultraviolet-Visible spectroscopy (UV-Vis)—is profoundly influenced by the effectiveness of these preliminary sample preparation steps. The subsequent analysis can only be as good as the sample preparation allows, making robust, reproducible protocols essential for generating valid data in research on inorganic compounds [38] [27].
This guide frames sample preparation protocols within a broader technical comparison of HPLC and UV-Vis methodologies, highlighting how the sample matrix and preparation complexity often dictate the choice of analytical technique.
Fundamental Principles of Sample Preparation
Techniques for preparing liquid samples can be broadly divided into those based on liquid-phase extraction and those based on solid-phase extraction (SPE) [38]. In recent years, SPE and its variations have become the main direction of development, largely due to the wide range of available sorbents and the potential for miniaturization and automation.
The core principle of solid-phase extraction involves passing the aqueous sample through a cartridge or device containing a sorbent material. Analytes are selectively retained on the sorbent based on chemical interactions, while the sample matrix and interferents are washed away. The analytes are then eluted with a small volume of a suitable solvent, resulting in a cleaned and concentrated sample ready for analysis [38]. The selection of the sorbent material is paramount, as its properties—such as specific surface area, pore size, and chemical functionality—directly determine the efficiency and selectivity of the extraction process.
Core Sample Preparation Techniques
Solid-Phase Extraction (SPE) and Its Variations
Solid-Phase Extraction is the cornerstone technique for preparing aqueous samples. Its fundamental steps are illustrated in the workflow below.
The following techniques represent specific implementations and advancements of the core SPE principle:
- Magnetic Solid-Phase Extraction (MSPE): This technique utilizes sorbents with magnetic properties, such as magnetic nanoparticles coated with a selective material. The sorbent is dispersed in the sample solution, allowing for rapid extraction due to high surface area. After extraction, the sorbent is easily retrieved from the solution using an external magnet, simplifying the separation process and eliminating the need for centrifugation or filtration [38].
- Solid-Phase Microextraction (SPME): A solvent-free technique where a small fiber coated with a sorbent is exposed to the sample. Analytes are absorbed onto or adsorbed into the coating. The fiber is then transferred directly to the analytical instrument (e.g., an HPLC injector) for desorption and analysis. SPME is known for its simplicity and minimal sample volume requirements [38].
- Matrix Solid-Phase Dispersion (MSPD): This technique is particularly useful for solid, semi-solid, or viscous samples. The sample is homogenized with a solid sorbent material, creating a blended mixture that is then packed into a column. The column is subsequently washed and eluted similarly to conventional SPE, achieving both sample disruption and extraction in a single step [38].
- Stir Bar Sorptive Extraction (SBSE): A larger amount of sorbent is coated on a magnetic stir bar. The bar is placed in the sample and stirred for a predetermined time, allowing analytes to partition into the coating. Like SPME, it is a passive, solvent-free technique but offers higher recovery for very dilute analytes due to the greater volume of the extracting phase [38].
The Role of Metal-Organic Frameworks (MOFs) as Sorbents
A significant advancement in solid-phase extraction is the application of Metal-Organic Frameworks (MOFs). MOFs are crystalline porous materials consisting of metal ions or clusters connected by organic linkers, resulting in structures with exceptionally high specific surface areas (up to ~7000 m²/g), tunable pore sizes, and a theoretically wide possibility of modification [38].
- Advantages: Their high surface area and tunable chemistry make MOFs highly efficient sorbents. Their structure can be designed to selectively interact with specific inorganic ions or molecules, enhancing both the recovery and selectivity of the sample preparation process [38].
- Challenges: Some MOFs can exhibit lower stability in aqueous environments compared to traditional sorbents like silica-based C18. However, research is focused on developing water-stable MOFs (e.g., using Zr⁴⁺, Cr³⁺) and composites to overcome this limitation [38].
The Scientist's Toolkit: Essential Research Reagent Solutions
The following table details key materials and reagents required for implementing the sample preparation techniques described in this guide.
Table 1: Essential Research Reagents and Materials for Sample Preparation
| Reagent/Material | Function/Description | Common Examples & Applications |
|---|---|---|
| Metal-Organic Frameworks (MOFs) | High-surface-area sorbents for selective extraction; the metal cluster and organic linker can be tailored for specific analytes. | Zirconium-based (e.g., UiO-66) for water stability; Iron-based for magnetic separation (MSPE) [38]. |
| Silica-Based Sorbents (C18) | Reverse-phase sorbent for retaining non-polar to moderately polar analytes from aqueous samples. | Standard SPE cartridges for general-purpose cleaning and concentration [4] [17]. |
| Ion-Exchange Resins | Sorbents that retain analytes based on electrostatic interactions; suitable for charged inorganic species. | Cation-exchange resins for metal ions; Anion-exchange resins for oxyanions [17]. |
| Simulated Body Fluid (SBF) | Aqueous solution with ion concentrations similar to human blood plasma; used for in-vitro release studies. | Used in pharmaceutical research to study drug release from scaffolds and implants [4]. |
| Internal Standards | A compound added in a constant amount to samples and calibrants to correct for analytical variability. | Ciprofloxacin was used as an internal standard in an HPLC method for Levofloxacin [4]. |
| Derivatization Reagents | Chemicals that react with analytes to produce derivatives with more favorable detection properties. | Used in HPLC to allow UV or FLD detection of non-chromophoric compounds like Gabapentin [39]. |
HPLC versus UV-Vis: A Technical Comparison Guided by Sample Preparation
The choice between HPLC and UV-Vis spectroscopy is fundamentally dictated by the complexity of the sample and the required specificity of the analysis. The sample preparation protocol must be designed with the final analytical technique in mind.
Ultraviolet-Visible (UV-Vis) Spectroscopy
UV-Vis is a straightforward, cost-effective technique that measures the absorption of light by an analyte in solution.
- Principle and Best Use Cases: It operates on Beer's law, where absorbance is proportional to concentration. UV-Vis is ideal for routine quality control of simple, single-component samples where the analyte has a distinct chromophore and there is minimal risk of spectral interference from the matrix [27] [9].
- Impact of Sample Preparation: For UV-Vis, sample preparation is critical to ensure specificity. Since the technique provides no separation, any co-extracted interferent that absorbs at the same wavelength will lead to positively biased, inaccurate results. Preparation must therefore focus on achieving a very clean extract, often requiring highly selective sorbents like certain MOFs [27].
High-Performance Liquid Chromatography (HPLC)
HPLC separates the components of a mixture before detection, typically using a UV-Vis, fluorescence, or mass spectrometric detector.
- Principle and Best Use Cases: The sample is carried by a mobile phase through a column packed with a stationary phase. Analytes separate based on their different interactions with these two phases. HPLC is the preferred method for complex mixtures, impurity profiling, and stability-indicating assays because it can resolve the target analyte from other sample components [4] [17] [27].
- Impact of Sample Preparation: The primary role of sample preparation for HPLC is to protect the column and instrument from damage or clogging and to concentrate the analyte to a detectable level. Because HPLC provides separation, the sample preparation does not need to achieve the same degree of selectivity as for direct UV-Vis analysis. It can be viewed as a "clean-up" and concentration step, making techniques like generic SPE highly effective [4] [38].
Quantitative Comparison of HPLC and UV-Vis Performance
A direct comparison from a study on Levofloxacin release from a composite scaffold clearly demonstrates the performance difference between the two techniques.
Table 2: Quantitative Comparison of HPLC and UV-Vis for Levofloxacin Analysis [4]
| Parameter | HPLC Method | UV-Vis Method |
|---|---|---|
| Regression Equation | y = 0.033x + 0.010 | y = 0.065x + 0.017 |
| Linearity (R²) | 0.9991 | 0.9999 |
| Recovery (Low Conc.) | 96.37 ± 0.50% | 96.00 ± 2.00% |
| Recovery (Medium Conc.) | 110.96 ± 0.23% | 99.50 ± 0.00% |
| Recovery (High Conc.) | 104.79 ± 0.06% | 98.67 ± 0.06% |
| Key Conclusion | Preferred method; accurate for complex scaffold release. | Not accurate for measuring drugs loaded on biodegradable composites. |
The data shows that while both methods can exhibit excellent linearity, the recovery rates for HPLC, especially at medium and high concentrations, can be more variable in complex matrices. However, the study concludes that UV-Vis is not accurate for measuring drug concentrations in complex, multi-component systems like biodegradable composite scaffolds because it lacks the selectivity to distinguish the analyte from other interfering substances that may leach from the scaffold material [4]. HPLC, with its separation power, is therefore the definitive method for such challenging analyses.
Detailed Experimental Protocols
Protocol 1: Solid-Phase Extraction for Sample Clean-Up
This is a generalized protocol for using a classic SPE cartridge, adaptable for various sorbents including silica-based C18 or MOF-packed cartridges.
- Conditioning: Sequentially pass ~5 mL of methanol and ~5 mL of water (or a buffer matching the sample pH) through the cartridge to solvate the sorbent and create a conducive environment for analyte retention. Do not allow the sorbent to dry out.
- Sample Loading: Load the aqueous sample onto the cartridge at a slow, controlled flow rate (e.g., 1-5 mL/min) to maximize contact time and ensure efficient retention of the analyte.
- Washing: Pass 5-10 mL of a wash solution (e.g., water or a mild buffer with 5-10% organic solvent) through the cartridge to remove weakly retained matrix components and interferents without eluting the target analyte.
- Elution: Elute the purified analytes into a clean collection tube using 1-5 mL of a strong solvent (e.g., pure methanol, acetonitrile, or a buffered solution with a high organic content). This step should be done as slowly as possible to ensure complete recovery.
- Reconstitution (if needed): If the eluate requires further concentration or a solvent change for analysis, evaporate the solvent under a gentle stream of nitrogen in a warm water bath (e.g., 50°C) and reconstitute the residue in an appropriate volume of the mobile phase or solvent compatible with the analytical instrument [4] [38].
Protocol 2: Sample Preparation for HPLC Analysis of an Inorganic Compound in a Complex Matrix
This protocol is inspired by methods used to analyze drugs released from composite scaffolds, a scenario relevant to inorganic biomaterials [4].
- Sample Collection: Collect the release medium (e.g., Simulated Body Fluid) at predetermined time points.
- Internal Standard Addition: Add a known volume of an internal standard solution (e.g., Ciprofloxacin) to a known volume of the release medium. This corrects for any losses during subsequent preparation steps and instrumental variability [4].
- Protein Precipitation / Clean-Up:
- Add a volume of an organic solvent like dichloromethane to the sample.
- Vortex-mix the solution thoroughly for 5 minutes.
- Centrifuge the mixture at high speed (e.g., 7,155 × g) for 5 minutes to separate the phases [4].
- Concentration: Extract the organic supernatant and evaporate it to dryness under a stream of nitrogen in a 50°C water bath.
- Reconstitution: Reconstitute the dry residue in a small, precise volume (e.g., 100 µL) of the HPLC mobile phase to concentrate the sample and ensure compatibility with the chromatographic system [4].
- Filtration: Finally, filter the reconstituted sample through a 0.22 µm membrane filter into an HPLC vial to remove any particulate matter that could damage the HPLC column.
Decision Framework for Technique Selection
The choice between HPLC and UV-Vis, and the corresponding sample preparation strategy, can be logically navigated using the following decision pathway.
The preparation of aqueous inorganic samples is a foundational step that dictates the success of subsequent analytical measurements. While traditional techniques like SPE remain vital, the emergence of advanced sorbent materials like Metal-Organic Frameworks offers unprecedented opportunities for enhancing selectivity and efficiency. The critical choice between HPLC and UV-Vis spectroscopy is guided by the sample's complexity: UV-Vis offers speed and economy for simple, well-defined matrices but requires near-absolute sample cleanliness, whereas HPLC provides the necessary separation power and specificity for complex samples, relying on sample preparation more for clean-up and concentration. By aligning a well-designed sample preparation protocol with the appropriate analytical technique, researchers and drug development professionals can ensure the generation of accurate, reliable, and meaningful data for their inorganic sample research.
Water is the most utilized material in the pharmaceutical industry, serving as an excipient, a cleaning agent, and a base for product formulations [40] [41]. The presence of ionic impurities in pharmaceutical water represents a critical quality risk, as they can compromise product safety, stability, and efficacy. Consequently, monitoring these impurities is mandatory under various pharmacopoeias, including the United States Pharmacopeia (USP), European Pharmacopoeia (EP), and Japanese Pharmacopoeia (JP) [41].
This case study examines the analytical techniques used to ensure water purity, focusing specifically on the detection and quantification of ionic contaminants. It is framed within a broader research thesis comparing the pros and cons of High-Performance Liquid Chromatography (HPLC) and UV-Vis Spectroscopy for inorganic sample analysis. We will explore the theoretical foundations, applicable methodologies, and practical considerations for each technique in this highly regulated environment.
Regulatory Framework and Critical Quality Attributes
Pharmaceutical water is categorized based on its intended use (e.g., Purified Water, Water for Injection), with specifications defined in compendial monographs [41]. While several parameters are monitored, ionic impurity detection primarily relies on two key tests:
- Conductivity: A non-specific, direct measure of the water's ability to carry an electric current, which is proportional to the total concentration of ions present [40] [41]. This is a fundamental and required test.
- Total Organic Carbon (TOC): Measures the amount of organic carbon-containing compounds, which serves as an indicator of chemical and microbiological contamination [40] [41].
For the specific identification and quantification of individual ions, HPLC is the preferred analytical technique.
Analytical Technique 1: Direct Conductivity Testing
Conductivity is defined by the USP as "a measure of the ion-facilitated electron flow through it" [41]. It serves as a robust, compendial test for detecting inorganic impurities such as residual salts (e.g., chlorides, phosphates) and minerals (e.g., calcium, magnesium) [40].
Experimental Protocol for Conductivity
Principle: The method measures the electrical conductivity of water, which increases with the concentration of dissolved ions. Instrumentation: In-line conductivity sensor or portable conductivity meter. Procedure:
- System Calibration: Calibrate the conductivity meter using standard solutions of known conductivity.
- Sample Collection: Collect water samples from designated points of use (POU) in the water system. Precautions must be taken to avoid contamination: sample valves should be sanitized, flushed with an appropriate volume of water, and samples should be collected in sterile containers [41].
- Measurement:
- For in-line sensors, record the conductivity value directly from the monitoring system.
- For off-line analysis, immerse the sensor in a representative sample and record the stabilized reading.
- Data Analysis: Compare the results against the pharmacopoeial limits, which are staged to account for temperature-dependent variability.
Key Advantages and Limitations
Advantages:
- Rapid and Real-Time: Allows for continuous, real-time verification of water purity [40].
- Non-Destructive: The sample remains unchanged and can be used for further testing.
- High Precision: Provides highly reproducible results for quality control.
Limitations:
- Non-Specific: Cannot identify specific ionic species, only indicates the total ionic content [41].
- Incomplete Picture: Must be used in conjunction with other tests like TOC and microbiological monitoring to fully assess water quality.
Analytical Technique 2: HPLC for Specific Ion Analysis
When conductivity testing indicates an out-of-specification (OOS) result or for targeted analysis, HPLC is employed for its superior resolution and specificity. HPLC is a dominant analytical technique that separates components in a mixture based on their differential partitioning between a stationary phase and a mobile phase pumped at high pressure [5] [30].
Experimental Protocol for Ion Analysis by HPLC
Principle: Ions in the sample interact differently with the chromatographic column's packing material, causing them to elute at different retention times, allowing for individual identification and quantification. Instrumentation and Reagents:
- HPLC System: Equipped with a high-pressure pump, autosampler, and a conductivity detector or other suitable detector like UV-Vis for certain ions [5].
- Chromatographic Column: A dedicated ion-exchange column or a suitable reversed-phase column with an ion-pairing reagent.
- Mobile Phase: A carefully prepared buffer solution, such as potassium dihydrogen phosphate, which is filtered and degassed prior to use [42].
- Standard Solutions: High-purity reference standards of the target ions for calibration.
Procedure:
- Mobile Phase Preparation: Prepare the mobile phase as per the validated method. For example, a phosphate buffer may be used and its pH adjusted with a reagent like ortho-phosphoric acid [42].
- System Equilibration: Pass the mobile phase through the column until a stable baseline is achieved.
- Calibration: Inject a series of standard solutions with known concentrations of the target ions to establish a calibration curve. The linearity range is typically validated, for example, from 5–25 μg/ml for certain compounds [42].
- Sample Analysis: Inject the prepared water sample. The system software records the signal, generating a chromatogram where each peak corresponds to a different ion.
- Data Integration and Reporting: The area under each peak is integrated and the concentration of the corresponding ion is calculated using the calibration curve.
The following diagram illustrates the core workflow of an HPLC analysis for ionic impurities.
Key Advantages and Limitations of HPLC
Advantages:
- High Specificity: Can separate, identify, and quantify individual ionic species in a mixture [5] [30].
- Excellent Sensitivity: Capable of detecting trace levels of impurities, often down to microgram per liter (ppb) levels [5].
- Precision and Robustness: Delivers highly reproducible and reliable data, which is essential for quality control and regulatory compliance [30].
Limitations:
- High Cost: Instruments, columns, and high-purity solvents are expensive [5].
- Operational Complexity: Method development and maintenance require skilled personnel [5] [30].
- Environmental Impact: Traditional methods can consume large volumes of organic solvents, contributing to waste [5] [43].
- Sample Preparation: Often requires filtration to prevent column damage [5].
Comparative Analysis: HPLC vs. UV-Vis for Inorganic Analysis
Within the context of inorganic sample analysis, the choice between HPLC and UV-Vis spectroscopy depends heavily on the analytical goal. The table below summarizes the core differences relevant to this case study.
Table 1: Comparison of HPLC and UV-Vis for Inorganic Impurity Analysis
| Feature | HPLC | UV-Vis Spectroscopy |
|---|---|---|
| Analytical Scope | Multi-analyte separation and specific identification of individual ions [5] | Primarily single-analyte or aggregate measurement; non-specific for ionic mixtures [1] |
| Specificity | High (separates co-eluting ions) [30] | Low for mixtures (spectra can overlap) [1] |
| Sensitivity | High (suitable for trace-level analysis) [5] | Moderate to High (depends on the analyte's molar absorptivity) [1] |
| Quantitative Precision | Excellent (highly precise and reproducible) [30] | Good (follows Beer-Lambert's Law) [1] |
| Operational Workflow | Complex (requires method development, skilled operators) [5] | Simple (fast and easy to operate) [1] |
| Cost & Environmental Impact | High (costly equipment, solvent consumption, waste generation) [5] | Lower (more affordable instrumentation, minimal solvent use) [1] |
| Ideal Use Case | Identifying and quantifying specific, unknown ionic contaminants. | Quantifying a single, known ion that has a characteristic UV-Vis absorption. |
UV-Vis spectroscopy measures the absorption of ultraviolet or visible light by a sample. Its fundamental principle is the Beer-Lambert Law, which relates absorbance to the concentration of the absorbing species [1]. While exceptionally useful for organic compounds with chromophores, its application for direct inorganic ion analysis is limited. Most simple ions do not absorb significantly in the UV-Vis range, making direct analysis challenging without derivatization—using a chemical reaction to form a colored, light-absorbing complex with the target ion [1]. This adds steps, time, and potential sources of error to the analysis.
The Scientist's Toolkit: Essential Research Reagents and Materials
Successful analysis of ionic impurities requires precise materials and reagents. The following table details key items used in the featured experiments.
Table 2: Key Research Reagents and Materials for Ionic Impurity Analysis
| Item | Function / Explanation |
|---|---|
| Reference Standards | High-purity compounds (e.g., specific salt ions) used to calibrate the analytical instrument, ensuring accurate quantification [42]. |
| Potassium Dihydrogen Phosphate | A common buffer salt used in mobile phase preparation for HPLC to maintain a stable pH, crucial for reproducible separation [42]. |
| Ortho-Phosphoric Acid | Used for precise pH adjustment of the aqueous mobile phase in HPLC methods, affecting the retention time and separation of ions [42]. |
| HPLC-Grade Solvents | High-purity solvents (e.g., acetonitrile, methanol) and water used to prepare mobile phases, minimizing background interference and baseline noise [5] [42]. |
| Ion-Exchange / Chromatographic Column | The core component where the physical separation of different ions occurs based on their chemical interactions with the stationary phase [5]. |
| Conductivity Standard Solutions | Solutions of known conductivity (e.g., potassium chloride) used to calibrate conductivity meters for accurate total ionic content measurement [41]. |
| Sterile Sample Containers | Vials and bottles designed to prevent the introduction of external contaminants during water sample collection [41]. |
The analysis of ionic impurities in pharmaceutical water is a non-negotiable pillar of drug safety and quality. This case study demonstrates that conductivity testing and HPLC are not competing but complementary techniques. Conductivity serves as an excellent, real-time holistic monitor for general ionic purity, while HPLC provides the specific, definitive identification required for root-cause analysis when deviations occur.
Framed within the broader thesis on analytical techniques, the choice between HPLC and UV-Vis for inorganic samples becomes clear. HPLC is unparalleled in its ability to deconvolute complex mixtures of ions, making it indispensable for targeted impurity analysis despite its higher cost and operational complexity. UV-Vis spectroscopy, while simpler and more cost-effective, lacks the inherent specificity for multi-ionic analysis and often requires sample manipulation for inorganic applications.
The future of this field lies in the adoption of Green Analytical Chemistry (GAC) principles, which aim to reduce the environmental impact of HPLC methods by using alternative solvents, miniaturizing systems, and reducing waste [43]. As the industry continues to prioritize sustainability, the development and implementation of these greener HPLC practices will be crucial for maintaining the highest standards of water quality control in an environmentally responsible manner.
The accurate quantification of metal ions is a critical aspect of pharmaceutical development and quality control. Metal ions can originate from catalysts, reagents, or processing equipment in drug substances and products, potentially affecting stability, efficacy, and safety. This case study examines two predominant analytical techniques for metal ion determination: High-Performance Liquid Chromatography (HPLC) and Ultraviolet-Visible (UV-Vis) Spectroscopy. The analysis is framed within a broader investigation of the advantages and limitations of each technique specifically for inorganic samples, providing drug development professionals with evidence-based guidance for method selection.
The fundamental challenge in analyzing metal ions lies in their typically low concentrations and the complex matrices of pharmaceutical formulations. Techniques that leverage metal complexation reactions offer pathways to overcome these challenges, transforming non-chromophoric or electrochemically inactive metal species into detectable analytes [44]. This evaluation assesses how HPLC and UV-Vis spectroscopy meet these challenges through distinct mechanistic approaches.
Theoretical Foundations of Metal Ion Detection
Metal-Ligand Coordination Chemistry
Transition metal ions rarely exist as free aquated ions in analytical systems but instead form coordination complexes with electron-donating ligands. These complexes consist of a central metal atom or ion surrounded by bound molecules or anions known as ligands [44]. The metallic components are typically drawn from transition metals classified as d-block and f-block elements, while ligands encompass a diverse array of species including simple ions, molecules, or chelating groups [44].
The analytical utility of these complexes stems from their distinct molecular geometries and resulting electrochemical, photophysical, and spectroscopic properties [44]. In solution, metal ions attract and bind other molecules, forming coordination complexes that enable various detection strategies [45].
Spectroscopic Transitions in Metal Complexes
UV-Vis detection of metal complexes relies on specific electronic transitions that occur when photons interact with the complex:
Charge Transfer Transitions: These involve electron excitation between the metal and ligand orbitals. Ligand-to-Metal Charge Transfer (LMCT) occurs when an electron moves from the ligand to the metal, while Metal-to-Ligand Charge Transfer (MLCT) involves the reverse process [45]. These transitions interact with photons very efficiently, producing strong absorbances.
d-d Transitions: These involve electron excitation between different d orbitals within the metal ion [45]. While requiring less energy than charge transfer transitions, d-d transitions occur relatively infrequently and yield weak absorbances.
The counterintuitive relationship between these transitions means d-d transitions require little energy but give weak signals, while MLCT transitions require more energy but produce stronger absorbances [45]. This fundamental understanding guides the selection of appropriate ligands for enhancing detection sensitivity.
HPLC Methodology for Metal Ion Analysis
Separation Mechanisms
HPLC separates metal ions by leveraging their different affinities for stationary and mobile phases after conversion to detectable complexes. Ion-exchange chromatography represents the most common approach, utilizing charged stationary phases to separate ionic species [46]. Strong-base anion-exchange columns are particularly effective under alkaline conditions where metal complexes exist as oxyanion derivatives separable by High-Performance Anion Exchange Chromatography (HPAEC) [46].
Alternative separation mechanisms include ligand-exchange chromatography which takes advantage of facile generation of different on-column counter-ions that alter selectivity [46]. This approach allows optimization for either monosaccharides or disaccharides and polysaccharides by selecting appropriate counter-ions such as H⁺, lead, strontium, silver, or calcium [46].
Detection Systems
UV-Vis Detection: The most common detection method for metal complexes, utilizing their intrinsic chromophoric properties [44]. This approach provides good sensitivity for complexes with high extinction coefficients but may lack specificity in complex matrices.
Mass Spectrometry (MS): Becoming a universal detection method for ionic or ionizable compounds with incredible speed, sensitivity, and selectivity [30]. Inductively Coupled Plasma Mass Spectrometry (ICP-MS) offers exceptional sensitivity for trace elemental analysis [47].
Pulsed Amperometric Detection (PAD): Provides quasi-selective detection of carbohydrates and other electroactive species [46]. The response depends on the reduction or oxidation current of analytes at a particular electrode potential, offering picomole detection limits [46].
Evaporative Light Scattering Detection (ELSD) and Charged Aerosol Detection (CAD): Universal detection methods that measure light scattered by analyte molecules (ELSD) or use a nebulizer with corona discharge detection (CAD) [30]. CAD offers better sensitivity (low ng) and ease-of-use than ELSD [30].
Experimental Protocol: HPLC with UV Detection for Metal Complexes
Materials and Equipment:
- HPLC system with quaternary pump, autosampler, column oven, and UV-Vis DAD detector
- Analytical column (e.g., C18 reversed-phase, 150 × 4.6 mm, 5 μm particle size)
- Mobile phase components: methanol, acetonitrile, buffer salts (e.g., ammonium acetate)
- Complexing agent (e.g., 8-hydroxyquinoline, ammonium pyrrolidine dithiocarbamate)
- Standard metal solutions for calibration
Sample Preparation:
- Extract formulation samples with appropriate solvent (aqueous/organic mixture)
- Add complexing agent in excess to ensure complete complexation
- Derivatize for 30 minutes at controlled temperature (e.g., 60°C)
- Centrifuge and filter through 0.45 μm membrane
- Prepare calibration standards in similar matrix
HPLC Conditions:
- Mobile phase: Gradient from 10% to 90% organic modifier (acetonitrile or methanol) in aqueous buffer over 20 minutes
- Flow rate: 1.0 mL/min
- Column temperature: 30°C
- Detection: UV-Vis at wavelength specific to metal complex (e.g., 270-530 nm)
- Injection volume: 10-50 μL
Quantification:
- Construct calibration curve from standard solutions
- Identify metals based on retention times compared to standards
- Quantify using peak areas with external standard method
- Verify with standard addition for complex matrices
UV-Vis Spectroscopy Methodology for Metal Ion Analysis
Theoretical Basis of UV-Vis Spectroscopy
UV-Vis spectroscopy measures the amount of discrete wavelengths of UV or visible light absorbed by a sample in comparison to a reference or blank sample [1]. This technique relies on the principle that light has a certain amount of energy inversely proportional to its wavelength—shorter wavelengths carry more energy while longer wavelengths carry less energy [1].
A specific amount of energy is needed to promote electrons in a substance to a higher energy state, which we detect as absorption [1]. The absorbance (A) follows the Beer-Lambert law: A = εlc, where ε is the molar absorptivity coefficient, l is the path length, and c is the concentration [1]. This relationship enables quantitative analysis of metal complexes in solution.
Instrumentation Components
A UV-Vis spectrophotometer consists of several key components:
Light Source: Typically a single xenon lamp for both UV and visible ranges, or dual lamps (tungsten/halogen for visible light and deuterium for UV light) [1].
Wavelength Selection: Monochromators containing diffraction gratings (typically 1200 grooves/mm or higher) separate light into narrow bandwidths [1]. Absorption filters, interference filters, cutoff filters, and bandpass filters may also be used.
Sample Analysis: Samples are contained in quartz cuvettes for UV examination (as glass absorbs most UV light) [1]. A reference sample containing only solvent is essential for baseline correction.
Detection: Photomultiplier tubes (PMT) or semiconductor-based detectors (photodiodes, charge-coupled devices) convert light into electronic signals [1]. PMT detectors are especially useful for detecting very low light levels.
Experimental Protocol: UV-Vis Spectrophotometry for Metal Ions
Materials and Equipment:
- UV-Vis spectrophotometer with scanning capability
- Quartz cuvettes (1 cm path length)
- Complexing agents (e.g., dithizone, PAN, TAN)
- Buffer solutions for pH control
- Standard metal solutions
Sample Preparation:
- Digest solid formulations if necessary with acid digestion
- Adjust pH to optimal value for complex formation
- Add color-forming ligand in controlled excess
- Extract complex into organic solvent if needed
- Allow sufficient time for color development (typically 10-30 minutes)
Spectroscopic Analysis:
- Zero instrument with blank containing all reagents except analyte
- Scan from 200-800 nm to identify λmax for metal complex
- Measure absorbance at predetermined λmax
- Use cuvettes with appropriate path length to maintain absorbance below 1.0 for accurate quantitation [1]
Quantification:
- Prepare calibration standards in identical matrix
- Plot absorbance versus concentration (Beer-Lambert law)
- Determine sample concentration from calibration curve
- Implement standard addition method for matrix effects
Comparative Technical Evaluation
Performance Characteristics
Table 1: Comparison of HPLC and UV-Vis for Metal Ion Determination
| Parameter | HPLC | UV-Vis Spectroscopy |
|---|---|---|
| Detection Limit | ppm to ppb range (with appropriate detection) [30] | Generally ppm range [1] |
| Selectivity | High (separation + detection) [30] | Moderate (dependent on ligand specificity) [44] |
| Multi-element Analysis | Yes (with resolution of complexes) [46] | Limited (requires specific wavelengths) [1] |
| Analysis Time | 10-30 minutes per sample | 5-15 minutes per sample |
| Sample Throughput | Moderate | High |
| Accuracy | High (internal standards possible) [30] | Moderate to High |
| Precision | Excellent (<0.1-0.3% RSD) [30] | Good (0.5-2% RSD) |
| Matrix Tolerance | Moderate to High (separation step) [30] | Low to Moderate (susceptible to interference) |
| Equipment Cost | High | Low to Moderate |
| Operational Expertise | Significant required [30] | Moderate required |
Advantages and Limitations
HPLC Advantages:
- Superior separation capability reduces matrix interference [30]
- Ability to quantify multiple metal ions simultaneously [46]
- Excellent precision and robustness for quality control applications [30]
- Coupling with MS provides unsurpassed sensitivity and specificity [30]
HPLC Limitations:
- Higher instrument cost and maintenance requirements
- More complex operation requiring experienced personnel [30]
- Time-consuming method development
- Lack of truly universal detector [30]
UV-Vis Advantages:
- Rapid analysis with minimal sample preparation [1]
- Instrument simplicity and lower capital investment
- Suitable for routine analysis and high-throughput applications
- Wide applicability through various complexing agents [44]
UV-Vis Limitations:
- Susceptibility to spectral interference in complex matrices [44]
- Generally lower sensitivity compared to advanced HPLC techniques
- Limited multi-analyte capability
- Dependent on formation of stable, chromophoric complexes [44]
Experimental Workflows
The Scientist's Toolkit: Essential Research Reagents
Table 2: Key Reagents for Metal Ion Analysis
| Reagent/Category | Function | Application Examples |
|---|---|---|
| 8-Hydroxyquinoline | Chelating agent forming stable, | Extraction and spectrophotometric |
| UV-absorbing complexes | determination of Al³⁺, Mg²⁺, Zn²⁺ | |
| Dithizone | Sulfur-containing chelator for | Colorimetric determination of |
| heavy metals | Pb²⁺, Zn²⁺, Cd²⁺ | |
| Ammonium Pyrrolidine | Forms complexes with numerous | HPLC and colorimetric detection |
| Dithiocarbamate (APDC) | metal ions | of Ag⁺, Cu²⁺, Ni²⁺ [47] |
| PAN (1-(2-Pyridylazo)- | Heterocyclic azo compound for | Spectrophotometric detection of |
| 2-naphthol) | colorimetric metal determination | Co²⁺, Cu²⁺, Zn²⁺ |
| Tiron | Catechol derivative forming | Specific complexation of Fe³⁺ |
| colored complexes | and Ti⁴⁺ | |
| Crown Ethers | Macrocyclic compounds for | Selective complexation of |
| selective metal binding | specific metal ions | |
| Buffer Solutions | pH control for optimal | Ammonium acetate, phosphate |
| complex formation | buffers |
The choice between HPLC and UV-Vis spectroscopy for metal ion determination in formulations depends on multiple factors including required detection limits, sample complexity, available resources, and required throughput.
Select HPLC when:
- Analyzing multiple metal ions simultaneously
- Working with complex matrices requiring separation
- Maximum sensitivity and specificity are required (especially with MS detection)
- High precision quantitative data is needed for regulatory purposes [30]
Select UV-Vis when:
- Analyzing single or few metal ions with specific ligands
- Sample matrices are relatively simple
- Rapid analysis and high throughput are priorities
- Equipment budget is limited
- Routine quality control monitoring is sufficient
For comprehensive pharmaceutical analysis, a hybrid approach often proves most effective—using UV-Vis for rapid screening and HPLC for confirmatory analysis. The continuing development of new stationary phases, detection methods, and complexation chemistries promises to further enhance the capabilities of both techniques for metal ion determination in formulations.
Overcoming Challenges: A Guide to Optimization and Problem-Solving
Ultraviolet-Visible (UV-Vis) spectroscopy is a cornerstone analytical technique in pharmaceutical and environmental research due to its simplicity, rapid analysis time, and cost-effectiveness [1] [27]. The principle is based on the Beer-Lambert law, which relates the absorption of light to the properties of the sample through which the light is traveling [1] [48]. However, despite its widespread use, the technique is susceptible to several significant pitfalls that can compromise analytical accuracy, particularly with complex inorganic or pharmaceutical samples. Stray light, turbidity, and overlapping spectra are three such common challenges that can lead to deviations from the Beer-Lambert law, resulting in inaccurate concentration measurements and flawed data interpretation [1] [49].
This technical guide provides an in-depth examination of these three pitfalls, framed within the broader context of selecting the appropriate analytical technique. While UV-Vis offers numerous advantages, High-Performance Liquid Chromatography (HPLC) often provides a more robust solution for complex sample matrices. HPLC achieves this through high separation efficiency, which physically separates sample components before detection, thereby mitigating many of the interferences that plague direct spectroscopic measurement [5] [27]. This article will explore the underlying causes of these UV-Vis pitfalls, present modern mitigation strategies, and provide a comparative analysis with HPLC to guide researchers and drug development professionals in making informed methodological choices.
The Stray Light Pitfall
Principles and Causes
Stray light, often referred to as "false" light, is defined as any detected signal that consists of wavelengths outside the intended bandwidth selected by the monochromator [50] [49]. In a perfect spectrometer, only light of the specific wavelength aimed at the sample would reach the detector. In reality, imperfections in optical components, scattering from diffraction gratings, or inter-reflections within the instrument introduce unwanted radiation [50]. This stray light is particularly problematic because the detector cannot differentiate it from the true analytical signal, leading to considerable distortion of the measurement results [50].
The primary effect of stray light is a reduction in observed absorbance, which causes apparent negative deviations from the Beer-Lambert law [49]. The relative error introduced by stray light becomes most significant at high absorbance values where the true light transmission through the sample is low. As stated in the search results, "a level of 0.1% stray light at any wavelength will prevent accurate absorption measurements" [49]. This error is not constant but is enhanced at the wavelength limits of the instrument's range or where the sample itself has very high absorbance, such as at an absorption peak [49].
Impact on Analytical Data
The impact of stray light is most pronounced when measuring highly absorbing samples. For instance, if a sample has a true absorbance of 2.0 (meaning only 1% of the incident light is transmitted), even a small amount of stray light (e.g., 0.1%) would constitute a significant portion of the total light reaching the detector. This effect causes the calibration curve to plateau or even decrease at high concentrations, severely limiting the reliable quantitative range of the instrument and leading to underestimation of sample concentration [49].
The severity of stray light interference is also dependent on the light source being measured. Broadband light sources like halogen lamps produce significantly more stray light than narrowband sources such as lasers or monochromatic LEDs [50]. This is particularly critical for measurements in the UV region, where "the accuracy of measurements in the UV region is often limited by stray light rather than instrument sensitivity or noise" [50].
Mitigation Strategies
Several approaches can be employed to minimize the effects of stray light:
Optical Design Improvements: Modern spectrometers are optimized through optical simulations to minimize stray light at the design stage. This includes using high-quality blazed holographic diffraction gratings that produce fewer defects than ruled gratings, implementing baffles to block unwanted light paths, and ensuring high-quality mirror coatings to reduce diffuse reflections [1] [50]. Advanced systems may approximate the performance of a double monochromator by incorporating multiple filters within the instrument [50].
Mathematical Correction: For high-end instruments, a mathematical correction can be applied using a pre-determined stray light matrix (SDF - Signal Distribution Function) characterized across the entire spectral range. This method, which requires sophisticated software and initial characterization with a tunable laser, can reduce stray light by about one to two orders of magnitude [50].
Optical Filtering: The use of long-pass or bandpass filters can effectively reduce the amount of broadband radiation entering the spectrometer, thereby minimizing the potential for stray light generation. Some advanced systems incorporate automated filter wheels that select optimal filters for different spectral ranges during measurement [50].
The following workflow illustrates the process for identifying and correcting for stray light in UV-Vis measurements:
The Turbidity Pitfall
Understanding Turbidity Interference
Turbidity refers to the cloudiness or haziness of a fluid caused by suspended particles that scatter and absorb light [48]. In UV-Vis spectroscopy, these particles cause two primary types of interference: light scattering, which reduces the intensity of the transmitted beam, and absorption, which can be mistaken for the analyte's signal [48]. This interference is particularly problematic in environmental water monitoring and pharmaceutical suspensions where samples are not always perfectly clear [48].
The fundamental issue with turbidity is that it violates a key assumption of the Beer-Lambert law—that the light attenuation is solely due to absorption by the analyte of interest. When suspended particles are present, the measured absorbance becomes a combination of true absorption and scattering effects, leading to overestimation of the analyte concentration and reduced measurement accuracy [48].
Advanced Compensation Methodologies
Traditional approaches to turbidity compensation include simple background subtraction at non-absorbing wavelengths or the use of physical filtration. However, these methods often prove insufficient for complex environmental or biological samples. Recent advances have introduced more sophisticated compensation algorithms:
Extended Multiplicative Scatter Correction (EMSC): This advanced version of multiplicative scatter correction can model and correct for various scattering effects using a reference spectrum and polynomial terms [48]. The model is represented as:
(A(\upsilon) = a + \bar{x}(\upsilon) \cdot b + d1\upsilon + d2\upsilon^2 + \ldots + d_n\upsilon^n + e(\upsilon))
where (A(\upsilon)) is the measured absorbance, (a) represents additive baseline effects, (b) is a multiplicative constant, (\bar{x}(\upsilon)) is the reference spectrum, the (d_n\upsilon^n) terms represent polynomial corrections, and (e(\upsilon)) is the residual primarily related to chemical effects of the sample [48].
Deep Learning Approaches: Recent research has demonstrated the successful application of 1D U-Net convolutional neural networks for turbidity compensation [48]. These networks are trained using pairs of turbidity-affected spectra and their corresponding corrected spectra (often generated using ME-EMSC), learning to reconstruct the true absorption spectrum from the interfered measurement. After compensation with a 1D U-Net, the coefficient of determination (R²) for total organic carbon prediction improved from 0.918 to 0.965, and the root mean square error decreased from 0.526 to 0.343 mg/L [48].
Experimental Protocol for Turbidity Compensation
Title: Deep Learning-Based Turbidity Compensation for UV-Vis Spectra
Principle: A trained 1D U-Net neural network removes scattering effects from UV-Vis spectra, restoring the pure absorption signal for accurate analyte quantification [48].
Procedure:
- Sample Preparation: Collect water samples and maintain at 4°C. Split each sample into two aliquots.
- Spectrum Acquisition:
- Scan the first aliquot using a spectrophotometer (e.g., Jenway 7315) without filtration.
- Filter the second aliquot through a 0.7-μm filter and scan the filtrate to obtain the reference "turbidity-free" spectrum.
- Model Training:
- Build a 1D U-Net architecture with encoding and decoding paths.
- Train the network using the unfiltered spectra as input and the filtered spectra as target output.
- Use an appropriate loss function (e.g., mean squared error) and optimizer.
- Prediction and Validation:
- Apply the trained model to new, unfiltered sample spectra.
- Validate results using reference chemical methods (e.g., non-purgeable organic carbon analysis).
Key Research Reagents and Materials:
| Item | Function in Experiment |
|---|---|
| Jenway 7315 Spectrophotometer | Measures absorption spectra of liquid samples [48]. |
| 0.7-μm Filter | Removes suspended particles to create reference spectra [48]. |
| ISCO 6712 Autosampler | Automated sample collection and preservation [48]. |
| Refrigeration Unit (4°C) | Preserves sample integrity before analysis [48]. |
| 1D U-Net Neural Network | Computational model for learning turbidity compensation [48]. |
The Overlapping Spectra Pitfall
The Challenge of Spectral Deconvolution
Overlapping spectra occur when multiple components in a mixture have absorption bands at similar wavelengths, making it difficult or impossible to quantify individual analytes using traditional single-wavelength measurements [51]. This is a common challenge in pharmaceutical analysis of combination drugs and environmental samples with complex matrices [51] [52].
The fundamental problem is that the measured absorbance at any given wavelength represents the sum of contributions from all absorbing species. For a mixture containing n components, the absorbance A at wavelength λ is given by:
(Aλ = ε{λ,1} \cdot c1 \cdot L + ε{λ,2} \cdot c2 \cdot L + \ldots + ε{λ,n} \cdot c_n \cdot L)
where ε{λ,n} is the molar absorptivity of component n at wavelength λ, cn is its concentration, and L is the path length [51]. Without additional information or processing, this equation cannot be solved for individual concentrations.
Resolution Techniques and Mathematical Models
Several spectrophotometric methods have been developed to resolve overlapping spectra without prior separation:
Advanced Absorbance Subtraction (AAS): This method utilizes the difference in absorbance at two carefully selected wavelengths to cancel out the contribution of one component [51]. In the analysis of ciprofloxacin and metronidazole combinations, measurements at 291.5 nm (an isoabsorptive point) and 250 nm were used, where the absorbance difference for ciprofloxacin is zero, allowing direct determination of metronidazole [51].
Bivariate Method: This approach utilizes linear calibration regression functions at two optimally selected wavelengths (determined by the Kaiser method) [51]. For a binary mixture, the absorbance equations at two wavelengths (λ1, λ2) are:
(A{AB1} = m{A1}CA + m{B1}CB + e{AB1})
(A{AB2} = m{A2}CA + m{B2}CB + e{AB2})
where m represents slopes of linear regressions, C represents concentrations, and e represents intercept values. The concentrations CA and CB can be calculated by solving these simultaneous equations [51].
Ratio Difference Method: This technique uses the difference in ratios of absorbances at different wavelengths to determine the concentration of individual components in a mixture [51].
The following workflow illustrates the decision process for selecting the appropriate method to resolve overlapping spectra:
Experimental Protocol for Resolving Overlapping Spectra
Title: Simultaneous Determination of Ciprofloxacin and Metronidazole by Advanced Absorbance Subtraction
Principle: Utilizing an isoabsorptive point and wavelengths where one component shows equal absorbance to resolve a binary mixture [51].
Procedure:
- Standard Solution Preparation:
- Prepare stock solutions of ciprofloxacin (CIP) and metronidazole (MET) in distilled water (50 μg/mL).
- Prepare working standard solutions of CIP (1-17 μg/mL) and MET (5-37.5 μg/mL) by serial dilution in 10 mL volumetric flasks.
Spectrum Acquisition:
- Record absorbance spectra of all standard solutions from 200-400 nm using a double-beam UV-Vis spectrophotometer (e.g., Jenway Model 6800) with 1 cm quartz cells.
- Identify the isoabsorptive point (291.5 nm for CIP and MET) and wavelengths where each component shows equal absorbance (250 nm and 345 nm).
For MET Determination in presence of CIP:
- Measure sample absorbance at 291.5 nm (A₁) and 250 nm (A₂).
- Calculate ΔA = A₁ - A₂
- Determine MET concentration using the regression equation: ΔA = 0.0659 × C_MET + 0.0583 (R² = 0.9999)
For CIP Determination in presence of MET:
- Measure sample absorbance at 291.5 nm (A₁) and 345 nm (A₂).
- Calculate ΔA = A₁ - A₂
- Determine CIP concentration using the regression equation: ΔA = 0.0468 × C_CIP + 0.0083 (R² = 0.9998)
Validation:
- Assess method precision, repeatability, robustness, and accuracy according to ICH guidelines.
Key Research Reagents and Materials:
| Item | Function in Experiment |
|---|---|
| Ciprofloxacin Standard | Active pharmaceutical ingredient for calibration [51]. |
| Metronidazole Standard | Active pharmaceutical ingredient for calibration [51]. |
| Jenway Model 6800 Spectrophotometer | Double-beam instrument for spectral acquisition [51]. |
| 1 cm Quartz Cells | Holds samples for analysis; quartz allows full UV range transmission [51]. |
| Distilled Water | Solvent for preparing standard solutions and samples [51]. |
HPLC versus UV-Vis: A Comparative Framework for Inorganic Samples
When selecting an analytical technique for inorganic samples, researchers must consider the specific analytical challenges and data quality requirements. The following table provides a structured comparison between UV-Vis spectroscopy and HPLC, highlighting their respective capabilities in addressing the pitfalls discussed in this guide:
Table: Comparative Analysis of HPLC and UV-Vis for Inorganic Samples
| Analytical Aspect | UV-Vis Spectroscopy | High-Performance Liquid Chromatography (HPLC) |
|---|---|---|
| Selectivity | Limited; relies on spectral differences; prone to interferences from overlapping spectra [27]. | High; excellent separation capabilities; resolves complex mixtures before detection [5] [27]. |
| Handling Turbidity | Significant interference; requires compensation algorithms (e.g., EMSC, deep learning) [48]. | Minimal interference; sample filtration protects column; separation minimizes turbidity impact [5]. |
| Stray Light Sensitivity | Highly sensitive; causes nonlinearity at high absorbance [49]. | Less sensitive; detection occurs after separation; narrower bandwidths reduce stray light [5]. |
| Quantitative Accuracy | Good for simple matrices; compromised by interferences in complex samples. Recovery rates for Levofloxacin in composites: 96.0-99.5% [4]. | Superior for complex samples; internal standards enhance accuracy. Recovery rates for Levofloxacin: 96.37-110.96% with better consistency [4]. |
| Sample Preparation | Minimal; often direct measurement after dilution [27]. | More extensive; may require filtration, derivatization, or extraction [5]. |
| Analysis Speed | Rapid (seconds to minutes) [27]. | Moderate to slow (minutes to hours per sample) [27]. |
| Cost Considerations | Lower initial investment and operating costs [27]. | Higher cost for instrumentation, columns, and solvents [5] [27]. |
| Environmental Impact | Lower solvent consumption [27]. | Higher solvent usage; requires waste management [5]. |
The data clearly demonstrates that while UV-Vis spectroscopy offers advantages in speed, cost, and simplicity, HPLC provides superior performance for complex samples where interference from stray light, turbidity, or overlapping spectra would compromise analytical accuracy [27] [4]. The separation step inherent in HPLC methodology effectively circumvents many of the fundamental limitations of direct spectroscopic measurement, though at the cost of increased operational complexity and expense.
For inorganic analysis specifically, the choice between these techniques should be guided by sample complexity, required detection limits, and the need for speciation information. While UV-Vis may suffice for routine analysis of simple inorganic ions in clean matrices, HPLC with appropriate detection (e.g., UV, ICP-MS) offers unparalleled capability for speciated metal analysis and complex inorganic mixtures where different species may exhibit similar spectral characteristics but different chromatographic behavior.
Stray light, turbidity, and overlapping spectra represent significant challenges in UV-Vis spectroscopy that can substantially compromise analytical accuracy if not properly addressed. While modern computational approaches like deep learning and advanced chemometric methods provide powerful tools for mitigating these effects, they introduce additional complexity and validation requirements.
The comparative analysis with HPLC reveals a fundamental trade-off between analytical simplicity and methodological robustness. HPLC's separation power naturally circumvents many limitations of direct spectroscopic measurement, making it particularly valuable for regulatory applications, complex matrices, and situations requiring high certainty in results. However, for routine quality control, simple analyses, and resource-limited settings, UV-Vis spectroscopy remains a valuable tool when its limitations are understood and appropriately managed.
Researchers and drug development professionals should consider these factors within the specific context of their analytical needs, sample complexity, and data quality requirements. A thorough understanding of these common UV-Vis pitfalls enables not only better implementation of spectroscopic methods but also more informed decisions about when to employ more sophisticated separation-based approaches like HPLC for challenging analytical problems.
In the field of inorganic sample research, selecting the appropriate analytical technique is fundamental to obtaining reliable data. High-Performance Liquid Chromatography (HPLC) and UV-Vis Spectroscopy represent two fundamentally different approaches, each with distinct advantages and limitations. The choice between them hinges on the specific analytical requirements, including sample complexity, the need for separation, and required detection limits.
UV-Vis Spectroscopy is a straightforward, cost-effective method ideal for the quantitative analysis of inorganic species that contain chromophores. However, its major limitation is low specificity; it struggles to distinguish between different compounds in a mixture without prior separation, as it measures the total absorbance of the sample at a specific wavelength [27]. This makes it susceptible to interference from other absorbing substances, which is a significant drawback for complex inorganic matrices.
HPLC, in contrast, separates a mixture into its individual components before detection, providing high specificity and sensitivity. This separation power makes it the superior technique for analyzing complex inorganic samples containing multiple ions or metal complexes [27]. Its ability to quantify multiple analytes simultaneously and handle samples without a strong chromophore (using alternative detectors) offers a significant advantage, albeit with higher instrument cost, operational complexity, and solvent consumption.
Table 1: Comparison of HPLC and UV-Vis Spectroscopy for Inorganic Samples
| Aspect | HPLC | UV-Vis Spectroscopy |
|---|---|---|
| Selectivity & Specificity | High; can separate and quantify multiple analytes. | Limited; measures total absorbance, prone to interferences. |
| Sample Complexity | Ideal for complex mixtures. | Best for simple, single-component analyses. |
| Cost & Equipment | High cost; complex instrumentation. | Low cost; simple setup. |
| Sample Preparation | Often requires optimized mobile phase and column conditions. | Minimal preparation. |
| Speed of Analysis | Moderate to long (includes separation time). | Fast. |
| Detection Flexibility | Can be coupled with various detectors (UV, MS, CAD). | Limited to UV-Vis detection. |
| Data Output | Chromatogram (separation over time). | Absorption spectrum (absorbance vs. wavelength). |
| Environmental Impact | High solvent consumption and waste. | Lower solvent use and waste. |
This guide focuses on optimizing three critical HPLC parameters—mobile phase pH, column chemistry, and flow rate—to achieve the resolution, sensitivity, and speed necessary for robust inorganic analysis.
Mobile Phase pH Optimization
The pH of the mobile phase is a dominant factor in controlling retention, selectivity, and peak shape for ionizable analytes. In the context of inorganic analysis, this is particularly relevant for metal complexes and ionized species.
The Critical Role of pH
The pH affects the degree of ionization of an analyte, thereby altering its hydrophobicity. In Reversed-Phase HPLC (the most common mode), the general rule is:
- Ionized analytes are more hydrophilic and show decreased retention.
- Non-ionized analytes are more hydrophobic and show increased retention [53].
For method robustness, it is common practice to adjust the pH to be at least ±1.0 pH unit away from the pKa of the analyte. This ensures that the analyte is either fully ionized or fully non-ionized, making the method less susceptible to minor variations in mobile phase pH [53]. Operating within ±1.0 pH unit of the pKa requires extreme precision in mobile phase preparation due to the steep change in ionization state in this range.
Buffers and Additives
To maintain a stable pH, a buffer system is essential. A buffer is a weak acid or base in solution with its conjugate partner [53]. Key considerations include:
- Buffer Capacity: The buffer concentration should typically be between 10 mM and 50 mM. Concentrations below 10 mM offer insufficient capacity, while those above 50 mM risk precipitation when mixed with organic solvents [53].
- Buffer Selection: The chosen buffer must have a pKa within ±1 unit of the desired mobile phase pH to be effective. Common buffers and their uses are shown in Table 2.
- Additives: Ion-pairing reagents (e.g., trifluoroacetic acid) can be added to the mobile phase to increase the retention of ionic inorganic species by reducing their polarity [54] [55].
- Detector Compatibility: For LC-MS applications, volatile buffers (e.g., ammonium formate, ammonium acetate) must be used [55] [53].
Table 2: Common Mobile Phase Buffers and Additives
| Buffer/Additive | Typical Use Case | pKa | Key Considerations |
|---|---|---|---|
| Trifluoroacetic Acid (TFA) | Reverse-phase HPLC for basic analytes | ~0.5 | Strong ion-pairing reagent; not a true buffer; UV-absorbing. |
| Phosphate Buffer | Reverse-phase HPLC with UV detection | pKa₂ 7.20 | Non-volatile; not suitable for LC-MS. |
| Formate Buffer | LC-MS applications | 3.75 | Volatile; good for low pH. |
| Acetate Buffer | LC-MS applications | 4.76 | Volatile; good for mid-range pH. |
| Ammonium Bicarbonate | LC-MS applications | 10.3 | Volatile; for high pH applications. |
Experimental Protocol: pH Scouting
Objective: To identify the optimal mobile phase pH for separating a mixture of ionizable inorganic analytes.
- Preparation: Prepare separate mobile phase reservoirs (A: aqueous buffer, B: organic solvent) at three different pH values (e.g., 3.0, 5.0, and 7.0). Keep the buffer concentration constant at 20 mM.
- Column: Use a reversed-phase C18 column.
- Chromatographic Conditions: Employ a linear gradient from 5% B to 95% B over 20 minutes. Maintain a constant flow rate and column temperature.
- Analysis: Inject the sample mixture and evaluate the chromatograms. The optimal pH is the one that provides the best resolution (Rs > 1.5) between all critical analyte pairs and symmetric peak shapes.
Column Chemistry and Selection
The column is the heart of the HPLC system, where the separation occurs. Selecting the appropriate stationary phase chemistry is paramount.
Types of HPLC Columns
Table 3: Common HPLC Column Types and Their Applications
| Column Type | Stationary Phase Polarity | Mobile Phase Polarity | Separation Basis | Common Applications |
|---|---|---|---|---|
| Normal Phase | Polar (e.g., silica) | Non-polar (hexane) | Analyte polarity | Hydrophobic compounds, isomers [56]. |
| Reverse Phase | Non-polar (C18, C8) | Polar (Water/ACN/MeOH) | Analyte hydrophobicity | Most pharmaceuticals, including ionizable compounds [56] [57]. |
| Ion Exchange | Charged functional groups | Aqueous buffer | Analyte charge & size | Inorganic ions, proteins, nucleotides [56]. |
| Size Exclusion | Porous inert material | Aqueous/organic | Molecular size / hydrodynamic volume | Polymers, proteins [56]. |
For most inorganic and pharmaceutical applications, Reversed-Phase HPLC is the most widely used mode. The most common stationary phase is C18 (Octadecylsilane), bonded to silica particles [57]. The retention mechanism is based on hydrophobic interactions, where more hydrophobic analytes are retained longer.
Column Selection Guide
- Particle Size (µm): Smaller particles (e.g., 1.9-3 µm) provide higher efficiency and resolution but generate higher backpressure. Larger particles (5 µm) are used in standard HPLC systems [57].
- Pore Size (nm): Typical pore sizes are 8-12 nm, suitable for small molecules. Larger pores (30 nm) are used for biomacromolecules [57].
- Column Dimensions: Longer columns (e.g., 150-250 mm) generally provide more theoretical plates and better resolution. Shorter columns (50 mm) enable faster analysis [58].
Flow Rate Optimization
The flow rate of the mobile phase directly impacts the separation efficiency, analysis time, and backpressure.
Theoretical Foundation: The Van Deemter Equation
The relationship between flow rate and efficiency (theoretical plate height, HETP) is described by the Van Deemter equation. The equation shows that for any column, there is an optimal flow rate that minimizes band-broadening and maximizes efficiency [59]. Modern columns packed with smaller particles (e.g., 1.8-3.5 µm) have a flatter Van Deemter curve, allowing for faster flow rates without a significant loss of efficiency.
Practical Flow Rate Guidelines
The optimal flow rate is primarily determined by the column's internal diameter (I.D.) [59].
Table 4: Recommended Flow Rates Based on Column Internal Diameter (I.D.)
| Column I.D. (mm) | Typical Flow Rate (mL/min) | Primary Application / Benefit |
|---|---|---|
| 4.6 (Standard) | 1.0 - 1.5 | General purpose analysis. |
| 3.0 (Narrow-bore) | 0.4 - 0.6 | Balance of solvent savings and sensitivity. |
| 2.1 (Narrow-bore) | 0.2 - 0.3 | LC-MS; reduces solvent usage by ~80% [59]. |
| 1.0 (Micro-bore) | 0.05 - 0.1 | LC-MS/Nano-flow applications; maximizes sensitivity. |
Practical Advice:
- For a standard 4.6 mm I.D. column, a flow rate between 1.0 and 1.5 mL/min is typically optimal [59].
- Avoid dropping below 0.8 mL/min on a 4.6 mm column, as this can place the method on the "bad part" of the Van Deemter curve, leading to broader peaks and reduced sensitivity [59].
- Higher flow rates shorten analysis time but increase backpressure and may compromise resolution [58].
Integrated Experimental Protocol: HPLC Method Development
This protocol outlines a systematic approach to developing a robust HPLC method for inorganic compounds by integrating the optimization of pH, column, and flow rate.
Materials and Reagents:
- HPLC System: Equipped with a binary or quaternary pump, autosampler, column oven, and UV-Vis DAD or other suitable detector.
- Columns: A selection of reversed-phase columns (e.g., C18, C8, Phenyl).
- Chemicals: HPLC-grade water, acetonitrile, methanol, and buffer salts (e.g., ammonium formate, potassium phosphate).
- Samples: Standard solutions of the target analytes, both individually and as a mixture.
Procedure:
- Sample and Mobile Phase Preparation:
- Prepare stock solutions of analytes in a solvent compatible with the mobile phase.
- Filter all mobile phases through a 0.45 µm membrane and degas thoroughly by sonication or vacuum filtration [54].
Initial Scouting Run:
- Column: Start with a standard C18 column (e.g., 150 mm x 4.6 mm, 5 µm).
- Mobile Phase: Use a generic gradient (e.g., 5-95% acetonitrile in water, no buffer) with a flow rate of 1.0 mL/min.
- Detection: Use a UV-Vis DAD detector, collecting spectra from 200-400 nm to identify optimal wavelengths.
Optimize Mobile Phase pH:
- Based on the pKa of the analytes, perform the pH scouting experiment as described in Section 2.3.
Fine-tune Selectivity with Solvent and Column:
- If resolution remains inadequate, switch the organic modifier (e.g., from acetonitrile to methanol) to alter selectivity [53].
- As a last resort, change the column chemistry (e.g., to a C8 or Phenyl column) to exploit different interaction mechanisms.
Optimize Flow Rate:
- Once satisfactory resolution is achieved, adjust the flow rate. If the analysis is too slow, increase the flow rate in 0.1 mL/min increments, monitoring resolution and backpressure. If necessary for maximum sensitivity, decrease the flow rate but avoid the inefficient part of the Van Deemter curve [58] [59].
Method Validation:
- Validate the final method for parameters including specificity, linearity, accuracy, precision, LOD, and LOQ in accordance with ICH guidelines [27].
The Scientist's Toolkit: Essential Research Reagent Solutions
Table 5: Key Reagents and Materials for HPLC Method Development
| Item | Function / Purpose | Example Products / Notes |
|---|---|---|
| C18 Column | The default reversed-phase column for most separations. | InertSustain C18, Inertsil ODS-3 [57]. |
| Ion-Pairing Reagents | Increases retention of ionic analytes by forming neutral pairs. | Trifluoroacetic Acid (TFA), Heptafluorobutyric Acid (HFBA) [55]. |
| Volatile Buffers | Essential for LC-MS compatibility; provide pH control. | Ammonium Formate, Ammonium Acetate [55] [53]. |
| HPLC-Grade Solvents | High purity solvents to ensure low UV background and prevent system contamination. | Water, Acetonitrile, Methanol. |
| 0.45 µm Membranes | For filtering mobile phases and samples to remove particulates. | Nylon, PVDF, or PTFE filters. |
| Internal Standard | For quantitative NMR (qNMR) or to correct for injection variability in HPLC. | Nicotinamide (used for its stability and distinct signals) [9]. |
Optimizing HPLC conditions is a systematic process that balances the competing influences of mobile phase pH, column chemistry, and flow rate. For the analysis of inorganic samples, where speciation and complex matrices are common challenges, a well-optimized HPLC method provides the specificity that UV-Vis spectroscopy lacks. By following a structured development protocol—starting with a robust C18 column, scouting for the optimal pH to control ionization, and fine-tuning the flow rate for efficiency—researchers can develop robust, reliable, and transferable methods that are fit for purpose in drug development and advanced research.
In the pharmaceutical industry and related research fields, Ultraviolet-Visible (UV-Vis) spectroscopy and High-Performance Liquid Chromatography (HPLC) with UV detection are cornerstone techniques for drug analysis due to their simplicity, cost-effectiveness, and widespread availability [27]. However, a fundamental limitation of these techniques is their dependence on the presence of chromophores—unsaturated functional groups responsible for absorption in the UV or visible region [60]. For compounds lacking these chromophores, such as many carbohydrates, aliphatic molecules, and certain pharmaceuticals, direct UV detection becomes impossible or severely limited in sensitivity [21] [61].
This technical challenge is particularly relevant when comparing HPLC and UV-Vis for pharmaceutical analysis. While UV-Vis spectroscopy offers rapid, inexpensive analysis for simple assays, its selectivity is limited when excipients or degradation products interfere with the analyte signal [27]. HPLC provides superior separation capabilities but still faces detection limitations for compounds with weak UV chromophores [21]. Within this context, derivatization strategies—chemical modification of analytes to introduce detectable chromophores—emerge as essential techniques to extend the utility of UV-based detection methods for a wider range of pharmaceutical compounds.
Fundamental Principles: Chromophores and Detection Limitations
What Are Chromophores?
Chromophores are unsaturated functional groups that form part of a conjugated electron system, enabling them to absorb electromagnetic radiation in the UV or visible region [60]. Common chromophoric groups include carbon-carbon double bonds (C=C), carbon-nitrogen double bonds (C=N), carbonyl groups (C=O), azo groups (N=N), and nitro groups (NO₂) [60]. The presence of these groups allows molecules to undergo electronic transitions (such as π→π* or n→π* transitions) when irradiated, forming the basis for UV detection [62].
The effectiveness of UV detection depends significantly on the molecular structure of the analyte. Molecules with extensive conjugation systems typically absorb at higher wavelengths with greater intensity, while aliphatic compounds with single bonds may only absorb at very low wavelengths (<210 nm) where solvent interference becomes problematic [62]. Auxochromes—substituents like -OH, -NH₂, or -COOH—can enhance chromophore intensity and cause bathochromic (red) shifts to longer wavelengths when conjugated with π-electron systems [60].
The Analytical Challenge for Non-Chromophoric Compounds
For compounds lacking these structural features, UV detection faces significant limitations. Carbohydrates, amino acids, lipids, and many pharmaceutical compounds with simple aliphatic structures demonstrate weak or no UV absorption above 200 nm [61]. At these low wavelengths, common HPLC mobile phase components (such as solvents, buffers, and additives) may themselves absorb significantly, creating high background noise and reducing detection sensitivity [62].
The following table summarizes common HPLC detection approaches for compounds with weak chromophores:
Table 1: Detection Methods for Compounds with Weak UV Chromophores
| Detection Method | Principle | Applications | Limitations |
|---|---|---|---|
| UV-Vis (Low Wavelength) | Measures absorption <210 nm where most organics absorb | General organic compounds | Solvent interference, high noise, requires high-purity solvents |
| Refractive Index (RI) | Measures change in refractive index | Universal detection for sugars, polymers | Low sensitivity, not gradient-compatible, temperature-sensitive |
| Evaporative Light Scattering (ELSD) | Light scattering of evaporated particles | Non-volatile analytes | Destructive, non-uniform response |
| Charged Aerosol Detection (CAD) | Charging of aerosol particles | Broad applicability | Destructive, requires volatile mobile phases |
| Mass Spectrometry (MS) | Mass-to-charge ratio | High sensitivity, compound identification | High cost, complex operation |
| Derivatization + UV/FLD | Introduction of chromophore/fluorophore | Targeted analysis of specific functional groups | Additional sample preparation, reaction optimization needed |
Derivatization Strategies: Technical Approaches and Reagents
Derivatization involves chemically modifying target analytes to introduce chromophores or fluorophores that enable sensitive detection. These strategies can be implemented in two primary approaches: pre-column derivatization (before separation) and post-column derivatization (after separation but before detection).
Pre-column Derivatization Strategies
Pre-column derivatization involves modifying the analyte prior to injection into the chromatographic system. This approach offers several advantages, including flexibility in reaction conditions and compatibility with standard HPLC systems and mobile phases.
Table 2: Common Derivatization Reagents for UV Detection
| Reagent | Target Analytes | Functional Group Targeted | Resulting Chromophore Properties (λmax) | Notes |
|---|---|---|---|---|
| Dansyl Chloride | Amines, amino acids, phenols | Primary/Secondary amines | Strong UV absorption, fluorescence | High sensitivity, stable derivatives |
| Dinitrophenylhydrazine (DNPH) | Carbonyls, aldehydes, ketones | Carbonyl group | Yellow-orange hydrazones (360-400 nm) | Common for aldehydes/ketones |
| Phenylisothiocyanate (PITC) | Amino acids, peptides | Primary amines | Phenylthiocarbamyl derivatives (254 nm) | Edman degradation reagent |
| Benzoyl Chloride | Hydroxyls, amines | -OH, -NH₂ | Benzoate esters (230 nm) | Broad applicability |
| Naphthoyl Chloride | Hydroxyls, amines | -OH, -NH₂ | Enhanced chromophore (240-280 nm) | Higher sensitivity than benzoyl |
| 3,5-Dinitrobenzoyl Chloride | Alcohols, amines | -OH, -NH₂ | Strong electron-withdrawing groups (254 nm) | High molar absorptivity |
Post-column Derivatization Strategies
Post-column derivatization involves mixing the column effluent with derivatization reagents after separation but before detection. This approach requires specialized instrumentation with additional pumps and reaction chambers but avoids potential issues with reaction by-products interfering with separation.
Diagram 1: Post-column derivatization system workflow. The analytical stream is mixed with derivatization reagents after separation, then passes through a reaction coil before detection.
Experimental Protocols: Detailed Methodologies
Protocol 1: Derivatization of Carbohydrates with Phenyl-3-methyl-5-pyrazolone (PMP)
This method is adapted from approaches used for sugar analysis in complex matrices like honey and biological samples [61].
Principle: Reducing sugars react with PMP under basic conditions to form bis-PMP derivatives that absorb strongly at 245-260 nm.
Reagents and Solutions:
- 0.5 M PMP solution in methanol
- 0.3 M NaOH solution
- 1.0 M HCl solution
- Ammonium acetate buffer (0.1 M, pH 5.0)
- HPLC-grade water, methanol, and acetonitrile
Procedure:
- Transfer 100 µL of standard or sample solution (containing 10-100 nmol of reducing sugar) to a 1.5 mL vial.
- Add 100 µL of 0.5 M PMP solution and 100 µL of 0.3 M NaOH solution.
- Vortex mix for 30 seconds and heat at 70°C for 60 minutes.
- Cool to room temperature and neutralize with 100 µL of 1.0 M HCl.
- Add 1 mL of chloroform and vortex vigorously for 1 minute.
- Centrifuge at 10,000 × g for 5 minutes and carefully remove the organic (lower) layer.
- Repeat the chloroform extraction twice more to remove excess reagent.
- Filter the aqueous layer through a 0.22 µm membrane before HPLC analysis.
HPLC Conditions:
- Column: C18 reversed-phase (250 × 4.6 mm, 5 µm)
- Mobile Phase: Ammonium acetate buffer (0.1 M, pH 5.0) - Acetonitrile (83:17, v/v)
- Flow Rate: 1.0 mL/min
- Detection: 245 nm
- Injection Volume: 10-20 µL
Protocol 2: Amino Acid Derivatization with Dansyl Chloride
Principle: Primary and secondary amines react with dansyl chloride to form highly UV-absorbing and fluorescent sulfonamide derivatives.
Reagents and Solutions:
- Dansyl chloride solution: 10 mg/mL in acetone
- Sodium bicarbonate buffer: 0.1 M, pH 9.5
- Phosphoric acid: 1% (v/v)
- Mobile Phase A: 20 mM sodium acetate buffer, pH 4.5
- Mobile Phase B: Acetonitrile
Procedure:
- Transfer 50-100 µL of amino acid standard or sample solution to a 1.5 mL vial.
- Add 200 µL of sodium bicarbonate buffer (pH 9.5).
- Add 200 µL of dansyl chloride solution (10 mg/mL in acetone).
- Vortex mix thoroughly and heat at 60°C for 15 minutes in the dark.
- Cool to room temperature and acidify with 50 µL of 1% phosphoric acid.
- Dilute with mobile phase A to appropriate concentration.
- Filter through 0.22 µm membrane before HPLC analysis.
HPLC Conditions:
- Column: C18 reversed-phase (150 × 4.6 mm, 3.5 µm)
- Mobile Phase: Gradient from 20% B to 80% B over 25 minutes
- Flow Rate: 1.0 mL/min
- Column Temperature: 35°C
- Detection: 254 nm
- Injection Volume: 10 µL
Protocol 3: Post-column Derivatization for Primary Amines with OPA
Principle: Ortho-phthalaldehyde (OPA) reacts with primary amines in the presence of thiols to form highly fluorescent isoindole derivatives.
Reagents and Solutions:
- OPA reagent: 1.5 g OPA in 50 mL methanol, added to 1 L of 0.5 M potassium borate buffer (pH 10.4) containing 2 mL 2-mercaptoethanol
- Mobile Phase: 50 mM sodium phosphate buffer (pH 7.2) - methanol (95:5)
System Configuration:
- Analytical column: C8 or C18 reversed-phase
- Post-column pump: Delivers OPA reagent at 0.3 mL/min
- Reaction coil: 2 m × 0.5 mm ID knitted PTFE tubing maintained at 50°C
- Detection: Fluorescence (Excitation: 340 nm, Emission: 450 nm) or UV at 338 nm
The Scientist's Toolkit: Essential Research Reagents
Table 3: Key Research Reagent Solutions for Derivatization
| Reagent/Category | Function | Application Examples | Considerations |
|---|---|---|---|
| Chromogenic Reagents | Introduce strong UV-absorbing groups | Dansyl chloride, Dinitrophenylhydrazine, Ninhydrin | Stability, reaction kinetics, by-products |
| Activation Catalysts | Enhance reaction rates/ yields | Triethylamine, DMAP, Imidazole | Compatibility with analytes and HPLC system |
| Derivatization Solvents | Reaction medium | Anhydrous acetonitrile, methanol, DMF | Purity, water content, UV transparency |
| Buffering Systems | pH control for optimal reactions | Carbonate/bicarbonate (pH 9-10), Borate (pH 8-10), Phosphate (pH 6-8) | Buffer capacity, UV cutoff, compatibility |
| Purification Materials | Remove excess reagents | Solid-phase extraction cartridges, Liquid-liquid extraction solvents | Recovery efficiency, procedural losses |
| HPLC Mobile Phases | Separation of derivatives | Methanol-water, Acetonitrile-water with buffers | UV transparency, compatibility with derivatives |
Comparative Analytical Performance: Quantitative Assessment
The effectiveness of derivatization strategies can be evaluated through key analytical performance metrics. The following table summarizes typical performance gains achieved through derivatization:
Table 4: Analytical Performance Comparison Before and After Derivatization
| Analyte | Detection Method | Limit of Detection (LOD) | Linearity (R²) | Application Reference |
|---|---|---|---|---|
| Reducing Sugars | Direct RI detection | 50-100 ng | >0.999 | [61] |
| Reducing Sugars | Direct low-UV (190 nm) | 20-50 ng | >0.999 | [61] |
| Reducing Sugars | PMP derivatization (245 nm) | 1-5 ng | >0.999 | [61] |
| Amino Acids | Direct low-UV (210 nm) | 10-50 ng | >0.995 | - |
| Amino Acids | Dansyl derivatization (254 nm) | 0.1-0.5 ng | >0.999 | - |
| Levofloxacin | UV-Vis spectroscopy | ~10 ng | 0.9999 | [4] |
| Levofloxacin | HPLC-UV (290 nm) | ~1 ng | 0.9991 | [4] |
| Bakuchiol | Direct UV (262 nm) | Variable in cosmetics | >0.999 | [9] |
| Bakuchiol | HPLC-UV (260 nm) | Significantly improved | >0.999 | [9] |
Applications in Pharmaceutical Analysis: Case Studies
Case Study: Analysis of Levofloxacin in Drug Delivery Systems
Research comparing HPLC and UV-Vis methods for determining Levofloxacin released from mesoporous silica microspheres/nano-hydroxyapatite composite scaffolds demonstrated the superiority of HPLC for accurate quantification in complex matrices [4]. While UV-Vis showed excellent linearity (y=0.065x+0.017, R²=0.9999), HPLC provided more accurate recovery rates, especially at medium concentrations (110.96±0.23% for HPLC vs. 99.50±0.00% for UV-Vis) [4]. This study highlights that in complex drug delivery systems where excipients may interfere, chromatographic separation before detection provides more reliable results, which could be further enhanced through targeted derivatization strategies.
Case Study: Quality Control of Bakuchiol in Cosmetics
A recent comparative study analyzed bakuchiol content in cosmetic products using UV-Vis, NMR, and HPLC methods [9]. While UV-Vis successfully identified bakuchiol at 262 nm in some samples, it failed to properly quantify the compound in emulsion-type formulations due to extraction difficulties [9]. HPLC with diode-array detection at 260 nm provided reliable quantification (0.51-3.6% across samples) and confirmed the complete absence of bakuchiol in one product despite manufacturer claims [9]. This case demonstrates how derivatization could potentially enhance extraction efficiency and detection sensitivity for quality control applications.
Method Validation and Regulatory Considerations
When implementing derivatization strategies for pharmaceutical analysis, method validation according to regulatory guidelines is essential. Key validation parameters include:
Specificity: The method should distinguish the derivatized analyte from potential interferents, including reaction by-products and sample matrix components.
Linearity and Range: Demonstrate that the detector response is proportional to analyte concentration over the specified range, typically with R² > 0.995 for chromatographic methods.
Accuracy and Precision: Recovery studies should assess the method's ability to correctly measure the analyte, with precision (RSD) preferably <2% for repeatability [27].
Limit of Detection (LOD) and Quantification (LOQ): For derivatization methods, LOD and LOQ should be significantly improved compared to underivatized approaches.
Robustness: Evaluate the method's resilience to small variations in derivatization conditions (reagent concentration, pH, temperature, reaction time).
Regulatory compliance requires adherence to guidelines such as ICH Q2(R1) for analytical method validation, with comprehensive documentation of all derivatization procedures and validation data [27].
Derivatization strategies effectively address the fundamental limitation of UV detection for compounds lacking chromophores, enabling sensitive analysis of pharmaceuticals, carbohydrates, amino acids, and other challenging analytes. By introducing strong UV-absorbing moieties through targeted chemical reactions, these approaches bridge the capability gap between universal detection methods (with their limitations) and sophisticated techniques like MS (with their cost and complexity requirements).
The choice between pre-column and post-column derivatization depends on specific application requirements, with pre-column offering greater flexibility and post-column providing better automation and avoiding potential interference with separation. As pharmaceutical analysis continues to confront increasingly complex molecules and formulations, derivatization remains an essential tool in the analytical chemist's repertoire, extending the utility of widely available UV detection systems while maintaining regulatory compliance and analytical rigor.
For researchers comparing HPLC and UV-Vis techniques, derivatization strategies can often transform an impossible analysis into a routine determination, particularly for inorganic samples and compounds with native chromophore deficiency. By understanding these approaches and their implementation, scientists can significantly expand their analytical capabilities without substantial capital investment in alternative detection technologies.
Techniques to Minimize Matrix Interference in Complex Samples
In analytical chemistry, the "matrix effect" refers to the influence of undetected sample components on the measurement of an analyte's concentration or mass [63] [64]. This phenomenon presents a fundamental challenge for accurate quantitation, particularly when using sophisticated techniques like High-Performance Liquid Chromatography (HPLC) and UV-Visible Spectroscopy (UV-Vis) for complex inorganic samples [63]. The sample matrix comprises all components of the sample other than the analyte, which can include co-extracted substances from the sample itself as well as mobile phase components in chromatographic systems [63]. When these matrix components interfere with the detection or separation of target analytes, they can significantly compromise analytical accuracy, precision, and sensitivity.
The core problem lies in the matrix's ability to either enhance or suppress detector response to the target analyte [63]. In ideal conditions, matrix components would have no effect whatsoever on detector response, but this situation rarely occurs in practice with complex real-world samples. Matrix effects manifest differently across detection principles: in fluorescence detection, matrix components can affect quantum yield through quenching; in UV/Vis absorbance detection, solvatochromism can alter analyte absorptivity; in mass spectrometric detection, ionization suppression or enhancement occurs as analytes compete with matrix components for available charge; and in evaporative light scattering or charged aerosol detection, matrix components can influence aerosol formation processes [63].
Within the context of comparing HPLC and UV-Vis techniques for inorganic sample analysis, understanding and mitigating matrix effects becomes paramount. HPLC offers superior separation capabilities that can physically separate analytes from potential interferents before detection, while UV-Vis spectroscopy provides a simpler, more cost-effective approach but with limited ability to distinguish between compounds with similar absorption characteristics [27]. This technical guide explores systematic approaches to identify, quantify, and minimize matrix interference across both platforms, enabling researchers to select appropriate methodologies and implement effective mitigation strategies for their specific analytical challenges.
Fundamental Principles of Matrix Interference
Matrix effects originate from various sources depending on the sample composition, preparation techniques, and analytical methodology employed. In complex inorganic samples, common sources of interference include coexisting ions, organic matter, particulate matter, and solvents or reagents used in sample preparation [64]. The mechanisms through which these components cause interference can be categorized into several distinct types.
In chromatographic systems like HPLC, matrix effects primarily occur when undetected matrix components co-elute with the target analytes and interfere with detection [63]. These components may compete with analytes for ionization in mass spectrometric detection, modify the chromatographic separation by interacting with stationary phase sites, or alter the detector response through physicochemical interactions [63] [64]. Particularly in gas chromatography, active sites in the system (injector line, column) can adsorb analytes when standards are prepared in neat solvents, but when real sample extracts are analyzed, matrix compounds block these active sites, resulting in enhanced analyte signal—a phenomenon known as the "matrix-induced enhancement effect" [64].
For spectroscopic techniques like UV-Vis, matrix interference often results from overlapping absorption bands where other components absorb at similar wavelengths as the target analyte [27]. Additionally, chemical interactions between the analyte and matrix components can modify the analyte's absorptivity or cause precipitation, while suspended particles can cause light scattering, leading to erroneously high absorbance readings [27]. The absence of a separation step prior to detection in UV-Vis spectroscopy makes it particularly vulnerable to these interference mechanisms compared to HPLC [27].
The physicochemical properties of both analytes and potential interferents significantly influence the extent of matrix effects. Factors such as polarity, pH-sensitivity, thermal stability, concentration, and molecular structure all contribute to the manifestation and severity of interference [64]. Understanding these fundamental principles provides the foundation for developing effective strategies to minimize their impact on analytical results.
Impact on HPLC and UV-Vis Analysis
Matrix effects manifest differently in HPLC versus UV-Vis analysis, with distinct implications for method performance and data quality. In HPLC with UV detection, matrix components can cause baseline instability, peak broadening, shifts in retention times, and inaccurate quantification due to co-elution with target analytes [35]. When using more specific detectors like mass spectrometry, matrix effects predominantly appear as ion suppression or enhancement in the ionization source, leading to compromised quantitative accuracy [63] [65]. The complexity of sample matrices directly influences the severity of these effects, with complex samples like biological fluids, environmental extracts, and food products presenting the greatest challenges [35].
For UV-Vis spectroscopy, matrix interference typically results in non-specific absorption, where multiple components contribute to the total measured absorbance at a particular wavelength [27]. This fundamentally limits the technique's selectivity in complex matrices unless extensive sample cleanup is implemented. Additionally, chemical interactions between analytes and matrix components can alter molar absorptivity, leading to inaccurate quantification even when using appropriate calibration models [27]. The technique's applicability depends heavily on the presence of chromophores in the target molecules and the absence of significant interferents at the selected wavelength(s) [27].
Table 1: Comparative Impact of Matrix Effects on HPLC and UV-Vis Techniques
| Parameter | HPLC | UV-Vis Spectroscopy |
|---|---|---|
| Primary Interference Mechanisms | Co-elution, ion suppression/enhancement, column adsorption | Spectral overlap, light scattering, chemical interactions |
| Effect on Sensitivity | Can suppress or enhance detector response | Typically reduces effective sensitivity due to background absorption |
| Effect on Selectivity | Compromised when interferents co-elute with analytes | Fundamentally limited in complex mixtures |
| Quantification Accuracy | Can be significantly affected without proper calibration | Highly susceptible to bias without specific wavelength selection |
| Common Manifestations | Peak shape distortion, retention time shifts, signal alteration | Background absorption, non-linearity, elevated detection limits |
The fundamental differences in how matrix effects impact these techniques inform the selection of appropriate mitigation strategies. While HPLC provides the advantage of physical separation before detection, it requires careful method development to achieve complete resolution of target analytes from potential interferents [35]. UV-Vis spectroscopy, though simpler and more cost-effective, offers limited options for addressing matrix interference beyond sample cleanup and mathematical corrections [27].
Analytical Technique Selection: HPLC vs. UV-Vis
Technical Comparison for Complex Inorganic Samples
Selecting between HPLC and UV-Vis spectroscopy for analyzing complex inorganic samples requires careful consideration of each technique's capabilities, limitations, and susceptibility to matrix effects. Both methods offer distinct advantages and present unique challenges that must be evaluated within the context of specific analytical requirements, sample complexity, and available resources.
High-Performance Liquid Chromatography (HPLC) represents a powerful separation-based approach that physically separates analytes from potential matrix interferents before detection [35]. The core strength of HPLC lies in its high separation efficiency, achieved through differential partitioning of sample components between a stationary phase and a pressurized mobile phase [28]. This technique is particularly valuable for complex inorganic samples containing multiple analytes with similar properties, as it can resolve individual components that would otherwise be indistinguishable using spectroscopic methods alone [35]. Modern HPLC systems offer versatility through various detection options (UV-Vis, fluorescence, MS, ELSD) and column chemistries that can be tailored to specific analytical challenges [35]. When coupled with mass spectrometric detection, HPLC provides unparalleled specificity and sensitivity, enabling identification and quantification of trace-level analytes even in highly complex matrices [65].
UV-Visible Spectroscopy offers a simpler, more cost-effective alternative based on the measurement of light absorption by analytes at specific wavelengths [27]. This technique is particularly well-suited for routine analysis of samples with known composition and minimal interference, where its speed, simplicity, and minimal solvent consumption present significant advantages [27]. However, UV-Vis spectroscopy provides limited selectivity for complex mixtures, as it cannot distinguish between different compounds with similar absorption characteristics without prior separation [27]. The technique's effectiveness depends heavily on the presence of chromophores in the target molecules and the absence of significant spectral interference from matrix components [66].
Table 2: Technical Comparison of HPLC and UV-Vis for Complex Sample Analysis
| Characteristic | HPLC | UV-Vis Spectroscopy |
|---|---|---|
| Separation Capability | Excellent - physically separates analytes | None - measures total absorption |
| Selectivity | High, especially with MS detection | Limited to spectral differences |
| Sensitivity | Excellent (ng-pg range) | Good for strong chromophores (μg range) |
| Analysis Speed | Moderate to slow (minutes to hours) | Fast (seconds to minutes) |
| Sample Throughput | Moderate, limited by separation time | High for simple matrices |
| Operational Cost | High (solvents, columns, maintenance) | Low (minimal consumables) |
| Skill Requirements | High technical expertise needed | Minimal training required |
| Matrix Tolerance | Moderate, requires sample preparation | Low, highly susceptible to interference |
Quantitative Performance Comparison
A comparative study of levofloxacin analysis demonstrates the practical performance differences between HPLC and UV-Vis methods [4]. The HPLC method exhibited a linear range of 0.05-300 μg/ml with a regression equation of y=0.033x+0.010 (R²=0.9991), while the UV-Vis method showed y=0.065x+0.017 (R²=0.9999) across the same concentration range [4]. Recovery studies further highlighted the techniques' differing capabilities in complex matrices: for low, medium, and high concentrations (5, 25, and 50 μg/ml) of levofloxacin, HPLC recovery rates were 96.37±0.50%, 110.96±0.23%, and 104.79±0.06%, respectively, while UV-Vis recovery rates were 96.00±2.00%, 99.50±0.00%, and 98.67±0.06% [4]. These results illustrate UV-Vis's potential for acceptable performance in simple matrices but also highlight HPLC's superior consistency and accuracy in complex samples, despite the apparent outlier in medium concentration recovery.
The selection between HPLC and UV-Vis should be guided by the specific analytical requirements. HPLC is clearly preferable for complex samples requiring high specificity, accurate quantification of multiple components, or trace-level analysis [35]. The initial investment in equipment and expertise yields returns through reliable, definitive results even for challenging matrices. Conversely, UV-Vis offers a practical solution for high-throughput analysis of simpler samples where target analytes are present at relatively high concentrations with minimal interference [27]. Understanding these fundamental differences enables researchers to make informed decisions about technique selection based on their specific analytical needs and available resources.
Strategic Approaches to Minimize Matrix Interference
Sample Preparation Techniques
Effective sample preparation represents the first line of defense against matrix effects in both HPLC and UV-Vis analysis. Well-designed sample preparation protocols can significantly reduce matrix complexity, concentrate target analytes, and enhance method robustness. The optimal approach varies depending on the sample matrix, analytes of interest, and analytical technique employed.
Solid Phase Extraction (SPE) provides a highly versatile and effective method for sample cleanup and analyte enrichment [35]. This technique works by passing a liquid sample through a cartridge containing a selective stationary phase, where target analytes are retained while unwanted matrix components are washed away [35]. The analytes are subsequently eluted with a different solvent, resulting in a purified and concentrated extract. SPE's versatility stems from the availability of various phase chemistries (reverse-phase, ion-exchange, normal-phase) that can be tailored to specific analytical challenges [35]. For example, in environmental analysis, SPE effectively extracts trace pesticides from large water volumes before HPLC analysis, significantly reducing matrix interference [35].
Liquid-Liquid Extraction (LLE) separates components based on their relative solubility in two immiscible liquids [35]. While generally more time-consuming and labor-intensive than SPE, LLE can be highly effective for removing specific interferents. In forensic toxicology, for instance, LLE commonly extracts drugs from biological fluids before HPLC analysis, providing excellent cleanup despite its procedural complexity [35]. The effectiveness of LLE depends heavily on selecting appropriate solvent pairs that maximize partition coefficients for target analytes while minimizing extraction of interferents.
Protein Precipitation offers a rapid, straightforward approach for cleaning up biological samples like plasma or serum, where proteins represent significant potential interferents [35]. This technique involves adding an organic solvent (typically acetonitrile or methanol) to the sample, causing proteins to denature and precipitate out of solution [35]. The remaining supernatant, enriched with small molecules, can then be directly analyzed or subjected to further cleanup. While highly effective for protein removal, this method may not eliminate other matrix components and can sometimes cause co-precipitation of target analytes.
QuEChERS (Quick, Easy, Cheap, Effective, Rugged, and Safe) methodology has gained prominence for multi-residue analysis in complex matrices, particularly for pesticide testing in food and environmental samples [64]. This approach involves an initial extraction with acetonitrile followed by a dispersive SPE cleanup using primary-secondary amine (PSA) and other sorbents to remove fatty acids, pigments, and other interferents [64]. The QuEChERS method balances effectiveness, efficiency, and practicality, making it particularly valuable for high-throughput laboratories analyzing diverse sample types.
Internal Standardization and Calibration Approaches
Calibration strategies play a crucial role in compensating for residual matrix effects that persist despite sample preparation. These approaches acknowledge that complete elimination of matrix interference is often impractical and instead focus on mathematically correcting for its effects.
The internal standard method represents one of the most potent approaches for mitigating matrix effects in quantitative analysis [63]. This technique involves adding a known amount of a reference compound (the internal standard) to every sample, blank, and calibration standard [63]. The internal standard should resemble the target analytes in chemical behavior and extraction characteristics but must be chromatographically or spectrally distinguishable. Instead of plotting detector response versus analyte concentration for calibration, the ratio of analyte signal to internal standard signal is plotted against the ratio of analyte concentration to internal standard concentration [63]. This approach effectively corrects for various sources of variability, including injection volume inconsistencies, extraction efficiency variations, and matrix-induced suppression or enhancement of detector response [63]. Stable isotope-labeled analogs of target analytes represent ideal internal standards for mass spectrometric detection, as they exhibit nearly identical chemical behavior while being distinguishable by mass [63].
Matrix-Matched Calibration involves preparing calibration standards in a matrix that is free of the target analytes but otherwise compositionally similar to the actual samples [64]. This approach aims to subject calibration standards and samples to equivalent matrix effects, thereby compensating for any suppression or enhancement during quantification [64]. The primary challenge lies in obtaining or creating an appropriate blank matrix, which can be particularly difficult for complex samples like specific food commodities or biological fluids [64]. When a true blank matrix is unavailable, alternative approaches include using a similar matrix with demonstrated absence of the target analytes or creating a synthetic matrix that mimics key compositional aspects of the sample [64].
Standard Addition Methodology involves spiking samples with known concentrations of target analytes and measuring the response increase to construct a sample-specific calibration curve [64]. This approach effectively accounts for matrix effects because both native and added analytes experience identical matrix influence [64]. While highly effective, standard addition is time-consuming and impractical for large sample sets, as it requires constructing individual calibration curves for each sample [64]. It finds most appropriate application when analyzing small numbers of samples with particularly challenging or variable matrices.
Matrix Mitigation Workflow
HPLC-Specific Mitigation Strategies
Chromatographic Optimization Techniques
HPLC method development offers numerous parameters that can be optimized to minimize matrix interference through enhanced separation efficiency and selectivity. Systematic optimization of these parameters represents a powerful approach for resolving analytes from potentially interfering matrix components.
Column Selection serves as the foundation of effective HPLC separation [35]. While C18 columns represent the industry standard for many applications, specialized stationary phases can dramatically improve separation for specific compound classes [35]. Hydrophilic Interaction Liquid Chromatography (HILIC) columns excel at retaining highly polar compounds that show minimal retention on reversed-phase columns [35]. Similarly, chiral columns enable separation of enantiomers, while ion-exchange columns effectively separate charged molecules [35]. The selection of column particle size and geometry also significantly impacts separation efficiency; sub-2-micron particles and core-shell technologies provide enhanced efficiency and resolution, potentially resolving analytes from co-extracted matrix components that would otherwise cause interference [5].
Mobile Phase Optimization provides powerful control over separation selectivity [35]. For complex samples, gradient elution—where mobile phase composition changes systematically during the separation—often proves essential for resolving analytes from matrix components with diverse physicochemical properties [35]. Careful optimization of gradient profile (initial and final solvent strength, gradient slope) can dramatically improve separation while maintaining reasonable analysis time [35]. Mobile phase additives such as buffers, ion-pairing reagents, and pH modifiers can further enhance selectivity by modifying analyte retention characteristics [35]. For example, in the analysis of moniliformin in maize, a mixture of 0.01 mol/L KH₂PO₄, methanol, and 0.5 mol/L tetrabutylammonium hydrogen sulphate (75:25:4) delivered at 1 mL/min provided effective separation [4].
Temperature Control, though often overlooked, significantly influences HPLC separations [35]. Controlling column temperature affects mobile phase viscosity, analyte diffusion coefficients, and equilibrium constants for analyte partitioning between stationary and mobile phases [35]. Even modest temperature changes (5-10°C) can substantially alter retention times and selectivity, potentially resolving co-eluting peaks [35]. For thermally labile compounds, maintaining consistent, appropriate temperatures proves essential for preventing degradation during analysis [35].
Two-Dimensional Liquid Chromatography (2D-LC) represents an advanced approach for extremely complex samples where single-dimension separation proves insufficient [35]. This technique employs two different separation mechanisms (e.g., reversed-phase followed by HILIC) in a single analysis, dramatically increasing peak capacity and resolution [35]. While requiring more sophisticated instrumentation and method development, 2D-LC can resolve analytes from matrix components that would be inseparable using conventional chromatography, virtually eliminating certain types of matrix interference [35].
Advanced Detection Strategies
Detector selection and optimization play crucial roles in mitigating the impact of residual matrix interference in HPLC analysis. While UV-Vis detectors remain common, advanced detection techniques offer enhanced specificity that can distinguish target analytes even when complete chromatographic resolution proves challenging.
Mass Spectrometric Detection coupled with HPLC represents the gold standard for selective detection in complex matrices [65]. MS detection provides unparalleled specificity by measuring the mass-to-charge ratio of analyte molecules, effectively distinguishing between co-eluting compounds with different molecular masses [35]. Tandem mass spectrometry (MS/MS) further enhances selectivity by monitoring specific fragmentation pathways, generating unique spectral fingerprints that enable definitive identification even in the presence of substantial matrix interference [35]. The exceptional selectivity of MS detection often eliminates the need for complete chromatographic resolution between analytes and matrix components, simplifying method development and reducing analysis time [65].
Evaporative Light Scattering Detection (ELSD) serves as a universal detection technique particularly valuable for compounds lacking chromophores [35]. ELSD operates by nebulizing the column effluent, evaporating the mobile phase, and measuring the light scattered by the remaining non-volatile analyte particles [35]. Unlike refractive index detection, ELSD proves compatible with gradient elution, making it suitable for complex samples requiring solvent programming [35]. While less sensitive than UV or MS detection, ELSD provides consistent response factors for non-volatile compounds regardless of their chemical structure, making it valuable for certain inorganic analyses where UV detection proves problematic [35].
Diode Array Detection (DAD) enhances conventional UV detection by simultaneously monitoring multiple wavelengths [27]. This capability enables peak purity assessment by comparing spectra across a peak, potentially identifying co-elution that might go unnoticed with single-wavelength detection [27]. Spectral libraries can further aid in identifying unknown peaks and confirming analyte identity, providing an additional dimension of selectivity beyond retention time alone [27].
Table 3: HPLC Detection Techniques for Matrix-Rich Samples
| Detection Technique | Principle | Advantages for Complex Samples | Limitations |
|---|---|---|---|
| Mass Spectrometry (MS) | Mass-to-charge ratio measurement | Unambiguous identification, high sensitivity and selectivity | High cost, complex operation, matrix suppression effects |
| Diode Array Detection (DAD) | Multi-wavelength UV-Vis detection | Peak purity assessment, spectral library matching | Limited to chromophores, less specific than MS |
| Evaporative Light Scattering (ELSD) | Light scattering by non-volatile particles | Universal for non-volatiles, gradient compatible | Less sensitive, requires volatile mobile phases |
| Fluorescence Detection | Emission measurement after excitation | High sensitivity and selectivity for native/derivatized compounds | Limited compound applicability, requires derivatization for many analytes |
| Charged Aerosol Detection (CAD) | Particle charging measurement | Universal response, good sensitivity | Requires volatile mobile phases, nonlinear response |
UV-Vis-Specific Mitigation Strategies
Spectral Resolution Techniques
UV-Vis spectroscopy faces inherent selectivity challenges in complex matrices due to its reliance on absorption measurements without prior separation. Nevertheless, several strategic approaches can enhance method robustness and minimize matrix interference for inorganic samples.
Wavelength Selection represents the most fundamental parameter for minimizing interference in UV-Vis spectroscopy [27]. Rather than simply selecting the wavelength of maximum absorption (λmax) for the target analyte, method development should include a systematic assessment of potential interferents and selection of wavelengths that maximize the analyte signal while minimizing contributions from matrix components [27]. This process typically involves scanning standards of potential interferents alongside the target analyte and identifying spectral regions where the analyte exhibits significant absorption while interferents show minimal response. For example, in the analysis of levofloxacin, the maximum absorption wavelength was determined by scanning standard solutions at 200-400 nm, establishing optimal detection conditions [4].
Derivative Spectroscopy provides a mathematical approach for resolving overlapping spectral bands [27]. By converting normal absorption spectra into first, second, or higher-order derivative spectra, this technique enhances resolution of closely spaced peaks and can effectively eliminate broad background interference from scattering or baseline drift [27]. Derivative spectroscopy proves particularly valuable when the target analyte and interferent have similar but not identical spectral shapes, as the derivative transformation emphasizes spectral differences while suppressing constant background contributions [27].
Multi-Wavelength and Ratio-Based Methods leverage measurements at multiple wavelengths to mathematically correct for interference [27]. The dual-wavelength method selects two wavelengths where the interferent exhibits equal absorbance but the analyte shows different absorption, enabling calculation of analyte concentration independent of interferent contribution [27]. Similarly, the absorbance ratio method utilizes the relationship between absorbance values at different wavelengths to account for background interference [27]. These approaches require thorough characterization of both analyte and interferent spectra but can significantly enhance method specificity without additional instrumentation.
Chemometric Modeling represents an advanced approach for extracting analyte information from complex, overlapping spectra [27]. Techniques such as principal component regression (PCR) and partial least squares (PLS) utilize full spectral data rather than single wavelengths, building multivariate calibration models that can effectively account for known sources of variation, including matrix interference [27]. While requiring substantial method development effort and appropriate software, chemometric approaches can transform UV-Vis spectroscopy from a simple single-analyte technique into a powerful tool for analyzing complex mixtures with minimal sample preparation.
Chemical Derivatization
Chemical derivatization enhances UV-Vis detection by modifying the target analyte to improve its spectroscopic properties or selectivity [27]. This approach involves converting the analyte into a derivative with enhanced molar absorptivity, shifted absorption maximum, or reduced interference from matrix components [27].
Derivatization can serve several specific purposes in mitigating matrix effects. Chromophore Introduction enables detection of compounds that lack native chromophores through chemical reactions that introduce strongly absorbing functional groups [27]. Spectrum Shifting moves the analyte's absorption maximum away from regions where matrix components interfere, achieved through reactions that alter the compound's conjugated system [27]. Selective Derivatization exploits differences in chemical reactivity between the target analyte and potential interferents, using reaction conditions that specifically modify the analyte while leaving matrix components unchanged [27].
Despite its advantages, derivatization introduces additional complexity, including potential side reactions, incomplete conversion, and derivative instability [27]. The optimal derivatization approach must provide reproducible yields, straightforward procedures, and compatibility with the sample matrix. When successfully implemented, chemical derivatization can transform challenging analyses into robust, interference-free methods, significantly expanding the applicability of UV-Vis spectroscopy for complex inorganic samples.
Experimental Protocols for Matrix Effect Assessment
Post-Extraction Addition and Infusion Methods
Systematic assessment of matrix effects is essential for developing robust analytical methods and validating mitigation strategies. Several established protocols provide quantitative measures of matrix effects, enabling objective comparison between different approaches.
The Post-Extraction Addition Method provides a straightforward approach for quantifying matrix effects in chromatographic systems [63]. This protocol involves comparing the detector response for standards prepared in pure solvent versus standards added to pre-extracted sample matrix [63]. The matrix effect (ME) is typically calculated as follows: ME (%) = (B/A - 1) × 100, where A represents the peak area of standards in pure solvent and B represents the peak area of standards in post-extracted matrix [63]. A value of 0% indicates no matrix effect, negative values indicate suppression, and positive values indicate enhancement. This method directly measures the net effect of matrix components on detector response, providing valuable information for method development and validation.
The Continuous Analyte Infusion Method offers a comprehensive assessment of how matrix effects vary throughout a chromatographic run, particularly valuable for LC-MS applications [63]. This protocol involves continuously infusing a dilute solution of the target analyte into the mobile phase stream between the column outlet and the detector inlet while injecting extracted sample matrix [63]. Matrix components eluting from the column cause temporary suppression or enhancement of the analyte signal, creating a "profile" of matrix effects across the chromatogram [63]. Regions showing significant signal deviation indicate where matrix effects are most pronounced, guiding optimization of chromatographic separation to shift analyte elution away from these problematic regions [63].
Matrix Effect Assessment Methods
Standard Addition and Extraction Recovery Protocols
Standard Addition Calibration serves both as a quantification approach and as a diagnostic tool for assessing matrix effects [64]. The protocol involves preparing multiple aliquots of the sample and spiking them with increasing known concentrations of the target analyte [64]. These spiked samples are then analyzed, and the measured response is plotted against the added concentration [64]. The absolute value of the x-intercept represents the native analyte concentration in the sample, while differences in slope between the standard addition curve and solvent-based calibration curve indicate the presence and magnitude of matrix effects [64]. A significant advantage of this approach is that it accounts for all types of matrix effects, providing the most accurate quantification for challenging samples despite being labor-intensive [64].
Extraction Recovery Studies evaluate the efficiency of sample preparation procedures while simultaneously assessing matrix effects [4]. This protocol involves comparing three types of samples: (1) blank matrix spiked with target analytes before extraction, (2) blank matrix extracted then spiked with analytes (post-extraction), and (3) pure solvent standards at equivalent concentrations [4]. Recovery efficiency is calculated by comparing the response from pre-extraction spikes to post-extraction spikes, while matrix effects are assessed by comparing post-extraction spikes to pure solvent standards [4]. For example, in the analysis of levofloxacin, recovery rates of 96.37±0.50%, 110.96±0.23%, and 104.79±0.06% for low, medium, and high concentrations respectively demonstrated both the efficiency of extraction and the presence of matrix effects [4].
These experimental protocols provide objective, quantitative assessment of matrix effects, enabling informed decisions about method suitability and guiding optimization efforts. Implementing these assessments during method development and validation ensures robust performance and reliable quantification, particularly for complex inorganic samples where matrix interference poses significant challenges.
The Scientist's Toolkit: Essential Research Reagents and Materials
Table 4: Essential Research Reagents and Materials for Matrix Mitigation
| Reagent/Material | Function | Application Examples |
|---|---|---|
| Primary-Secondary Amine (PSA) | Removes fatty acids, organic acids, sugars, and other polar interferents | QuEChERS cleanup for food and environmental samples [64] |
| C18 Bonded Silica | Provides reversed-phase retention for non-polar interferents | SPE cleanup for biological and environmental samples [35] |
| Graphitized Carbon Black (GCB) | Removes pigments (chlorophyll, carotenoids) and planar compounds | Cleanup of plant extracts and colored matrices [64] |
| Ion-Exchange Sorbents | Selectively removes ionic interferents based on charge | Cleanup for ionic analytes in complex matrices [35] |
| Stable Isotope-Labeled Internal Standards | Corrects for matrix effects and variability in sample preparation | Quantitative LC-MS analysis of drugs, metabolites, contaminants [63] |
| Analyte Protectants | Mask active sites in GC systems to reduce analyte adsorption | Analysis of pesticides in complex matrices by GC-MS [64] |
| Matrix-Matched Reference Materials | Provides representative matrix for calibration standards | Compensation of matrix effects in quantitative analysis [64] |
| Immunoaffinity Columns | Highly selective extraction based on antibody-antigen recognition | Specific analyte extraction from complex biological matrices [35] |
Matrix interference presents a significant challenge in the analysis of complex inorganic samples using both HPLC and UV-Vis techniques. While HPLC offers superior separation capabilities that can physically resolve analytes from interferents, UV-Vis spectroscopy provides a simpler, more accessible alternative for appropriate applications. The optimal strategy for minimizing matrix effects typically involves a multifaceted approach combining effective sample preparation, chromatographic or spectroscopic optimization, and appropriate calibration methodologies.
For HPLC applications, the combination of efficient sample cleanup (e.g., SPE, QuEChERS), chromatographic optimization (column chemistry, mobile phase composition, temperature), and internal standardization represents the most robust approach for mitigating matrix interference [63] [64] [35]. For UV-Vis methods, strategic wavelength selection, mathematical correction techniques, and chemical derivatization can enhance method specificity despite the technique's inherent limitations [27]. In both cases, systematic assessment of matrix effects using post-extraction addition, standard addition, or recovery studies provides essential validation of method robustness [63] [4] [64].
The selection between HPLC and UV-Vis should be guided by the specific analytical requirements, with HPLC providing the necessary separation power and detection specificity for complex mixtures, while UV-Vis offers practical advantages for simpler matrices or resource-limited settings [4] [27]. As analytical challenges continue to evolve with increasing demands for sensitivity and specificity, the integration of advanced detection techniques like mass spectrometry with sophisticated sample preparation approaches will further enhance our ability to obtain accurate, reliable results from even the most challenging sample matrices [35] [5] [65].
Sensitivity and Limit of Detection (LOD) Enhancement Strategies
The choice between High-Performance Liquid Chromatography (HPLC) and Ultraviolet-Visible (UV-Vis) spectrophotometry for inorganic analysis represents a critical methodological crossroads, with significant implications for sensitivity, detection limits, and analytical workflow. While UV-Vis spectrophotometry offers simplicity and rapid analysis, its sensitivity for inorganic compounds is often limited, typically operating in the µg/mL range for many analytes [67]. In contrast, HPLC systems, particularly when coupled with advanced detection methods, can achieve detection limits in the ng/mL range, representing up to a thousand-fold improvement in sensitivity [67]. This technical guide explores the fundamental mechanisms underlying this sensitivity disparity and provides evidence-based enhancement strategies for researchers developing analytical methods for inorganic samples.
The core challenge in inorganic analysis lies in the often poor chromophoric properties of inorganic species, which lack the extensive π-electron systems that provide strong UV-Vis absorption in organic compounds. This limitation necessitates innovative approaches to both separation and detection for achieving the low detection limits required in modern pharmaceutical, environmental, and materials science applications.
Fundamental Sensitivity Differences Between HPLC-UV and Standalone UV-Vis
The apparent paradox of how coupling a UV detector with HPLC provides superior sensitivity compared to standalone UV-Vis spectrophotometry can be explained by several fundamental technological and operational differences.
Detector Design and Optical Path Considerations
Modern HPLC-UV detectors are engineered for high sensitivity in analytical applications, featuring noise specifications typically below ±1 × 10⁻⁵ absorbance units (AU), which significantly exceeds the performance of most conventional spectrophotometers [68]. This exceptional signal-to-noise ratio enables detection of minute absorbance changes corresponding to low analyte concentrations.
A critical distinction lies in the sample presentation to the detector. Standalone UV-Vis spectrophotometers typically use large volume cuvettes (e.g., 3-5 mL) with standard 10 mm pathlengths [67]. While this longer pathlength should theoretically enhance sensitivity according to Beer-Lambert law, in practice, the concentration detection limit is compromised by higher noise levels in conventional spectrophotometers. Conversely, HPLC-UV detectors utilize specialized low-volume flow cells (typically 8-18 µL for HPLC and 0.5-1 µL for UHPLC) while maintaining effective pathlengths of up to 10 mm through optimized optical design [68]. This configuration significantly enhances mass sensitivity while maintaining excellent concentration detection capabilities.
The HPLC system provides a crucial sample preconcentration and purification step that fundamentally enhances detection capability. While a standalone UV-Vis spectrophotometer analyzes the entire sample matrix, potentially including interfering substances, HPLC first separates the analyte of interest from the sample matrix, effectively concentrating it into a narrow band that passes through the detection cell [30]. This chromatographic focus minimizes background interference and delivers a purified analyte peak to the detector, enabling more sensitive and specific measurement.
As noted in chromatography discussions, "The HPLC detector is less sensitive in concentration terms (more noise) in part because it uses a very small flow cell (8 microliters is typical). That means it can be very sensitive in mass terms" [67]. This distinction highlights that while HPLC-UV may have higher concentration noise in the detector itself, the overall system provides superior mass sensitivity, which is often more relevant for trace analysis where total analyte mass is limited.
Enhancement Strategies for HPLC-Based Analysis
Advanced Stationary Phases and Column Technologies
Mixed-Mode and Functionalized Stationary Phases The development of mixed-mode stationary phases represents a significant advancement for inorganic ion analysis. These columns incorporate multiple retention mechanisms (reversed-phase, cation-exchange, and anion-exchange) within a single stationary phase, enabling simultaneous separation of cationic and anionic species without requiring derivatization [69]. The trimodal columns used in recent pharmaceutical applications demonstrate how this approach provides enhanced selectivity and retention for highly polar inorganic analytes that would otherwise show minimal retention in conventional reversed-phase HPLC [69].
Monolithic Columns for Preconcentration Functionalized monoliths with large macropores are particularly valuable for trace inorganic analysis, as they enable solid-phase extraction (SPE) preconcentration directly coupled with HPLC separation [70]. Their large flow-through channels facilitate sample percolation at high flow rates without generating excessive backpressure, making them ideal for online sample cleanup and preconcentration of inorganic analytes from complex matrices [70].
Table 1: Advanced Stationary Phases for Inorganic Analysis
| Stationary Phase Type | Mechanism | Advantages for Inorganic Analysis | Typical Applications |
|---|---|---|---|
| Trimodal Mixed-Mode | Reverse-phase, cation-exchange, anion-exchange | Simultaneous separation of cations and anions; tunable selectivity | Pharmaceutical counterions; inorganic ions in complex matrices |
| Layered Double Hydroxides (LDHs) | Anion exchange, surface adsorption | High capacity for oxyanions; tunable composition | Chromium, arsenic, selenium oxyanions in environmental samples |
| Functionalized Monoliths | Size exclusion, affinity interactions | Low backpressure; high flow rates; online SPE capability | Preconcentration of trace metals; sample cleanup |
| Ion-Exchange Chromatography | Electrostatic interactions | High selectivity for ionic species; compatible with conductivity detection | Water quality analysis; pharmaceutical excipients |
Detection System Selection and Optimization
Universal Detectors for Non-Chromophoric Compounds For inorganic analytes lacking strong chromophores, evaporative light scattering detection (ELSD) and charged aerosol detection (CAD) provide viable alternatives to UV detection. These detectors operate based on nebulization and evaporation of the mobile phase, followed by detection of the non-volatile analyte particles, making them particularly suitable for inorganic ions and non-chromophoric molecules [69]. Recent applications demonstrate successful simultaneous determination of sodium and phosphate ions in pharmaceutical suspensions using HPLC-ELSD, achieving detection limits suitable for quality control applications [69].
Hyphenated Techniques Coupling HPLC with mass spectrometry (LC-MS) or inductively coupled plasma mass spectrometry (ICP-MS) provides exceptional sensitivity and specificity for inorganic analysis. While these techniques require more sophisticated instrumentation, they offer detection limits often exceeding other methods while providing elemental specificity and isotope information.
Table 2: Detector Options for Inorganic HPLC Analysis
| Detector Type | Detection Principle | LOD Range | Advantages | Limitations |
|---|---|---|---|---|
| UV-Vis | Light absorption by chromophores | 0.01-1 µg/mL | Wide availability; good precision; quantitative accuracy | Limited to UV-absorbing species; matrix interference |
| ELSD | Light scattering by non-volatile particles | 10-100 ng | Universal for non-volatiles; gradient compatible | Non-linear response; moderate sensitivity |
| CAD | Charged aerosol detection | 1-10 ng | Universal response; good sensitivity | Requires volatile mobile phases; non-linear |
| ICP-MS | Elemental mass spectrometry | 0.1-10 pg | Exceptional sensitivity; elemental specificity | Expensive; complex operation; spectral interference |
Sample Preparation and Preconcentration Techniques
Solid-Phase Extraction (SPE) Advancements Layered double hydroxides (LDHs) have emerged as highly effective sorbents for preconcentration of inorganic oxyanions prior to chromatographic analysis [71]. Their tunable composition, high surface area, and anion exchange capacity make them particularly suitable for extracting chromium, arsenic, and selenium oxyanions from complex matrices [71]. The structural formula of LDHs can be represented as [(M²⁺)₁₋ₓ(M³⁺)ₓ(OH)₂]ˣ⁺(Aⁿ⁻)ₓ/ₙ·mH₂O, where M²⁺ and M³⁺ are metal cations that can be selected based on the target analytes, and Aⁿ⁻ is the exchangeable anion [71].
Miniaturization and Automation The trend toward miniaturized extraction devices, including capillary-scale columns and chip-based systems, provides significant sensitivity enhancements by reducing sample and solvent volumes while increasing mass efficiency [70]. This approach is particularly valuable for inorganic analysis where sample volume may be limited, such as in biological or forensic applications.
Methodological Protocols for Enhanced Sensitivity
Protocol 1: Monolithic SPE-HPLC for Trace Metal Analysis
Reagents and Materials:
- Functionalized monolithic SPE column (e.g., glycidyl methacrylate-co-ethylene dimethacrylate)
- HPLC system with UV or MS detection
- Appropriate mobile phase buffers (e.g., ammonium formate, ammonium acetate)
- Standard solutions for calibration
Procedure:
- Condition the monolithic SPE column with 5 column volumes of methanol followed by 10 volumes of the loading buffer.
- Adjust the sample pH to optimize analyte retention (typically pH 5-7 for most metal complexes).
- Load the sample at elevated flow rates (2-5 mL/min) to exploit the low backpressure characteristics of monoliths.
- Wash with 10-15 column volumes of optimized washing buffer to remove interfering matrix components.
- Elute retained analytes directly onto the analytical HPLC column using a compatible elution solvent.
- Separate using a gradient elution program optimized for the target inorganic species.
- Detect using appropriate detection method (UV for complexes, MS for elemental detection).
Key Advantages: This online SPE-HPLC approach minimizes sample handling losses, improves reproducibility, and typically provides 10-100 fold preconcentration factors, significantly enhancing overall method sensitivity [70].
Protocol 2: Mixed-Mode HPLC-ELSD for Inorganic Ions
Reagents and Materials:
- Trimodal mixed-mode column (e.g., Amaze TH)
- HPLC system with ELSD detector
- Ammonium formate buffer (20 mM, pH 3.2)
- Acetonitrile (HPLC grade)
- Nitrogen source for ELSD nebulizer
Procedure:
- Prepare mobile phase consisting of 30% acetonitrile and 70% ammonium formate buffer (20 mM, pH 3.2).
- Set ELSD parameters: drift tube temperature 70°C, nebulizer gas pressure 3.2 bar.
- Establish chromatographic conditions: flow rate 1.0 mL/min, column temperature 40°C, injection volume 20 μL.
- For sample preparation, dilute suspension samples 10-fold with water, vortex mix, and centrifuge at 20,000 rcf for 15 minutes.
- Filter supernatant through 0.45 μm PTFE membrane prior to injection.
- Perform separation using isocratic conditions with runtime of 15-20 minutes.
- Quantify using external calibration with standards prepared in the same matrix.
Key Advantages: This approach enables simultaneous determination of cationic and anionic species without derivatization, providing robust performance for complex pharmaceutical formulations with detection limits suitable for quality control applications [69].
Experimental Design and Workflow Optimization
The following workflow diagram illustrates the decision process for selecting appropriate sensitivity enhancement strategies based on analytical requirements:
The Scientist's Toolkit: Essential Research Reagents and Materials
Table 3: Essential Research Reagents for Enhanced Inorganic Analysis
| Reagent/Material | Function | Application Notes |
|---|---|---|
| Layered Double Hydroxides (LDHs) | SPE sorbent for oxyanions | High capacity for Cr, As, Se oxyanions; tunable composition [71] |
| Trimodal Mixed-Mode Columns | Simultaneous cation/anion separation | Combines reversed-phase, cation-exchange, anion-exchange mechanisms [69] |
| Monolithic SPE Columns | Online preconcentration | Low backpressure; high flow rates; suitable for large volume samples [70] |
| Ammonium Formate Buffer | Volatile mobile phase component | MS-compatible; appropriate for mixed-mode separations [69] |
| Tetrabutylammonium Salts | Ion-pairing reagents | Enhances retention of inorganic ions in reversed-phase systems [72] |
| Functionalized Magnetic Nanoparticles | Dispersive SPE sorbents | Rapid separation; high surface area; reusable [71] |
The strategic enhancement of sensitivity and detection limits in inorganic analysis requires a systematic approach that considers the complementary strengths of HPLC and UV-Vis methodologies. While UV-Vis spectrophotometry offers simplicity for routine analysis of samples with adequate concentration and minimal matrix effects, HPLC-based approaches provide superior capabilities for trace analysis in complex matrices. The ongoing development of advanced stationary phases, detection technologies, and sample preparation methods continues to expand the capabilities of both techniques, enabling researchers to address increasingly challenging analytical problems in inorganic chemistry across pharmaceutical, environmental, and materials science applications.
Through appropriate method selection and optimization based on the specific analytical requirements, researchers can achieve the sensitivity and detection limits necessary for their applications while maintaining efficiency and practicality in routine implementation.
Data Integrity and Decision-Making: Validation Protocols and Direct Comparison
In the field of analytical chemistry, particularly for inorganic sample analysis, the choice of analytical technique is paramount. High-performance liquid chromatography (HPLC) and ultraviolet-visible (UV-Vis) spectroscopy represent two fundamental approaches with distinct advantages and limitations. The reliability of data generated by these techniques hinges on the proper validation of key analytical parameters. This guide provides an in-depth examination of four core validation parameters—accuracy, precision, linearity, and range—within the context of comparing HPLC and UV-Vis methodologies for inorganic samples, providing researchers and drug development professionals with a technical framework for method selection and validation.
Fundamental Techniques: HPLC and UV-Vis Spectroscopy
UV-Vis Spectroscopy measures the absorption of ultraviolet or visible light by a compound in solution. The technique is based on the Beer-Lambert law, which relates absorbance to concentration. It is primarily used for quantitative analysis of compounds containing chromophores and is characterized by its simplicity, rapid analysis time, and cost-effectiveness [27]. However, its major limitation is the potential for spectral interference in complex mixtures, as it cannot physically separate components [73].
High-Performance Liquid Chromatography separates components of a mixture based on their differential partitioning between a mobile liquid phase and a stationary phase. HPLC coupled with UV detection combines separation capability with quantitative detection. The dominant advantage of HPLC is its superior resolving power for complex samples, allowing for the quantitation of multiple components simultaneously, including analytes and their impurities [30]. This makes it particularly valuable for stability-indicating assays and inorganic speciation studies [13].
Table 1: Fundamental Comparison of HPLC and UV-Vis Techniques
| Parameter | UV-Vis Spectroscopy | HPLC |
|---|---|---|
| Principle | Absorption of light by chromophores | Separation followed by detection |
| Selectivity | Limited; overlaps common in mixtures | High; excellent separation capabilities |
| Applications | Routine QC of simple samples | Complex formulations, impurity profiling, stability assays |
| Cost & Equipment | Low cost; simple setup | High cost; complex instrumentation |
| Sample Preparation | Minimal | Often requires extensive optimization |
Core Validation Parameters
Accuracy
Accuracy refers to the closeness of agreement between the measured value and a known reference value or true value. It is typically expressed as percent recovery and is crucial for verifying that a method correctly quantifies the target analyte without significant bias from the sample matrix [27].
Experimental Protocol for Determining Accuracy: Accuracy is determined through recovery studies using the standard addition method. A known amount of a reference standard is added to a pre-analyzed sample at multiple concentration levels (e.g., 80%, 100%, 120% of the target concentration). Each level is prepared in triplicate and analyzed. The percentage recovery is calculated using the formula: [ \% \text{ Recovery } = \frac{\text{Found Concentration} - \text{Original Concentration}}{\text{Added Concentration}} \times 100 ] The mean recovery across all levels should ideally be between 98-102% [74].
Precision
Precision describes the closeness of agreement between a series of measurements obtained from multiple sampling of the same homogeneous sample under prescribed conditions. It is expressed as relative standard deviation (RSD) or coefficient of variation and does not relate to the true value [27].
Levels of Precision:
- Repeatability: Precision under the same operating conditions over a short interval of time (intra-day).
- Intermediate Precision: Precision within-laboratory variations (e.g., different days, different analysts, different instruments) [74].
Experimental Protocol for Determining Precision: A homogeneous sample solution is prepared at 100% of the test concentration. For repeatability, this sample is injected six times, and the RSD of the measured content is calculated. For intermediate precision, the same sample is analyzed on different days or by different analysts, and the combined RSD is reported. An RSD of less than 2.0% is generally acceptable for HPLC methods, with UHPLC capable of achieving below 0.1% RSD [30].
Linearity
Linearity is the ability of the method to obtain test results that are directly proportional to the concentration of the analyte in a given range. It is established by plotting a calibration curve of response versus concentration and assessing it through statistical methods [27].
Experimental Protocol for Establishing Linearity: A stock solution of the reference standard is prepared and serially diluted to at least five different concentrations across the specified range. Each concentration is analyzed in triplicate. The peak area (for HPLC) or absorbance (for UV-Vis) is plotted against the concentration, and the data is subjected to linear regression analysis. The correlation coefficient (r²) should be greater than 0.999 for HPLC and preferably greater than 0.998 for UV-Vis methods [73] [74].
Range
The range of an analytical method is the interval between the upper and lower concentrations of analyte for which it has been demonstrated that the method has a suitable level of precision, accuracy, and linearity. The range is typically derived from the linearity study and is expressed as the span from the LOQ to the highest concentration tested [27].
Comparative Analysis of HPLC and UV-Vis Performance
The practical application of these validation parameters reveals significant differences between HPLC and UV-Vis methods. A study on repaglinide demonstrated that both techniques can be validated successfully but with different performance characteristics. The HPLC method showed a wider linear range (5-50 µg/mL) compared to the UV method (5-30 µg/mL) and superior precision (lower % RSD) [74].
Table 2: Comparative Validation Data from Literature
| Study Compound | Parameter | UV-Vis Performance | HPLC Performance |
|---|---|---|---|
| Repaglinide [74] | Linearity (R²) | > 0.999 | > 0.999 |
| Precision (% RSD) | < 1.50 | < 1.50 (but generally lower) | |
| Accuracy (% Recovery) | 99.63 - 100.45 | 99.71 - 100.25 | |
| Levofloxacin [4] | Accuracy (% Recovery) | 96.00 - 99.50 | 96.37 - 110.96 |
| Lamivudine/TDF [73] | LOQ (μg/mL) | 1.40 (LAM), 7.90 (TDF) | Lower than UV (specific values not given) |
A direct comparison study of levofloxacin analysis concluded that "it is not accurate to measure the concentration of drugs loaded on the biodegradable composite composites by UV-Vis" and that "HPLC is the preferred method to evaluate sustained release characteristics" [4]. The recovery rates for levofloxacin at low, medium, and high concentrations were more consistent and closer to 100% for HPLC compared to UV-Vis, especially for complex sample matrices.
For inorganic analysis, such as arsenic speciation, HPLC with various detectors (UV, MS, MS/MS) has proven essential. While UV detection for inorganic arsenic species provided a linear range of 0.50 to 25 μg/mL with a sensitivity of 500 ng/mL, the use of MS/MS detection dramatically improved the sensitivity to 5 ng/mL, demonstrating how detector choice within HPLC systems expands the method's capabilities [13].
Experimental Protocols for Inorganic Sample Analysis
Protocol 1: HPLC-UV for Arsenic Speciation
This protocol is adapted from methods for speciation and quantitation of inorganic arsenic in water samples [13].
Research Reagent Solutions:
- Stationary Phase: Strong anion exchange (SAX) column.
- Mobile Phase: Aqueous ammonium carbonate and methanol.
- Standard Solutions: Stock solutions of arsenite and arsenate prepared in 0.1 N sodium hydroxide.
- Sample Preparation: Water samples are filtered and diluted as necessary. For solid samples, extraction with a suitable solvent is required.
Experimental Workflow:
- Prepare stock solutions of arsenite and arsenate at 1 mg/mL in 0.1 N NaOH.
- Dilute to create a calibration curve from 0.50 to 25 μg/mL.
- Set HPLC conditions: isocratic or gradient elution with ammonium carbonate/methanol mobile phase; flow rate of 0.5-1.5 mL/min; UV detection at an appropriate wavelength (e.g., 190-210 nm).
- Inject standards and samples (10-50 μL injection volume).
- Plot peak area versus concentration for each species to establish linearity, accuracy, and precision.
Protocol 2: Third-Order Derivative UV Spectrophotometry
For mixtures with overlapping spectra, derivative spectrophotometry can resolve analytes without physical separation, as demonstrated for antiretroviral drugs [73].
Research Reagent Solutions:
- Solvent: 0.1 M Hydrochloric acid or other suitable solvent.
- Standard Solutions: Lamivudine and Tenofovir disoproxil fumarate stock solutions at 1000 μg/mL in methanol.
- Equipment: UV-Vis spectrophotometer with derivative software capabilities.
Experimental Workflow:
- Prepare individual drug solutions and scan from 200-350 nm to obtain zero-order spectra.
- Calculate the derivative spectra (first to fourth order) using the instrument software.
- Identify a wavelength where one analyte shows a significant amplitude (e.g., a peak or trough) and the other shows zero amplitude (zero-crossing point).
- For Lamivudine and Tenofovir, the third-order derivative (D³) with amplitudes at 240 nm and 262.5 nm, respectively, was found suitable.
- Construct calibration curves by plotting the derivative amplitude at the selected wavelength against concentration for each drug.
Visualizing the Method Selection and Validation Workflow
The following diagram illustrates the logical decision-making process for selecting and validating an analytical method for inorganic samples, incorporating the key parameters discussed.
Decision Workflow for Analytical Methods
The Scientist's Toolkit: Essential Research Reagent Solutions
The following table details key reagents and materials essential for conducting the experiments and validation procedures described in this guide.
Table 3: Essential Research Reagents and Materials
| Item | Function/Purpose | Example Use Case |
|---|---|---|
| HPLC-Grade Solvents | High purity mobile phase components to minimize baseline noise and detect low-level analytes. | Preparation of mobile phase for HPLC-UV analysis of arsenic species [13]. |
| Certified Reference Standards | Provide known purity materials for calibration, accuracy, and linearity studies. | Quantitation of arsenite and arsenate in water samples [13]. |
| Buffer Salts | Control pH and ionic strength of mobile phase to optimize separation and peak shape. | Use of ammonium carbonate buffer in arsenic speciation [13]. |
| Derivatization Reagents | Chemically modify non-UV detectable compounds to introduce a chromophore. | Not specified in results, but used for analyzing non-chromophoric inorganics. |
| Stationary Phases | The solid support in the column responsible for separating analytes based on chemical properties. | Strong Anion Exchange (SAX) column for arsenic speciation [13]. |
The selection between HPLC and UV-Vis spectroscopy for inorganic sample analysis is not a matter of superiority but of appropriateness for the specific analytical challenge. UV-Vis spectroscopy offers a rapid, cost-effective solution for simple, single-component analyses where the analyte possesses a strong chromophore and the matrix is uncomplicated. However, for complex mixtures, inorganic speciation studies, and situations requiring high specificity and accuracy, HPLC is the unequivocal technique of choice due to its powerful separation capabilities. The rigorous validation of accuracy, precision, linearity, and range ensures that whichever method is selected, it generates reliable, reproducible data fit for its intended purpose, ultimately supporting robust scientific research and rigorous quality control in drug development.
High-Performance Liquid Chromatography (HPLC) and Ultraviolet-Visible (UV-Vis) spectroscopy represent two foundational analytical techniques in modern laboratories, each with distinct advantages and limitations. This whitepaper provides a direct technical comparison of these methods, focusing on the critical parameters of sensitivity, specificity, speed, and cost of ownership. The analysis is framed within the context of inorganic sample research, offering scientists a rigorous framework for method selection based on application requirements, regulatory constraints, and economic considerations. As analytical instrumentation evolves with trends toward miniaturization, connectivity, and green chemistry, understanding these core differentiators becomes increasingly essential for efficient laboratory operation and robust analytical outcomes.
Core Technical Comparison
The selection between HPLC and UV-Vis methodologies requires a fundamental understanding of their operational characteristics. The following table provides a direct comparison of these techniques across key performance and economic parameters.
Table 1: Direct comparison of HPLC and UV-Vis techniques
| Parameter | HPLC | UV-Vis Spectroscopy |
|---|---|---|
| Sensitivity | Superior; capable of trace-level and impurity detection down to ppm/ppb levels [27] [5] | Good for direct analysis of compounds with strong chromophores; typically suitable for percent-level analyses unless pre-concentration is used [27] |
| Specificity/Selectivity | High; excellent separation capabilities reduce interference from complex matrices [27] | Limited; prone to spectral overlaps and interference from excipients or degradation products [27] [4] |
| Analysis Speed | Moderate; run times vary from minutes to tens of minutes depending on the method [27] | Fast; rapid analysis, often in seconds to minutes, with minimal sample preparation [27] [75] |
| Equipment Cost | High capital cost ($20,000 - $70,000 for analytical systems); complex instrumentation [27] [76] | Low cost; simple setup and substantially lower initial investment [27] |
| Cost of Ownership | High; includes costly solvents, columns, maintenance, and skilled operation [27] [5] [76] | Low; minimal solvent use, lower maintenance costs, and less training required [27] |
| Sample Throughput | Moderate to High (when automated); suitable for batch processing but limited by run time [76] | Very High; ideal for rapid, routine analysis of many samples [75] |
| Sample Preparation | Often extensive; requires optimized mobile phases, filtration, and may need derivatization [27] [5] | Minimal; often direct measurement after dissolution or dilution [27] |
| Key Applications | Complex mixture analysis, impurity profiling, stability-indicating methods, pharmacokinetic studies [27] [5] | Routine QC, simple API quantification, raw material identification, dissolution testing [27] [77] |
Experimental Protocols for Method Comparison
To empirically validate the differences outlined in Table 1, researchers can implement the following experimental protocols. These methodologies are adapted from comparative studies and highlight the practical considerations for each technique.
Protocol for HPLC Analysis of Drug Release from a Composite Scaffold
This protocol, based on a study comparing methods for quantifying Levofloxacin released from a mesoporous silica/nano-hydroxyapatite composite scaffold, demonstrates HPLC's application in complex, inorganic-heavy matrices [4].
1. Equipment and Reagents:
- HPLC System: Shimadzu liquid chromatograph or equivalent, equipped with a UV-Vis detector [4].
- Chromatographic Column: Sepax BR-C18 column (250 × 4.6 mm; 5 µm particle size) or similar reverse-phase column [4].
- Chemicals: Levofloxacin reference standard, methanol (HPLC-grade), potassium dihydrogen phosphate (KH₂PO₄), tetrabutylammonium hydrogen sulphate (analytical grade) [4].
- Mobile Phase: A mixture of 0.01 mol/L KH₂PO₄, methanol, and 0.5 mol/L tetrabutylammonium hydrogen sulphate in a ratio of 75:25:4. Filter and degas prior to use [4].
2. Chromatographic Conditions:
- Flow Rate: 1.0 mL/min [4]
- Column Temperature: 40°C [4]
- Detection Wavelength: 290 nm [4]
- Injection Volume: 10 µL for assay determination [4]
3. Sample Preparation:
- Extract the drug from the composite scaffold using an appropriate solvent such as simulated body fluid (SBF) [4].
- For complex matrices, a liquid-liquid extraction step is recommended. Vortex the sample with an internal standard (e.g., Ciprofloxacin) for 5 minutes, add dichloromethane, vortex again, and centrifuge at 7,155 × g for 5 minutes [4].
- Collect the organic layer, evaporate to dryness under a nitrogen stream in a 50°C water bath, and reconstitute the residue in the mobile phase [4].
4. Analysis:
- Inject the prepared samples and standards. Quantify the target analyte by comparing the peak area (or peak area ratio relative to the internal standard) against a calibration curve [4].
Protocol for UV-Vis Analysis of an Active Compound in a Cosmetic Formulation
This protocol, derived from a study quantifying bakuchiol in cosmetic seras, illustrates a typical UV-Vis workflow and its limitations in complex, multi-component samples [9].
1. Equipment and Reagents:
- UV-Vis Spectrophotometer: A standard instrument, such as a Shimadzu UV-2600 [4].
- Solvent: High-purity ethanol or another solvent that fully dissolves the analyte and is transparent at the measurement wavelength [9].
2. Wavelength Selection:
- Prepare a standard solution of the target compound.
- Scan the solution across a relevant range (e.g., 200-400 nm) to identify the wavelength of maximum absorption (λmax). For bakuchiol, this was found to be 262 nm [9].
3. Calibration Curve:
- Prepare a series of standard solutions at known concentrations.
- Measure the absorbance of each standard at the predetermined λmax.
- Plot absorbance versus concentration to generate a calibration curve [9].
4. Sample Preparation and Analysis:
- For simple oil-based formulations, dissolve a weighed amount of the sample directly in ethanol and measure the absorbance [9].
- Critical Note: For emulsions (oil-in-water), complete dissolution and extraction of the analyte may not be possible, leading to inaccurate quantification. This highlights a key limitation of UV-Vis for complex samples [9].
- Calculate the concentration of the analyte in the sample using the calibration curve.
Workflow and Method Selection Visualization
The decision to use HPLC or UV-Vis spectroscopy depends on the sample complexity and analytical requirements. The following diagram outlines a logical workflow for method selection.
The Scientist's Toolkit: Essential Research Reagent Solutions
Successful implementation of either HPLC or UV-Vis methodology requires access to specific, high-quality reagents and materials. The following table details essential items and their functions.
Table 2: Key research reagents and materials for HPLC and UV-Vis analysis
| Item | Function/Application | Technical Notes |
|---|---|---|
| HPLC-Grade Solvents (e.g., Methanol, Acetonitrile) | Serve as the mobile phase or its components in HPLC. | Low UV absorbance and high purity are critical to minimize baseline noise and ghost peaks [4] [5]. |
| Certified Reference Standards | Used for instrument calibration, method development, and quantification. | Essential for achieving accurate and reliable results in both HPLC and UV-Vis [4] [9]. |
| Chromatographic Columns (e.g., C18) | The core separation unit in HPLC where analyte separation occurs. | Choice of column chemistry (reverse-phase, ion-exchange, etc.) is dictated by the analyte properties [4] [76]. |
| Sample Vials and Septa | Hold samples for injection in HPLC and autosamplers. | Must be chemically inert and compatible with the sample solvent to avoid leaching and contamination [78]. |
| Buffer Salts (e.g., KH₂PO₄, Tetrabutylammonium Salts) | Modify the mobile phase pH and ionic strength to optimize separation and peak shape in HPLC. | Often required for reverse-phase chromatography of ionizable compounds [4]. |
| UV-Transparent Solvents (e.g., Ethanol, Water) | Dissolve samples for UV-Vis analysis. | Must be transparent at the wavelength of analysis to allow for accurate absorbance measurement of the analyte [9]. |
Future Trends and Evolving Capabilities
The analytical instrumentation landscape is dynamic, with both HPLC and UV-Vis technologies undergoing significant advancement. Key trends shaping their future include:
- Green Analytical Chemistry: A push to reduce the environmental impact of analytical methods is driving innovation in both fields. For HPLC, this includes the development of methods that use less solvent, the adoption of supercritical fluid chromatography (SFC), and the use of eco-friendly solvents [27] [79]. For UV-Vis, efforts focus on waste reduction through method optimization [27].
- Automation and Intelligence: HPLC systems are increasingly integrating artificial intelligence (AI) for automated method development, predictive maintenance, and data processing, trimming analysis times and freeing up skilled analyst resources [79] [80]. Modern UV-Vis instruments feature intuitive interfaces, pre-programmed methods, and guided workflows that minimize user error and training time [75].
- Miniaturization and Portability: The demand for field-deployable and point-of-care analysis is fostering the development of compact, portable UV-Vis devices [75] [77] and microfluidic HPLC systems [5]. This trend maximizes lab space and enables analytical capabilities in non-traditional settings.
- Hyphenated Techniques: The combination of HPLC's separation power with the detection capabilities of mass spectrometry (LC-MS) is becoming more prevalent, providing unparalleled specificity and sensitivity for complex analyses like impurity profiling and multi-attribute monitoring of biologics [79] [78].
In the analytical analysis of inorganic samples, the choice of technique is paramount to achieving accurate and reliable results. While UV-Vis spectrophotometry has been a traditional mainstay, High-Performance Liquid Chromatography (HPLC) offers distinct advantages in specificity and interference resolution that are critical for complex sample matrices. The fundamental challenge with UV-Vis spectrophotometry is its low specificity, as different molecules with similar chromophores can interfere with one another, leading to inaccurate readings [81]. In contrast, HPLC provides high specificity by separating drug, impurities, degradation products, and excipients before quantification, with each peak corresponding to a different compound confirmed by retention time and sometimes peak purity [81]. This technical guide examines the core principles behind HPLC's superior performance in resolving interferences, providing methodologies for its implementation, and contextualizing its application within inorganic sample research.
Fundamental Principles of Separation and Detection
Core Mechanism of HPLC
HPLC is a broad analytical chemistry technique used to separate compounds in a chemical mixture through pressure-driven flow of a mobile phase through a column packed with a stationary phase [82]. The separation occurs due to varying degrees of interaction between analytes and the stationary phase, with physically separated compounds then detected and quantified [82]. This physical separation before detection is the foundational advantage HPLC holds over spectroscopic techniques.
An HPLC instrument consists of four major components: a pump to deliver the mobile phase, an autosampler to inject the sample, a stationary phase column to separate the sample compounds, and a detector to measure the compounds [82]. The translated data output is called a chromatogram, where the x-axis represents time and the y-axis measures the specific signal generated by the detector [82].
Chromatographic Resolution: The Quantitative Measure
Chromatographic resolution (R_s) quantitatively measures the degree of separation between two adjacent peaks and is the primary concern for any separation [83] [82]. The resolution equation is defined as:
Rs = (t2 - t1) / [(w1 + w_2)/2]
Where t1 and t2 are the retention times of two adjacent peaks, and w1 and w2 are their corresponding baseline peak widths [83]. For Gaussian-shaped peaks, an Rs value of 1.0 indicates approximately 2.2% peak overlap, while Rs ≥ 1.5 indicates nearly complete baseline separation with only 0.1% overlap [83]. This quantitative framework allows scientists to objectively optimize separations to minimize interference between analytes.
Figure 1: HPLC instrumental workflow demonstrating the sequential process from mobile phase delivery to chromatogram generation
UV-Vis Spectrophotometry Limitations
UV-Vis spectrophotometry operates on fundamentally different principles, measuring how much ultraviolet or visible light is absorbed by a sample at a specific wavelength according to Beer-Lambert's law [81]. This technique works best with clear, single-component solutions but suffers from a critical limitation: if excipients or impurities absorb UV at the same wavelength as the target analyte, results become inaccurate [81]. The technique offers low specificity because different molecules with similar chromophores can interfere, making it unsuitable for complex mixtures without extensive sample preparation [81].
Comparative Analysis: HPLC vs. UV-Vis Spectrophotometry
Direct Technical Comparison
The table below summarizes the key differences between HPLC and UV-Vis spectrophotometry across critical analytical parameters:
Table 1: Technical comparison between HPLC and UV-Vis Spectrophotometry
| Parameter | HPLC | UV-Vis Spectrophotometry |
|---|---|---|
| Principle | Separation based on distribution between stationary and mobile phases [81] | Measurement of UV light absorption at specific wavelength [81] |
| Specificity | High - each peak corresponds to different compound confirmed by retention time [81] | Low - different molecules with similar chromophores interfere [81] |
| Sample Requirements | Can handle complex mixtures; separates analytes from interferences [81] | Works best with clear, single-component solutions [81] |
| Sensitivity | High (UV detector: ng-µg/mL; MS detector: pg-ng/mL) [81] | Moderate (usually µg/mL level) [81] |
| Regulatory Acceptance | Standard method in pharmacopeias for assays, impurities, dissolution [81] | Rarely accepted as sole method for complex formulations [81] |
Resolution of Interferences
HPLC's capacity to resolve interferences stems from its two-dimensional separation capability - first by retention time in the column, followed by potentially additional dimensions of detection (peak purity, spectral matching). When matrix interferences occur, they can mask, suppress, augment, or make imprecise sample signal measurements [84]. These effects can manifest chromatographically as coelution or during ionization in mass spectrometric detection [84].
HPLC addresses these challenges through both physical separation and advanced detection strategies. Modern diode array detectors capture full UV-visible spectra for each eluting compound, enabling peak purity assessments through spectral deconvolution and compound identification through spectral matching against reference libraries [85]. This capability becomes essential when dealing with complex pharmaceutical impurity profiles where traditional single-wavelength detection might miss critical information [85].
Interferences in liquid chromatography can originate from multiple sources, which must be understood to develop effective mitigation strategies:
- Reagents and Solvents: Water is one of the main sources of interference peaks, particularly problematic for detection methods involving low wavelengths [86]. Various salts can also contribute to chromatographic interference, as can organic solvents that have been dispensed for use and repeatedly exposed to air [86].
- Sample Preparation Equipment: Pipette tips, disposable pipettes, and syringes - mostly plastic - are chemically less inert compared to glassware, making them more likely to introduce interference peaks, especially when detecting at low wavelengths (e.g., 210 nm) [86].
- HPLC System Issues: Strongly retained substances from previous injections can elute in subsequent runs, characterized by broad peaks [86]. Bacterial growth in the water line of systems using aqueous mobile phases can also introduce interference peaks over time [86].
Experimental Protocols for Interference Investigation
Protocol 1: Identifying Interference Sources Through Systematic Elimination
- Replace all mobile phase constituents with fresh, high-purity alternatives, using high-quality water specifically for low-wavelength detection methods [86].
- Install a ghost peak trapping column to effectively prevent interferences caused by water impurities and inorganic salts [86].
- Evaluate all sample contact surfaces by running a blank through the entire sample preparation process, replacing plasticware with glass alternatives where interference peaks are observed [86].
- Perform intensive system cleaning using appropriate solvents to remove strongly retained substances, extending the elution time or increasing elution strength if the issue persists [86].
Protocol 2: Method Specificity Testing According to Regulatory Standards
- Analyze placebo formulations containing all excipients without the active ingredient to confirm the absence of interfering peaks at retention times of interest [81].
- Stress samples (acid/base hydrolysis, thermal, oxidative degradation) to demonstrate separation of degradation products from the main peak and from each other [81].
- For inorganic samples, use standard addition methods to demonstrate that the analyte can be accurately quantified in the presence of the sample matrix [84].
Advanced HPLC Techniques for Enhanced Specificity
Two-Dimensional Liquid Chromatography (2D-LC)
For exceptionally complex samples, two-dimensional liquid chromatography employs two complementary column chemistries in series for multi-dimensional separation [82]. Three unique types of 2D-LC methods are available:
- Comprehensive 2D-LC: The entire sample separates in the first dimension column and subsequently separates on a second complementary second dimension column [82].
- Heart-cut 2D-LC: Automatically transfers specific eluent fractions from the first-dimension column to a complementary second-dimension column to resolve difficult or co-eluting peaks [82].
Detection Technologies for Enhanced Specificity
While UV detection remains common, advanced detection technologies significantly enhance specificity:
- Diode Array Detection (DAD): Enables peak purity assessment by collecting full spectra throughout the peak, allowing detection of coeluting compounds with different spectral characteristics [85].
- Mass Spectrometric Detection (LC-MS): Provides ultimate specificity through mass-to-charge ratio measurement, enabling definitive compound identification and dealing with coeluting peaks through unique MRM transitions [84] [82].
- Charged Aerosol Detection (CAD): A universal detector that responds to non-volatile and semi-volatile analytes regardless of their optical properties, particularly useful for compounds lacking chromophores [12].
Table 2: HPLC Detection Methods for Specific Applications
| Detection Method | Principle | Best For | Limitations |
|---|---|---|---|
| UV/Vis Detection | Measures UV light absorption by analytes [82] | Compounds with chromophores; routine analyses [81] | Unable to detect compounds without suitable UV chromophores [12] |
| Mass Spectrometry | Measures mass-to-charge ratio of ions [82] | Definitive identification; complex matrices [84] | Higher cost; requires operator expertise [84] |
| Charged Aerosol (CAD) | Detects charged particles after mobile phase evaporation [12] | Compounds lacking chromophores; universal detection [12] | Requires volatile mobile phases; non-linear response [12] |
| Evaporative Light Scattering (ELSD) | Measures light scattered by analyte particles [12] | Non-chromophoric compounds; natural products [12] | Less sensitive than CAD; particle size limitations [12] |
The Scientist's Toolkit: Essential Research Reagents and Materials
Table 3: Essential research reagents and materials for HPLC analysis of inorganic samples
| Item | Function | Considerations |
|---|---|---|
| Chromatography-grade water | Mobile phase component; sample preparation [86] | Use high-quality water to avoid interference peaks, especially for low-wavelength detection [86] |
| HPLC-grade solvents | Mobile phase constituents [86] | Low UV cutoff; minimal interference peaks; use fresh solvents to avoid contamination [86] |
| Ghost peak trapping column | Removes contaminants from mobile phases [86] | Install between mobile phase reservoir and pump to effectively prevent interferences [86] |
| Stable Isotopically Labeled Internal Standards | Corrects for matrix effects during electrospray ionization [84] | Nitrogen-15 (^15^N) and carbon-13 (^13^C) labeled standards preferred over deuterated to eliminate deuterium isotope effects [84] |
| Solid-Phase Extraction (SPE) Cartridges | Sample preparation; preconcentration; interference removal [84] | Particularly useful in aqueous environmental matrices for detecting analytes present in low concentrations [84] |
Method Development and Optimization Strategies
Systematic Approach to HPLC Method Development
Developing a robust HPLC method requires a systematic approach to address potential interferences:
- Column Selection: Choose stationary phase chemistry based on analyte properties - reversed-phase (C18, C8) for most organic compounds, ion-exchange for charged species, or HILIC for polar compounds [82].
- Mobile Phase Optimization: Adjust pH, buffer concentration, and organic modifier percentage to achieve optimal separation. For gradient methods, optimize the gradient profile to balance resolution and analysis time [82].
- Detection Wavelength Selection: For UV detection, choose wavelengths that offer optimal sensitivity while minimizing interference from mobile phase constituents [86].
- System Suitability Assessment: Establish criteria for resolution, tailing factor, theoretical plates, and repeatability to ensure method reliability [85].
Figure 2: HPLC method development workflow with iterative optimization based on resolution assessment
HPLC demonstrates clear superiority over UV-Vis spectrophotometry in resolving interferences for inorganic sample analysis through its fundamental capacity to physically separate analytes before detection. The technique's specificity stems from its two-dimensional discrimination based on both retention time and detection characteristics, enabling it to handle complex mixtures that would compromise UV-Vis analysis. While method development requires careful consideration of potential interference sources and systematic optimization of separation parameters, the resulting methods provide robust, reliable, and regulatory-accepted analytical procedures. For researchers and drug development professionals working with inorganic samples, HPLC offers an indispensable tool for achieving the specificity required for accurate quantification in complex matrices.
In the pharmaceutical industry, ensuring the quality, safety, and efficacy of drug products requires robust analytical procedures. The International Council for Harmonisation (ICH) provides the definitive framework for validating these analytical methods. The ICH Q2(R2) guideline, titled "Validation of Analytical Procedures," offers comprehensive recommendations for the validation of analytical procedures included in registration applications submitted to regulatory authorities within ICH member regions [87]. This guideline applies to new or revised analytical procedures used for the release and stability testing of commercial drug substances and products, encompassing both chemical and biological/biotechnological entities [87]. Furthermore, it can be extended to other analytical procedures that form part of the control strategy, following a risk-based approach [87].
The primary objective of analytical method validation is to demonstrate that the procedure is suitable for its intended purpose. The ICH Q2(R2) guideline serves as a collection of terms and their definitions, providing guidance on how to derive and evaluate the various validation tests for each analytical procedure [87]. It addresses the most common purposes of analytical testing, including assay/potency, purity, impurities, identity, and other quantitative or qualitative measurements [87]. For researchers and scientists, particularly in the context of selecting between techniques like High-Performance Liquid Chromatography (HPLC) and UV-Vis Spectrophotometry, a deep understanding of these guidelines is not merely a regulatory hurdle but a fundamental component of sound scientific practice, ensuring the generation of reliable and meaningful data.
Core Validation Parameters According to ICH Q2(R2)
The ICH Q2(R2) guideline delineates a set of key validation characteristics that must be considered based on the type of analytical procedure. The specific requirements vary depending on whether the method is intended for identification, testing for impurities, or assay content/potency. The following table summarizes these core parameters and their typical applicability.
Table 1: Key Analytical Validation Parameters as per ICH Guidelines
| Validation Parameter | Definition | Typical Application in Quantitative Analysis |
|---|---|---|
| Accuracy | The closeness of agreement between the accepted reference value and the value found. | Demonstrated across the specified range of the procedure, often via recovery studies [74]. |
| Precision(Repeatability, Intermediate Precision) | The closeness of agreement between a series of measurements. | Expressed as relative standard deviation (%RSD); repeatability assessed with multiple measurements of a homogeneous sample [74]. |
| Specificity | The ability to assess the analyte unequivocally in the presence of components that may be expected to be present. | Critical for impurity methods and assay in complex matrices; ensures no interference [29]. |
| Detection Limit (LOD) | The lowest amount of analyte in a sample that can be detected, but not necessarily quantified. | Based on signal-to-noise ratio, standard deviation of the response, and slope of the calibration curve [74]. |
| Quantitation Limit (LOQ) | The lowest amount of analyte in a sample that can be quantitatively determined. | Established using signal-to-noise ratio, standard deviation of the response, and slope of the calibration curve [74]. |
| Linearity | The ability of the method to obtain test results directly proportional to the concentration of analyte. | Evaluated using a minimum of 5 concentrations; reported with correlation coefficient and y-intercept [74]. |
| Range | The interval between the upper and lower concentrations of analyte for which suitability has been demonstrated. | Defined from LOQ to 120-150% of the test concentration for assay [87]. |
| Robustness | A measure of the method's capacity to remain unaffected by small, deliberate variations in method parameters. | Indicates the reliability of the method during normal usage [74]. |
The validation process involves designing experiments to systematically evaluate each relevant characteristic against pre-defined acceptance criteria, which are based on the method's intended use and the product's specifications. The workflow below illustrates the logical sequence for establishing a fully validated analytical method.
HPLC vs. UV-Vis for Inorganic Analysis: A Comparative Framework
When framing analytical method selection within a broader research thesis, comparing HPLC and UV-Vis Spectrophotometry for inorganic samples reveals distinct advantages and limitations. This comparison is crucial for making an informed, science-based decision that aligns with both analytical needs and regulatory standards.
Performance and Regulatory Compliance
A direct comparison of the two techniques, as applied to pharmaceutical compounds, highlights significant differences in their performance metrics, which are critical for validation.
Table 2: Comparative Method Validation: HPLC vs. UV-Vis for API Quantification
| Validation Characteristic | HPLC Performance (e.g., Repaglinide) | UV-Vis Performance (e.g., Repaglinide) | Comparison Insight |
|---|---|---|---|
| Linearity Range | 5–50 μg/mL [74] | 5–30 μg/mL [74] | HPLC offers a wider dynamic range for quantification. |
| Precision (%RSD) | < 1.50% [74] | < 1.50% [74] | Both can achieve high precision, though HPLC is often superior. |
| Accuracy (% Recovery) | 99.71–100.25% [74] | 99.63–100.45% [74] | Both techniques can demonstrate excellent accuracy. |
| Specificity | High (separates analytes) [29] | Moderate (measures total absorbance) [29] | HPLC is inherently more specific due to chromatographic separation. |
| Sensitivity (LOD) | Can reach 5 ng/mL with MS/MS [13] | ~500 ng/mL for Arsenic [13] | HPLC, especially with advanced detectors, provides far superior sensitivity. |
Strategic Considerations for Inorganic Samples
The choice between HPLC and UV-Vis is particularly nuanced when dealing with inorganic compounds, such as the speciation of arsenic in water.
Complexity and Specificity: UV-Vis spectrophotometry measures the total absorbance of a sample at a specific wavelength. For a simple inorganic solution with a single absorbing species and no interferents, UV-Vis can be a rapid and cost-effective choice [88]. However, for complex mixtures like environmental water samples containing multiple arsenic species (arsenite and arsenate), UV-Vis lacks the inherent specificity to distinguish between them. HPLC, coupled with a UV detector, provides a powerful solution by first separating the species chromatographically before detection [13]. This separation is a prerequisite for accurate speciation analysis, which is critical because different inorganic species, such as arsenite vs. arsenate, can have vastly different toxicities [13].
Sensitivity and Detection Needs: The fundamental sensitivity of a stand-alone UV-Vis instrument is often insufficient for detecting trace levels of inorganic contaminants at regulatory limits, such as the EPA's 10 ppb standard for arsenic in drinking water [13]. As evidenced in research, the limit of detection for arsenic using ion chromatography with UV detection was only 500 ng/mL (0.5 ppm), which is 50 times higher than the regulatory limit [13]. In contrast, HPLC systems coupled with mass spectrometry (MS) detectors can achieve detection limits as low as 5 ng/mL (5 ppb), meeting and exceeding regulatory requirements [13]. This makes HPLC-MS the gold standard for trace inorganic analysis where high sensitivity is paramount.
Throughput and Cost: UV-Vis spectrophotometry holds a clear advantage in terms of analysis speed, ease of use, and lower operational cost [89] [88]. It is an excellent tool for high-throughput, routine quality control of known substances in a clean matrix where specificity is not a concern. HPLC, while more complex and expensive, delivers unparalleled separation power, specificity, and the flexibility to be coupled with a wide array of detectors (UV, MS, Conductivity) to handle challenging analytical problems [29].
Experimental Protocols for Method Validation
To illustrate the practical application of ICH guidelines, below are detailed protocols for key validation experiments, drawing from cited studies.
Protocol for Linearity and Range Evaluation
This experiment establishes the relationship between analyte concentration and instrument response.
- Preparation of Standard Solutions: Prepare a standard stock solution of the analyte (e.g., 1000 μg/mL in a suitable solvent). For the HPLC method of repaglinide, serial dilutions were made using the mobile phase to cover a concentration range of 5–50 μg/mL. For the UV-Vis method, dilutions were made with methanol to cover 5–30 μg/mL [74].
- Analysis: Inject each concentration in triplicate into the HPLC system or measure the absorbance with UV-Vis.
- Data Analysis: Plot the mean response (peak area for HPLC, absorbance for UV) against the concentration. Perform regression analysis using the least squares method to calculate the slope, y-intercept, and correlation coefficient (r²). A value of r² > 0.999 is typically expected for a linear relationship [74].
Protocol for Accuracy Assessment via Recovery Study
This experiment determines the closeness of the measured value to the true value.
- Sample Preparation: Begin with a pre-analyzed sample (e.g., placebo or a known tablet formulation). For repaglinide tablets, a powder equivalent to 10 mg of the drug was dissolved and diluted [74].
- Standard Addition: Spike the sample with known quantities of the reference standard at three different concentration levels (e.g., 80%, 100%, 120% of the target concentration). Prepare each level in triplicate.
- Analysis and Calculation: Analyze the spiked samples using the validated method. Calculate the percentage recovery using the formula: Recovery (%) = (Found Concentration / Theoretical Concentration) × 100 The mean recovery across all levels should ideally be in the range of 98–102% [74].
Case Study: Inorganic Arsenic Speciation Workflow
A practical example of HPLC-UV application for inorganic analysis is the speciation of arsenite (As(III)) and arsenate (As(V)) in water [13].
- Instrumentation: An HPLC system equipped with a strong anion-exchange (SAX) column and a UV detector.
- Mobile Phase: An aqueous ammonium carbonate buffer with a gradient of methanol.
- Sample Preparation: Stock solutions of arsenite and arsenate are prepared in 0.1 N sodium hydroxide. Working standards are diluted in deionized water to create a calibration curve from 0.50 to 25 μg/mL.
- Analysis: Samples and standards are injected. The anions are separated on the SAX column and detected by UV absorbance at an appropriate wavelength.
- Validation: The method demonstrated excellent linearity (R² > 0.99) for both species. The limit of detection for UV was 500 ng/mL, highlighting its utility for higher-level quantification but its inadequacy for sub-ppb regulatory limits, for which MS detection is required [13].
The Scientist's Toolkit: Essential Reagents and Materials
The following table lists key materials and reagents used in the development and validation of the analytical methods discussed in the cited research, along with their critical functions.
Table 3: Essential Research Reagents and Materials for Analytical Method Development
| Item | Specification / Example | Function in the Analytical Procedure |
|---|---|---|
| Reference Standard | Repaglinide (USV Lab. Pvt. Ltd.) [74] | Serves as the primary benchmark for identifying and quantifying the analyte with high purity. |
| Chromatographic Column | Agilent TC-C18 (250 mm × 4.6 mm, 5 μm) [74] | Stationary phase for HPLC that separates mixture components based on chemical interactions. |
| HPLC-Grade Solvent | Methanol, Water [74] | Used to prepare mobile phase and standard solutions; high purity is critical to minimize background noise. |
| Buffer Salt | Orthophosphoric Acid (for pH adjustment) [74] | Modifies the pH of the mobile phase to control separation efficiency and analyte retention time. |
| Anion Exchange Column | Strong Anion Exchange (SAX) Column [13] | Specialized column for separating ionic species like arsenite and arsenate. |
| pH Adjuster | Ammonium Carbonate [13] | Used to prepare the buffered eluent for ion chromatography separations. |
Navigating ICH Q2(R2) guidelines is fundamental to developing analytical methods that are not only compliant but also scientifically sound. The strategic choice between HPLC and UV-Vis spectrophotometry for inorganic sample research hinges on a clear understanding of the analytical problem. UV-Vis offers simplicity, speed, and cost-effectiveness for routine, high-throughput analyses where specificity and ultra-trace sensitivity are not required. In contrast, HPLC provides superior separation power, specificity, and sensitivity, especially when coupled with advanced detectors like mass spectrometers. This makes it the indispensable technique for complex matrices, speciation studies, and meeting stringent regulatory limits. Ultimately, a risk-based approach, grounded in the ICH validation framework, enables scientists and researchers to select the most fit-for-purpose technique, ensuring the generation of reliable data that underpins drug quality and patient safety.
A Strategic Framework for Selecting the Right Technique for Your Project
In the realm of scientific research and drug development, the selection of an appropriate analytical technique is pivotal to the success of any project. High-Performance Liquid Chromatography (HPLC) and Ultraviolet-Visible (UV-Vis) spectroscopy represent two foundational methodologies with distinct capabilities and applications. While both techniques leverage the interaction of light with matter, they offer different levels of specificity, sensitivity, and operational complexity. This guide provides a structured framework for researchers to evaluate and select the most suitable technique based on specific project requirements, with particular consideration for the analysis of inorganic samples.
The fundamental distinction lies in their operational principles: UV-Vis spectroscopy measures the absorption of light at specific wavelengths by a sample, providing a sum total of all light-absorbing components [1]. In contrast, HPLC first separates the complex mixture into individual components through a chromatographic column before detection, typically using UV-Vis detection among other options [30]. This core difference dictates their respective strengths in qualitative versus quantitative analysis, specificity, and applicability to complex samples.
Fundamental Principles and Instrumentation
UV-Vis Spectroscopy: Principles and Components
UV-Vis spectroscopy operates on the principle that molecules absorb light in the ultraviolet (100-400 nm) and visible (400-700 nm) regions of the electromagnetic spectrum. When light at a specific wavelength strikes a molecule, electrons are promoted from their ground state to an excited state, resulting in measurable absorption [1]. The relationship between absorption and concentration is governed by the Beer-Lambert law: A = ε × c × l, where A is absorbance, ε is the molar absorptivity, c is concentration, and l is the path length [1].
A typical UV-Vis spectrophotometer consists of several key components:
- Light source: Often a combination of deuterium (UV) and tungsten/halogen (visible) lamps
- Wavelength selector: Monochromators or filters to select specific wavelengths
- Sample holder: Typically quartz cuvettes for UV studies
- Detector: Photomultiplier tubes (PMT) or photodiodes to convert light to electrical signals [1]
HPLC: Principles and Components
HPLC separates mixtures based on differential partitioning between a mobile liquid phase and a stationary phase packed into a column. Components elute at different retention times, allowing for individual identification and quantification [30]. Modern HPLC systems include:
- Pump: Delivers high-pressure mobile phase
- Injector: Introduces sample into the mobile phase stream
- Column: Contains stationary phase for separation
- Detector: Typically UV-Vis, but various other detectors available
- Data system: Records and processes chromatographic data [30]
The separation efficiency is measured by theoretical plates, with modern systems achieving 20,000 plates or more, providing peak capacities of ~200 under gradient conditions [30].
Technical Comparison: HPLC versus UV-Vis
Table 1: Comparative Analysis of HPLC and UV-Vis Spectroscopy
| Parameter | HPLC | UV-Vis Spectroscopy |
|---|---|---|
| Analytical Principle | Separation followed by detection | Direct absorption measurement |
| Specificity | High (separates components) | Low (measures total absorbance) |
| Sensitivity | Excellent (LOQ ~0.01-0.05%) [30] | Good, but matrix-dependent |
| Quantitative Precision | High (<0.1-0.3% RSD) [30] | Moderate to high |
| Analysis Time | Longer (minutes to hours) | Rapid (seconds to minutes) |
| Sample Complexity Handling | Excellent for complex mixtures | Limited to simple mixtures |
| Method Development | Complex, multiple parameters | Straightforward |
| Equipment Cost | High | Low to moderate |
| Operational Expertise | Substantial required | Minimal training needed |
| Universal Detection | Limited without MS [30] | Broad, but non-specific |
Table 2: Application-Based Selection Criteria
| Project Requirement | Recommended Technique | Rationale |
|---|---|---|
| Routine concentration checks | UV-Vis | Rapid, cost-effective for known analytes |
| Complex mixture analysis | HPLC | Superior separation capability |
| Trace impurity detection | HPLC | Better sensitivity and specificity [4] |
| High-throughput screening | UV-Vis | Faster analysis times |
| Regulated QC environments | HPLC | Superior precision and robustness [30] |
| Limited sample volume | Both (cuvette-free systems available) | Adapted instrumentation for small volumes [1] |
| Unknown compound identification | HPLC with advanced detection | Separation enables characterization |
Decision Framework for Technique Selection
The following decision pathway provides a systematic approach for selecting between HPLC and UV-Vis based on project-specific parameters:
Diagram 1: Technique Selection Decision Pathway
Sample Complexity Evaluation
The first critical assessment involves characterizing sample complexity:
- Simple systems (single analyte or non-interfering mixtures): UV-Vis is typically sufficient, as demonstrated in bakuchiol analysis in simple cosmetic formulations where it provided adequate quantification [9].
- Complex mixtures: HPLC is necessary when multiple components with similar absorption characteristics are present, as it provides physical separation before detection [30].
Data Quality Requirements
The required level of data quality and regulatory compliance significantly impacts technique selection:
- High-precision quantification: HPLC provides superior precision (<0.1-0.3% RSD) essential for pharmaceutical quality control and stability studies [30].
- Regulatory compliance: HPLC is preferred in regulated environments due to its robustness and ability to demonstrate method validity across laboratories [30].
- Research screening: UV-Vis offers adequate precision for preliminary studies with faster turnaround times.
Resource Considerations
Practical constraints often influence technique selection:
- Equipment access: UV-Vis spectrophotometers are more universally available in laboratories.
- Operator expertise: HPLC requires substantial experience for method development and troubleshooting [30].
- Time constraints: UV-Vis provides rapid analysis (seconds to minutes) versus HPLC (minutes to hours) [9] [1].
- Cost considerations: UV-Vis has lower initial investment and operating costs.
Experimental Protocols and Methodologies
UV-Vis Spectroscopy Protocol for Concentration Analysis
Table 3: Essential Research Reagents and Materials for UV-Vis Analysis
| Item | Specification | Function/Purpose |
|---|---|---|
| UV-Vis Spectrophotometer | Xenon lamp or dual lamp (deuterium + tungsten) | Light source and detection system [1] |
| Cuvettes | Quartz (UV range) or optical glass (visible range) | Sample holder with defined path length [1] |
| Solvent | HPLC-grade, UV-transparent | Sample dissolution and reference blank |
| Reference Standard | High-purity analyte | Calibration curve establishment |
| Volumetric Flasks | Class A, various volumes | Precise solution preparation |
| Pipettes | Calibrated, variable volume | Accurate liquid transfer |
Detailed Methodology:
- Wavelength Selection: Scan standard solution from 200-400 nm to identify maximum absorption wavelength (λmax) [9] [1].
- Preparation of Standard Solutions: Create a series of standard solutions covering the expected concentration range (e.g., 0.05-300 µg/mL) [4].
- Blank Measurement: Measure the pure solvent to establish baseline absorption [1].
- Standard Curve Generation: Measure absorbance of standard solutions and plot against concentration.
- Sample Analysis: Measure unknown samples under identical conditions.
- Quantification: Calculate sample concentration using the standard curve equation.
Critical Considerations:
- Maintain absorbance values below 1.0 for quantitative accuracy [1].
- Ensure sample homogeneity and complete dissolution.
- Use matched cuvettes for sample and reference.
HPLC Protocol for Compound Separation and Quantification
Table 4: Essential Research Reagents and Materials for HPLC Analysis
| Item | Specification | Function/Purpose |
|---|---|---|
| HPLC System | Binary or quaternary pump, autosampler, column oven | Mobile phase delivery, sample introduction, temperature control |
| HPLC Column | C18 (reverse phase), normal phase, HILIC, etc. | Stationary phase for compound separation |
| Mobile Phase | HPLC-grade solvents, buffers, modifiers | Carrier medium for sample through column |
| Reference Standards | High-purity target analytes and internal standards | Identification and quantification |
| Syringe Filters | 0.22 µm or 0.45 µm porosity | Sample clarification and particulate removal |
| Vials and Caps | HPLC-certified, limited volume | Sample containment during analysis |
Detailed Methodology:
- Column Selection: Choose appropriate stationary phase (e.g., C18 for reverse-phase separation) [9] [30].
- Mobile Phase Preparation: Prepare isocratic or gradient mobile phase system with appropriate buffers (e.g., ammonium formate) and organic modifiers (e.g., acetonitrile, methanol) [9] [4].
- System Equilibration: Flush column with mobile phase until stable baseline is achieved.
- Detection Wavelength: Set based on analyte's absorption characteristics (e.g., 260 nm for bakuchiol) [9].
- Calibration Standards: Prepare series of standards covering expected concentration range.
- Sample Preparation: Extract and dissolve samples appropriately, filter if necessary.
- Chromatographic Separation: Inject samples and run method with optimized parameters.
- Peak Integration and Quantification: Identify analyte peaks and calculate concentrations using calibration curve.
Critical Considerations:
- Perform system suitability tests before analysis [30].
- Optimize separation conditions (flow rate, gradient, temperature) for resolution and analysis time.
- Validate method for linearity, accuracy, precision, LOD, and LOQ [4].
Comparative Case Studies
Case Study 1: Bakuchiol Quantification in Cosmetic Products
A direct comparison of UV-Vis, HPLC, and NMR for quantifying bakuchiol in cosmetic serums demonstrated technique-dependent outcomes [9]:
- UV-Vis: Successfully quantified bakuchiol in simple oil solutions (samples 1, 3, 4) but failed with complex emulsions (samples 5, 6) due to incomplete extraction and dissolution issues.
- HPLC: Provided accurate quantification across all sample types, identifying discrepancies between actual and declared content (sample 1 contained only 50% of declared bakuchiol).
- Conclusion: HPLC was necessary for complex formulations, while UV-Vis sufficed for simple solutions with proper sample preparation.
Case Study 2: Levofloxacin Analysis in Drug Delivery Systems
Research comparing HPLC and UV-Vis for quantifying levofloxacin released from mesoporous silica microspheres/nano-hydroxyapatite composite scaffolds revealed significant methodological differences [4]:
- Accuracy: HPLC demonstrated superior accuracy with recovery rates of 96.37±0.50% to 110.96±0.23% across concentrations versus 96.00±2.00% to 99.50±0.00% for UV-Vis.
- Interference Handling: HPLC effectively separated levofloxacin from scaffold components, while UV-Vis measurements were compromised by matrix effects.
- Conclusion: HPLC was recommended for accurate drug release profiling from complex delivery systems.
Advanced Applications and Hybrid Approaches
HPLC-UV-Vis Synergy in Modern Analysis
The integration of UV-Vis detection with HPLC creates a powerful hybrid approach that leverages the strengths of both techniques:
- HPLC-UV: Combines separation power of HPLC with spectroscopic detection
- Diode Array Detection (DAD): Provides full spectral data for each eluting peak, enabling peak purity assessment
- Method Development: UV-Vis can screen optimal detection wavelengths before HPLC method development
Emerging Trends and Technological Advances
Diagram 2: Technological Advances in HPLC and UV-Vis Techniques
Recent technological developments have expanded application possibilities for both techniques:
- UHPLC: Ultra-high pressure systems providing higher resolution and faster analysis [30].
- Advanced Detection: Charged aerosol detection (CAD) and evaporative light scattering (ELSD) address HPLC's "lack of universal detector" limitation [30].
- Miniaturization: Cuvette-free UV-Vis systems enabling microvolume analysis [1].
- Data Integration: Combined chemometric approaches using both techniques for comprehensive sample characterization [90].
Selecting between HPLC and UV-Vis spectroscopy requires careful consideration of project objectives, sample characteristics, and resource constraints. The following strategic recommendations emerge from comparative analysis:
Prioritize UV-Vis when: Dealing with simple matrices, requiring rapid analysis, working with limited resources, or performing preliminary screening studies.
Select HPLC when: Analyzing complex mixtures, requiring high specificity and precision, working in regulated environments, or needing component separation.
Consider hybrid approaches: Leverage UV-Vis for initial method development and HPLC for definitive analysis, or utilize HPLC with UV-Vis detection for combined separation and spectroscopic characterization.
The optimal technique selection balances scientific requirements with practical constraints, ensuring that data quality aligns with project objectives while efficiently utilizing available resources. As both technologies continue to evolve, their complementary nature will further enhance their roles in the analytical scientist's toolkit.
Conclusion
The choice between HPLC and UV-Vis for inorganic analysis is not a matter of one technique being universally superior, but rather of selecting the right tool for the specific analytical question. UV-Vis spectrophotometry offers a fast, cost-effective, and efficient solution for the quantitative analysis of single, UV-active inorganic species in simple matrices. In contrast, HPLC, particularly when coupled with versatile detectors, provides unparalleled separation power and specificity for complex mixtures, making it indispensable for profiling multiple analytes or when potential interferences are present. The decision framework should prioritize the sample's complexity, the required specificity, and the necessary data integrity for regulatory submission. Future directions point towards the increased use of hyphenated techniques like HPLC-MS for ultimate identification power and the ongoing development of more robust and sensitive detection systems to push the boundaries of trace inorganic analysis in biomedical research.
References
- 1. UV-Vis Spectroscopy: Principle, Strengths and Limitations ... [https://www.technologynetworks.com/analysis/articles/uv-vis-spectroscopy-principle-strengths-and-limitations-and-applications-349865]
- 2. 4.4: UV-Visible Spectroscopy [https://chem.libretexts.org/Bookshelves/Analytical_Chemistry/Physical_Methods_in_Chemistry_and_Nano_Science_(Barron)/04%3A_Chemical_Speciation/4.04%3A_UV-Visible_Spectroscopy]
- 3. Principles of UV/vis spectroscopy (2) Basics of absorption ... [https://www.jasco-global.com/principle/principles-of-uv-vis-spectroscopy-2-basics-of-absorption-spectroscopy/]
- 4. Comparison of high-performance liquid chromatography ... [https://pmc.ncbi.nlm.nih.gov/articles/PMC6425260/]
- 5. Advantages, Limitations, And Future Trends Of High- ... [https://www.alwsci.com/news/advantages-limitations-and-future-trends-of-85237687.html]
- 6. How HPLC Detectors Work [https://www.thermofisher.com/us/en/home/industrial/chromatography/chromatography-learning-center/liquid-chromatography-information/hplc-system-components/how-hplc-detectors-work.html]
- 7. High-performance liquid chromatography [https://en.wikipedia.org/wiki/High-performance_liquid_chromatography]
- 8. 3.2: High Performance Liquid chromatography [https://chem.libretexts.org/Bookshelves/Analytical_Chemistry/Physical_Methods_in_Chemistry_and_Nano_Science_(Barron)/03%3A_Principles_of_Gas_Chromatography/3.02%3A_High_Performance_Liquid_chromatography]
- 9. Comparison of Quantification Using UV-Vis, NMR, and ... [https://www.mdpi.com/1422-0067/26/14/6638]
- 10. Comparison of Quantification Using UV-Vis, NMR, and ... [https://pubmed.ncbi.nlm.nih.gov/40724887/]
- 11. Advantages and Applications of UV-Vis Analysis [https://www.richmondscientific.com/advantages-and-applications-of-uv-vis-analysis?srsltid=AfmBOoqzlUgE7tEQmQkRb2rJR477uAd49sD1sHruwgo38rbZKVYtQIFD]
- 12. Universal detection in high performance liquid ... [https://www.europeanpharmaceuticalreview.com/article/33076/universal-detection-in-high-performance-liquid-chromatography/]
- 13. A comparison of the determination and speciation ... [https://www.sciencedirect.com/science/article/abs/pii/S1570023217317233]
- 14. Uv-vis spectroscopy - (Inorganic Chemistry I) [https://fiveable.me/key-terms/inorganic-chemistry-i/uv-vis-spectroscopy]
- 15. Ultraviolet Visible Spectrophotometry - an overview [https://www.sciencedirect.com/topics/medicine-and-dentistry/ultraviolet-visible-spectrophotometry]
- 16. HPLC Method Development Steps [https://www.thermofisher.com/us/en/home/industrial/chromatography/chromatography-learning-center/liquid-chromatography-information/hplc-method-development-steps.html]
- 17. HPLC Method Development and Validation for ... [https://www.pharmtech.com/view/hplc-method-development-and-validation-pharmaceutical-analysis]
- 18. Seeing is Believing: Detectors for HPLC [https://www.chromatographyonline.com/view/seeing-believing-detectors-hplc]
- 19. Development of Stability-Indicating Analytical Procedures ... [https://www.chromatographyonline.com/view/development-of-stability-indicating-analytical-procedures-by-hplc-an-overview-and-best-practices]
- 20. Visible Spectroscopy: Principles, Methods & Applications UV [https://www.vedantu.com/chemistry/uv-visible-spectroscopy]
- 21. - High Methods for Determining... Performance Liquid Chromatography [https://pubmed.ncbi.nlm.nih.gov/38180794/]
- 22. Ultraviolet-Visible Spectroscopy (UV-Vis) and Colourimetry [https://scienceready.com.au/pages/uv-vis-spectroscopy?srsltid=AfmBOoog0vtqVg2hkYTFzYkW832vLkh618D8oFgOu_kTz2Kt7x-c7ff2]
- 23. The complexation color development—visible ... [https://www.sciencedirect.com/science/article/abs/pii/S0026265X24009640]
- 24. How HPLC Detectors Work | Thermo Fisher Scientific - CA [https://www.thermofisher.com/ca/en/home/industrial/chromatography/chromatography-learning-center/liquid-chromatography-information/hplc-system-components/how-hplc-detectors-work.html]
- 25. Comparison of LC detection methods in the investigation ... [https://www.sciencedirect.com/science/article/abs/pii/S0731708597002355]
- 26. Comparing HPLC Detectors: Sensitivity and Range Analysis [https://eureka.patsnap.com/report-comparing-hplc-detectors-sensitivity-and-range-analysis]
- 27. Study of Comparative And UV Methods for Estimation of Drug HPLC [https://www.ijsrtjournal.com/article/Comparative+Study+of+UV+And+HPLC+Methods+for+Estimation+of+Drug]
- 28. High-Performance Liquid Chromatography (HPLC): Principles ... [https://www.openaccessjournals.com/articles/highperformance-liquid-chromatography-hplc-principles-applications-versatality--efficiency-innovation--and-comparative-analysis-in-18065.html]
- 29. The Eyes of HPLC: Strategic Use of Detectors [https://www.qbdgroup.com/en/blog/hplc-detectors-drug-development-quality-control]
- 30. The Essence of Modern HPLC: Advantages, Limitations ... [https://www.chromatographyonline.com/view/essence-modern-hplc-advantages-limitations-fundamentals-and-opportunities]
- 31. HPLC Detectors Explained: Master 3 free skills that matter [https://pharmacores.com/the-eyes-of-hplc-for-seeing-what-only-matters/]
- 32. UHPLC: Advancements and Challenges [https://lifesciences.danaher.com/us/en/products/chromatography-columns/topics/ultra-high-performance-liquid-chromatography-developments.html]
- 33. Advantages and Applications of UV-Vis Analysis [https://www.richmondscientific.com/advantages-and-applications-of-uv-vis-analysis?srsltid=AfmBOorI48MWfU0XoiCW9cvZBv9ZxtWqHFtp4AqKLsW57ZHjUhzH3MIM]
- 34. difference between UV-spectrophotometer and HPLC- ... [http://www.chromforum.org/viewtopic.php?t=10576]
- 35. High-Performance Liquid Chromatography (HPLC) for ... [https://www.labmanager.com/high-performance-liquid-chromatography-hplc-for-complex-mixtures-34238]
- 36. HPLC Basics: What You Should Know [https://www.thermofisher.com/blog/analyteguru/hplc-basics-what-you-should-know/]
- 37. Back to Basics: The Role of pH in Retention and Selectivity [https://www.chromatographyonline.com/view/back-basics-role-ph-retention-and-selectivity]
- 38. Overview of Liquid Sample Preparation Techniques for ... [https://www.mdpi.com/1420-3049/29/19/4752]
- 39. Development and Validation of a New HPLC Method for the ... [https://pmc.ncbi.nlm.nih.gov/articles/PMC3614759/]
- 40. The four critical water quality tests every pharmaceutical ... [https://blog.kruger.dk/the-four-critical-water-quality-tests-every-pharmaceutical-lab-must-monitor-6]
- 41. Pharmaceutical Water Testing [https://cptclabs.com/pharmaceutical-water/]
- 42. Comparative validation of UV-spectrophotometry and RP ... [https://www.sciencedirect.com/science/article/abs/pii/S0003269724002689]
- 43. Green Approaches in High-Performance Liquid ... [https://pmc.ncbi.nlm.nih.gov/articles/PMC12430196/]
- 44. Applications of metal complexes in analytical chemistry [https://www.sciencedirect.com/science/article/abs/pii/S001085452300557X]
- 45. 2.2: UV-Visible Spectroscopy - Metal Ions [https://chem.libretexts.org/Bookshelves/General_Chemistry/Book%3A_Structure_and_Reactivity_in_Organic_Biological_and_Inorganic_Chemistry_(Schaller)/Structure_and_Reactivity_in_Organic_Biological_and_Inorganic_Chemistry_II%3A_Practical_Aspects_of_Structure_-_Purification_and_Spectroscopy/02%3A_Ultraviolet-Visible_Spectroscopy/2.02%3A_UV-Visible_Spectroscopy_-_Metal_Ions]
- 46. High Performance Liquid Chromatography - an overview [https://www.sciencedirect.com/topics/engineering/high-performance-liquid-chromatography]
- 47. A Review of Analytical Techniques for the Determination ... [https://pmc.ncbi.nlm.nih.gov/articles/PMC10097010/]
- 48. Deep learning–based turbidity compensation for ultraviolet ... [https://www.frontiersin.org/journals/environmental-science/articles/10.3389/fenvs.2022.986913/full]
- 49. Stray Light - an overview [https://www.sciencedirect.com/topics/engineering/stray-light]
- 50. Stray Light Causes and Reduction Gigahertz-Optik [https://www.gigahertz-optik.com/en-us/service-and-support/knowledge-base/stray-light-suppression-correction-in-spectroradiometers/]
- 51. Different methods for resolving overlapping UV spectra of ... [https://bmcchem.biomedcentral.com/articles/10.1186/s13065-023-01007-z]
- 52. Noise reduction and background correction of overlapped ... [https://www.sciencedirect.com/science/article/abs/pii/S0030401825004389]
- 53. Mobile-Phase Optimization Strategies in Reversed- ... [https://www.chromatographyonline.com/view/mobile-phase-optimization-strategies-reversed-phase-hplc-0]
- 54. Mobile Phase Optimization: A Critical Factor in HPLC [https://www.phenomenex.com/knowledge-center/hplc-knowledge-center/mobile-phase-in-chromatography?srsltid=AfmBOoptNq1G0CDBycxV3IYxT9yYUcWmaiMRLxmYyQhwXEpRJfM6uhl6]
- 55. Optimizing Mobile Phase Composition: A Practical Approach ... [https://www.mastelf.com/optimizing-mobile-phase-composition-a-practical-approach-to-enhancing-hplc-performance/]
- 56. Different Types of HPLC Columns Used in Analysis [https://www.pharmaguideline.com/2016/01/different-types-of-columns-used-in-hplc.html]
- 57. HPLC Columns & LC Columns | Types, How to ... - GL Sciences [https://www.glsciencesinc.com/hplc-columns?srsltid=AfmBOoo0v3IruWTJfrZetffczubDw5WwCASbOVhjAcTkEe_JwIt5h7vz]
- 58. Real Solutions to Improve Your HPLC Peak Resolution [https://www.thermofisher.com/blog/analyteguru/real-solutions-to-improve-your-hplc-peak-resolution/]
- 59. HPLC Flow Rates: Everything You Need to Know [https://axionlabs.com/chromatography-training/hplc-flow-rates-everything-you-need-to-know/]
- 60. Chromophore - an overview | ScienceDirect Topics [https://www.sciencedirect.com/topics/engineering/chromophore]
- 61. Comparison of ultraviolet and refractive index detections in ... [https://www.sciencedirect.com/science/article/abs/pii/S030881462101520X]
- 62. UV Detection for HPLC – Fundamental Principle, Practical ... [https://www.chromatographyonline.com/view/lcgc-blog-uv-detection-hplc-fundamental-principle-practical-implications]
- 63. Matrix Effects on Quantitation in Liquid Chromatography [https://www.chromatographyonline.com/view/matrix-effects-on-quantitation-in-liquid-chromatography-sources-and-solutions]
- 64. Three approaches to minimize matrix effects in residue ... [https://www.sciencedirect.com/science/article/abs/pii/S0308814618320776]
- 65. HPLC vs MS: Sensitivity and Selectivity Comparison [https://eureka.patsnap.com/report-hplc-vs-ms-sensitivity-and-selectivity-comparison]
- 66. A Review on Instrumentation and Validation Method of Uv ... [https://www.academia.edu/143227639/A_Review_on_Instrumentation_and_Validation_Method_of_Uv_Visible_Spectroscopy_and_HPLC_for_the_Analysis_of_Drugs]
- 67. Sensitivity of a UV coupled to an HPLC - Chromatography Forum [https://www.chromforum.org/viewtopic.php?t=8018]
- 68. Ultraviolet Detectors: Perspectives, Principles, and Practices | LCGC International [https://www.chromatographyonline.com/view/ultraviolet-detectors-perspectives-principles-and-practices]
- 69. Efficient HPLC-ELSD analysis of sodium and phosphate in ... [https://pubs.rsc.org/en/content/articlehtml/2025/ra/d5ra07182h]
- 70. HPLC 2025 Preview: Functionalized Monoliths as ... [https://www.chromatographyonline.com/view/functionalized-monoliths-as-selective-sample-preparation-materials]
- 71. Enhancing Analytical Potential for Ultratrace Analysis of ... [https://pmc.ncbi.nlm.nih.gov/articles/PMC11598274/]
- 72. Spandidos Publications: Experimental and Therapeutic Medicine [https://www.spandidos-publications.com/10.3892/etm.2019.7238]
- 73. Comparative application of derivative spectrophotometric and ... [https://fjps.springeropen.com/articles/10.1186/s43094-023-00471-7]
- 74. Comparison of UV spectrophotometry and high ... [https://pmc.ncbi.nlm.nih.gov/articles/PMC3658086/]
- 75. How UV-Vis is Evolving in 2025 for Better Lab Efficiency [https://www.richmondscientific.com/how-uv-vis-is-evolving-in-2025-for-better-lab-efficiency?srsltid=AfmBOorug_oYWCAoGRB4EtWCMm6dl_MUoc9CiWa-MsFqSoA5jCHafKwQ]
- 76. Comprehensive Guide to HPLC Systems: Cost, Suitability ... [https://arcscientific.com/scientific-equipment/hplc-systems/]
- 77. UV Spectroscopy Market Size & Share Analysis [https://www.mordorintelligence.com/industry-reports/uv-spectroscopy-market]
- 78. Chromatography Accessories Market Growth, Drivers, and ... [https://www.marketsandmarkets.com/Market-Reports/chromatography-accessories-consumables-market-1294.html]
- 79. Analytical Instrumentation Market Size & Share Analysis [https://www.mordorintelligence.com/industry-reports/analytical-instrumentation-market]
- 80. New HPLC, MS, and CDS Products from 2024–2025 [https://www.chromatographyonline.com/view/new-hplc-ms-and-cds-products-from-2024-2025-a-brief-review]
- 81. UV Spectrophotometry vs HPLC: Key Differences [https://www.linkedin.com/posts/satish-s-mane_uv-spectrophotometry-vs-hplc-1-principle-activity-7374455512681086976-wOHu]
- 82. HPLC Basics | Thermo Fisher Scientific - US [https://www.thermofisher.com/us/en/home/industrial/chromatography/chromatography-learning-center/liquid-chromatography-information/hplc-basics.html]
- 83. Chromatography Fundamentals, Part VIII: The Meaning ... [https://www.chromatographyonline.com/view/chromatography-fundamentals-part-viii-meaning-and-significance-chromatographic-resolution]
- 84. Overview of Methods and Considerations for Handling ... [https://www.chromatographyonline.com/view/overview-methods-and-considerations-handling-complex-samples]
- 85. HPLC Data Interpretation and Management [https://www.scispot.com/blog/hplc-data-interpretation-and-management-tools-techniques-and-compliance]
- 86. Where Do Interference Peaks in Liquid Chromatography ... [https://universallab.org/blog/where_do_interference_peaks_in_liquid_chromatography_come_from]
- 87. ICH Q2(R2) Validation of analytical procedures [https://www.ema.europa.eu/en/ich-q2r2-validation-analytical-procedures-scientific-guideline]
- 88. Comparative performance of liquid chromatography and ... [https://www.sciencedirect.com/science/article/pii/S2405844024085827]
- 89. In-Line UV-Vis Spectroscopy as a Fast-Working Process ... [https://pmc.ncbi.nlm.nih.gov/articles/PMC6321000/]
- 90. Comparison of the ability of UV-Vis and UPLC-Q-TOF-MS ... [https://www.sciencedirect.com/science/article/abs/pii/S0304389421021336]