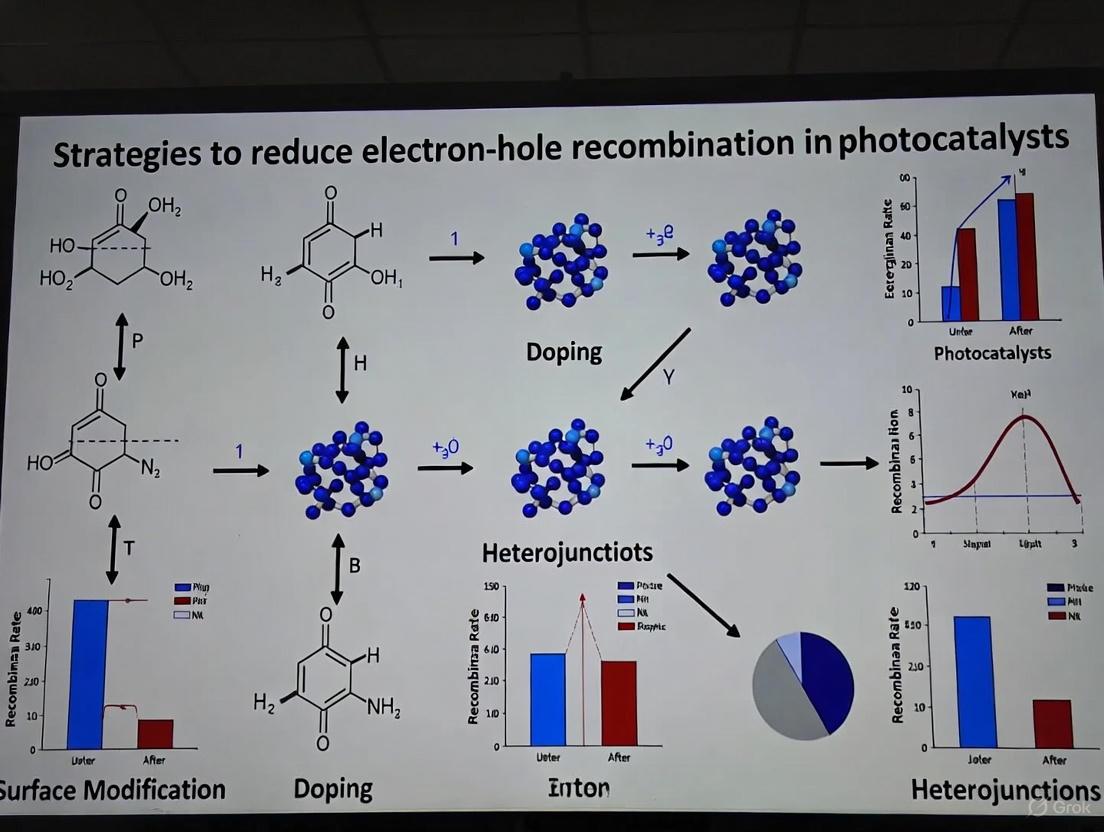
Advanced Strategies to Suppress Electron-Hole Recombination in Photocatalysts: From Mechanisms to Applications
Electron-hole recombination is a fundamental challenge that severely limits the efficiency of semiconductor photocatalysts.
Advanced Strategies to Suppress Electron-Hole Recombination in Photocatalysts: From Mechanisms to Applications
Abstract
Electron-hole recombination is a fundamental challenge that severely limits the efficiency of semiconductor photocatalysts. This article provides a comprehensive analysis of advanced strategies to suppress charge carrier recombination, a critical barrier in photocatalytic applications ranging from environmental remediation to energy conversion. We explore the foundational mechanisms of recombination, detail cutting-edge engineering methodologies like heterojunction construction and defect engineering, and discuss optimization techniques for real-world systems. The review also covers rigorous validation protocols and comparative performance analysis of emerging materials, offering researchers a structured framework to design high-performance, next-generation photocatalytic systems.
Understanding Electron-Hole Recombination: The Fundamental Bottleneck in Photocatalysis
Frequently Asked Questions (FAQs)
Q1: What are the primary fates of photogenerated electron-hole pairs in a semiconductor? When a semiconductor absorbs light with energy equal to or greater than its bandgap, electrons are excited from the valence band (VB) to the conduction band (CB), creating electron-hole (e--h+) pairs [1] [2]. These charge carriers have three main possible fates [2]:
- Productive Separation and Transfer: The electrons and holes migrate to the catalyst surface without recombining and initiate reduction and oxidation reactions, respectively [1].
- Recombination: The electrons fall back into the holes, annihilating the pair. This can occur radiatively (emitting light/heat) or non-radiatively within the bulk or on the surface of the material, and it is the primary cause of low photocatalytic efficiency [2].
- Trapping: Electrons or holes can be temporarily captured by surface states or defect sites, which can sometimes delay recombination and facilitate interfacial charge transfer [2].
Q2: What is the "ABC model" and how does it describe recombination?
The ABC model is a common framework used to quantify recombination rates in semiconductors, particularly in devices like LEDs. It expresses the total recombination rate (R) as a function of the carrier concentration (n), breaking it down into three main contributions [3]:
R = An + Bn² + Cn³
- A - Shockley-Read-Hall (SRH) Coefficient: Represents linear, non-radiative recombination at defect sites or traps.
- B - Radiative Coefficient: Represents bimolecular radiative recombination, which has a quadratic dependence on carrier concentration.
- C - Auger Coefficient: Represents three-body non-radiative Auger recombination, which becomes dominant at very high carrier concentrations [3]. Advanced versions of this model also include an
f(n)term to account for carrier leakage outside the active region [3].
Q3: What are common material defects that act as non-radiative recombination centers? Defects in the crystal structure, particularly at the surface, create energy levels within the bandgap that act as efficient traps for charge carriers, promoting non-radiative recombination. Common defects include [3] [4]:
- Oxygen Vacancies: Common in metal oxides; they can sometimes be beneficial by creating active sites, but often act as recombination centers.
- Surface Epoxide and Carboxylic Groups: In carbon-based dots, these groups can act as centers for non-radiative electron-hole recombination, lowering photoluminescence quantum yield [3].
- Impurity Ions: Ions from the solution or synthesis process, such as O and OH radical species, can form traps [3].
Q4: What experimental techniques can diagnose charge carrier recombination? Several photoelectrochemical and spectroscopic techniques are used to probe recombination:
- Transient Absorption Spectroscopy (TAS): Directly monitors the decay kinetics of photogenerated charge carriers, allowing researchers to measure their recombination lifetimes [2].
- Photoluminescence (PL) Spectroscopy: The intensity of photoluminescence is inversely related to the recombination rate. A strong PL signal often indicates high radiative recombination, while quenching of PL suggests the presence of non-radiative pathways or effective charge separation [3] [4].
- Electrochemical Impedance Spectroscopy (EIS): Provides information on charge transfer resistance at the semiconductor-electrolyte interface. A smaller semicircle in a Nyquist plot typically indicates lower resistance and more efficient charge separation [4].
- Mott-Schottky Analysis: Used to determine the flat-band potential and carrier density of a semiconductor, which are related to the space charge layer and its ability to separate electron-hole pairs.
Troubleshooting Guides
Poor Photocatalytic Efficiency Due to Rapid Recombination
Problem: Your photocatalyst shows poor activity for reactions like dye degradation or water splitting, primarily because photogenerated electrons and holes recombine too quickly.
Investigation & Solution Strategy:
| Investigation Step | Observation / Technique | Suggested Cause | Potential Solutions |
|---|---|---|---|
| Analyze Recombination Kinetics | Perform Transient Absorption Spectroscopy or PL Spectroscopy. Observe rapid decay of signal [2]. | High density of bulk or surface defects acting as recombination centers. | • Improve crystallinity: Use high-temperature annealing to repair defects. • Surface passivation: Use chemical agents to cap dangling bonds [3]. |
| Check Charge Separation | Perform EIS. Observe a large semicircle, indicating high charge transfer resistance [4]. | Poor separation and migration of charges to the surface. | • Construct a heterojunction: Couple with another semiconductor to create an internal electric field [5]. • Facet engineering: Utilize natural charge separation between different crystal facets [6]. • Apply a co-catalyst: Use Pt or CoFeOx as an electron sink to extract charges [5] [6]. |
| Evaluate Defect States | Perform X-ray Photoelectron Spectroscopy (XPS). Analyze the presence of impurity atoms or unusual oxidation states [4]. | Unintentional defects or impurities introduced during synthesis. | • Refine synthesis parameters: Optimize precursor concentration, pH, and temperature. • Introduce beneficial defects: Controlled creation of oxygen vacancies can sometimes improve activity [4]. |
Inconsistency Between Experimental Data and the ABC Model
Problem: The efficiency versus carrier concentration curve of your device (e.g., an LED) is heavily skewed and does not match the symmetric curve predicted by the standard ABC model.
Investigation & Solution Strategy:
- Potential Cause: The standard ABC model only considers recombination inside the active region and may fail to account for carrier leakage or injection inefficiencies [3].
- Solution: Employ an extended ABC + f(n) model. The
f(n)term describes carriers that recombine outside the active region and can be expressed as a power series (e.g.,f(n) = an + bn² + cn³ + ...). Using this model with higher-order terms can more accurately explain the skewed experimental efficiency curves observed in real devices [3].
Quantitative Data on Recombination and Performance
Table 1: Common Recombination Pathways and Their Characteristics
| Recombination Type | Rate Dependence | Primary Cause | Typical Impact on Efficiency |
|---|---|---|---|
| Shockley-Read-Hall (SRH) | Linear (An) [3] | Defects, impurities | Dominant at low carrier densities; significantly reduces low-current efficiency [3]. |
| Radiative | Quadratic (Bn²) [3] | Intrinsic band-to-band recombination | Fundamental limit; dominant in high-quality materials at intermediate currents [3]. |
| Auger | Cubic (Cn³) [3] | Three-particle collision | Dominant at very high carrier densities; causes efficiency droop at high currents [3]. |
| Carrier Leakage | Polynomial (f(n)) [3] | Injection inefficiency, overflow | Becomes significant at high currents; explained by extended ABC+f(n) model [3]. |
Table 2: Performance Improvement via Specific Strategies (Experimental Examples)
| Photocatalyst System | Strategy Employed | Key Metric & Improvement | Reference Context |
|---|---|---|---|
| Laâ‚‚TiOâ‚…-400 (Reduced) | Defect density modulation (Oxygen vacancies) [4] | Nâ‚‚ fixation yield: 158.13 μmol·gâ»Â¹Â·hâ»Â¹ [4] | [4] |
| BiVOâ‚„:Mo(NaOH)/CoFeOx | Electron Transfer Layer & Inter-facet junction [6] | Charge Separation Efficiency: >90% at 420 nm [6] | [6] |
| Ag/TiOâ‚‚/CNT | Co-catalyst & Carbon-based support [1] | Stability: Enhanced activity over 5 consecutive cycles [1] | [1] |
Experimental Protocols for Key Characterization Techniques
Protocol: Photoluminescence (PL) Spectroscopy for Recombination Assessment
Objective: To evaluate the relative rate of charge carrier recombination and assess the effectiveness of passivation or modification strategies.
Materials:
- Spectrofluorometer
- Solid sample holder or quartz cuvette (for powders or dispersions)
- Your photocatalyst powder or film
- Reference sample (e.g., unmodified catalyst for comparison)
Method:
- Sample Preparation: For powder samples, ensure a uniform thin layer in the solid holder. For dispersions, prepare a stable, sonicated colloidal solution in a quartz cuvette.
- Instrument Setup: Set the excitation wavelength to an energy above the bandgap of your material (e.g., 300-400 nm for TiOâ‚‚ or ZnO). Choose an appropriate excitation and emission slit width to achieve a strong signal without saturation.
- Measurement:
- Run an excitation-emission scan to find the optimal wavelengths, or
- Set a fixed excitation wavelength and acquire the emission spectrum.
- Perform the same measurement on your modified and unmodified samples under identical conditions.
- Data Analysis:
- Compare the peak intensity and peak shape. A significant quenching of the PL intensity in the modified sample indicates a reduction in radiative recombination, often due to improved charge separation or the introduction of non-radiative pathways that outcompete recombination [3] [4].
- Analyze the peak shift, which can provide information on changes in surface states or band structure.
Protocol: Probing Reactive Oxygen Species (ROS) for Mechanistic Insight
Objective: To identify and confirm the primary reactive species involved in the photocatalytic degradation process, which indirectly informs on the success of charge separation.
Materials:
- Photoreactor with light source
- Scavengers: Isopropanol (for â—OH), p-benzoquinone (for â—Oâ‚‚â»), EDTA-2Na (for hâº), etc.
- Target pollutant (e.g., Methylene Blue solution)
- Your photocatalyst
Method:
- Baseline Reaction: Conduct a standard photocatalytic degradation experiment with your catalyst and the pollutant solution without any scavenger. Monitor the degradation rate (e.g., via UV-Vis spectroscopy).
- Scavenging Experiments: Repeat the baseline experiment, but in each run, add a small, controlled amount (e.g., 1 mM) of a specific scavenger to the reaction mixture.
- Data Analysis:
- Compare the degradation rates of all experiments.
- A significant decrease in the degradation rate in the presence of a particular scavenger indicates that the corresponding reactive species (e.g., â—OH, â—Oâ‚‚â», hâº) plays a crucial role in the mechanism [1].
- This confirms that the photogenerated charges are successfully separated and transferred to surface reactants to form ROS.
Visualization of Processes and Strategies
Photocatalytic Process and Recombination Pathways
Diagram Title: Photocatalytic charge generation and fate pathways.
Advanced Strategy: Intensified Inter-Facet Charge Separation
Diagram Title: ETL and inter-facet junction enhance charge separation.
The Scientist's Toolkit: Key Research Reagent Solutions
Table 3: Essential Reagents and Materials for Photocatalyst Development
| Reagent / Material | Function / Application | Key Consideration |
|---|---|---|
| Sodium Hydroxide (NaOH) | Surface Etching & Defect Creation: Selectively dissolves atoms (e.g., V in BiVOâ‚„) to create oxygen vacancies and incorporate modifiers (Na) [4] [6]. | Concentration, temperature, and etching time must be optimized to avoid structural collapse. |
| Polyethylene Glycol (PEG) | Surface Passivation Agent: Binds to surface dangling bonds, reducing non-radiative recombination pathways and increasing photoluminescence quantum yield [3]. | Molecular weight and functional end groups influence passivation effectiveness. |
| Platinum (Pt) Precursors | Co-catalyst / Electron Sink: Deposited as nanoparticles to form a Schottky barrier, effectively trapping electrons and suppressing eâ»-h⺠recombination [5] [2]. | Loading amount and dispersion are critical; high loadings can block active sites. |
| Scavenger Compounds | Mechanistic Probes: Used in trapping experiments to identify the primary reactive species (e.g., Isopropanol for â—OH, p-Benzoquinone for â—Oâ‚‚â») [1]. | Must be used at appropriate concentrations to ensure specificity for the target species. |
| Cobalt-Iron (CoFeOx) Precursors | Oxidation Co-catalyst: Specifically extracts and utilizes photogenerated holes for oxidation reactions, enhancing spatial charge separation [6]. | Synergistic effect between Co and Fe improves Oâ‚‚ evolution activity. |
| Reducing Agents (NaBHâ‚„, etc.) | Defect Engineering: Used in post-synthetic reduction treatments to create oxygen vacancies, modulating defect density and electronic structure [4]. | Reduction temperature and atmosphere are key parameters controlling vacancy concentration. |
| 3PO | 3PO, CAS:13309-08-5, MF:C13H10N2O, MW:210.23 g/mol | Chemical Reagent |
| 1233B | 1233B, MF:C18H30O6, MW:342.4 g/mol | Chemical Reagent |
Intrinsic vs. Extrinsic Recombination Pathways
FAQ: Understanding Recombination in Photocatalysts
What are electron-hole pairs and why is their recombination a problem? When a photocatalyst absorbs light with energy equal to or greater than its band gap, electrons ((e^-)) are excited from the valence band (VB) to the conduction band (CB), leaving positively charged holes ((h^+)) in the VB. These are called electron-hole pairs, and they are the primary drivers of photocatalytic reactions [7] [8]. Recombination is the process where these photo-generated electrons and holes annihilate each other before they can participate in surface redox reactions [9]. This process wastes the absorbed light energy, typically converting it to heat or light, and significantly reduces the efficiency of photocatalytic processes such as pollutant degradation or hydrogen production [10] [7].
What is the fundamental difference between intrinsic and extrinsic recombination? The fundamental difference lies in their origin. Intrinsic recombination is an inherent property of the pure semiconductor material and cannot be completely eliminated. Extrinsic recombination is caused by defects or impurities in the crystal structure, which introduce trapping sites for charge carriers [9]. Therefore, strategies to mitigate intrinsic recombination focus on material design to alter the fundamental path of the charges, while strategies to reduce extrinsic recombination focus on improving material synthesis and processing to minimize defects.
How can I quickly diagnose if recombination is the main issue in my photocatalytic system? A significant indicator of severe recombination is low photocatalytic activity despite confirmed strong light absorption by your material. Advanced characterizations can provide definitive evidence:
- Photoluminescence (PL) Spectroscopy: A high-intensity PL signal often indicates efficient radiative recombination of electrons and holes. A decrease in PL intensity after modifying a catalyst suggests suppressed recombination [11].
- Electrochemical Impedance Spectroscopy (EIS): A smaller arc radius in a Nyquist plot typically signifies lower charge transfer resistance and more efficient separation of photo-generated charges, implying reduced recombination [11].
Troubleshooting Guide: Identifying and Mitigating Recombination
This guide helps diagnose the dominant recombination type in your experiments and provides targeted solutions.
Table 1: Troubleshooting Recombination Pathways
| Observed Problem | Likely Primary Cause | Recommended Solution | Experimental Protocol to Verify |
|---|---|---|---|
| Low efficiency despite high light absorption; performance is independent of defect engineering. | Intrinsic Recombination (Radiative or Auger) [9] | Create heterojunctions (e.g., Z-scheme) to spatially separate electrons and holes [11] [8]. | Perform PL spectroscopy: Compare intensity of pristine and composite catalyst. A significant decrease in composite confirms suppressed recombination [11]. |
| Performance degrades with increased crystallinity or is highly sensitive to synthesis temperature/conditions. | Extrinsic Recombination (Shockley-Read-Hall) via defects [9] | Optimize synthesis to reduce crystal defects; use surface passivation; control doping levels to avoid introducing trap states [9] [8]. | Conduct EIS measurements: A smaller arc radius in the composite versus the pristine material indicates improved charge separation and reduced trapping [11]. |
| Rapid performance loss under prolonged illumination (photocorrosion). | Extrinsic Recombination activated by surface defects acting as recombination centers. | Use co-catalysts or form protective layers (e.g., oxide shells) to stabilize surface sites [8]. | Test photostability over multiple cycles (e.g., 3-5 cycles). Stable performance suggests mitigated surface degradation [11] [8]. |
| Poor performance under high-intensity light or in highly doped materials. | Auger Recombination (an intrinsic process) [9] | Modify the light intensity or adjust the dopant concentration to levels where Auger recombination is not the dominant loss mechanism [9]. | Model recombination rates using established parameterisations for Auger coefficients to identify critical injection/doping levels [9]. |
Experimental Protocols for Recombination Analysis
Protocol 1: Probing Reduction via Photoluminescence (PL) Spectroscopy
This protocol is based on the characterization of ZIF-11/g-C3N4 composites [11].
- Sample Preparation: Dilute your photocatalyst powder in a non-absorbing solvent (e.g., ethanol) to form a slurry. Deposit the slurry onto a substrate and dry to form a thin, uniform film for analysis.
- Measurement: Use a PL spectrometer with a fixed excitation wavelength. Scan the emission wavelengths to obtain the PL spectrum.
- Analysis: Compare the PL intensity of your modified photocatalyst (e.g., a composite or doped sample) with the pristine material. A lower PL intensity in the modified sample indicates a reduction in the radiative recombination of charge carriers, confirming the success of your strategy [11].
Protocol 2: Validating Charge Separation with Electrochemical Impedance Spectroscopy (EIS)
This protocol is adapted from the evaluation of the ZIF-11/g-C3N4 nanostructure [11].
- Electrode Preparation: Fabricate a working electrode by drop-casting a dispersion of your photocatalyst material onto a conductive substrate (e.g., FTO glass).
- Measurement Setup: Use a standard three-electrode electrochemical cell (working electrode, platinum counter electrode, and reference electrode) filled with an electrolyte solution (e.g., 0.1 M Naâ‚‚SOâ‚„). The measurement is often conducted under light illumination.
- Data Acquisition: Measure the impedance over a frequency range (e.g., from 100,000 Hz to 0.1 Hz) at the open-circuit potential.
- Analysis: Plot the data on a Nyquist plot ( -Z'' vs. Z'). A smaller semicircle (arc radius) for your modified photocatalyst compared to the pristine material indicates a lower charge transfer resistance, demonstrating more efficient charge separation and reduced recombination [11].
Signaling Pathways and Workflows
The following diagram illustrates the competitive pathways that photo-generated charge carriers can take, leading to either productive reactions or energy-wasting recombination.
Charge Carrier Pathways in Photocatalysis
This workflow outlines the key experimental steps for diagnosing recombination issues and validating mitigation strategies.
Recombination Diagnosis Workflow
The Scientist's Toolkit: Research Reagent Solutions
Table 2: Essential Materials for Photocatalyst Synthesis and Modification
| Material / Reagent | Function in Recombination Mitigation | Example from Literature |
|---|---|---|
| Urea | A common, low-cost precursor for the thermal synthesis of graphitic carbon nitride (g-C₃N₄), a metal-free polymer semiconductor used to form heterojunctions [11]. | Used to synthesize g-C₃N₄ for the Z-scheme ZIF-11/g-C₃N₄ composite, which demonstrated reduced electron/hole recombination [11]. |
| Zinc Acetate Dihydrate | A metal source for the synthesis of zinc-based frameworks and semiconductors like Zeolitic Imidazolate Frameworks (ZIFs) and ZnO [11]. | Served as the zinc source for synthesizing ZIF-11 in the ZIF-11/g-C₃N₄ composite [11]. |
| Benzimidazole | An organic linker molecule used in the construction of ZIFs. It coordinates with metal ions to form porous crystalline structures with high surface areas [11]. | Used as the imidazolate linker to form the ZIF-11 structure in the composite photocatalyst [11]. |
| Precursor for Dopants (e.g., Metal Salts) | Introducing controlled impurities (doping) to create p-type or n-type semiconductors. This can create internal fields that help separate charges and reduce recombination [8]. | Doping with foreign elements is a common strategy to introduce point defects that alter electronic properties and suppress recombination [8]. |
| 3-AQC | 3-AQC Reagent | |
| AG311 | AG311|Complex I Inhibitor|HIF-1α Stabilization Blocker | AG311 is a small molecule inhibitor of mitochondrial complex I and hypoxia-induced HIF-1α stabilization. For research use only. Not for human consumption. |
Impact of Recombination on Photocatalytic Efficiency and Quantum Yield
Troubleshooting Guides and FAQs
Frequently Asked Questions
Q1: What is the fundamental reason that electron-hole recombination limits photocatalytic efficiency? Recombination is a primary energy loss pathway. When photogenerated electrons and holes recombine, often on picosecond to nanosecond timescales, the absorbed light energy is converted to heat or emitted as light instead of driving the desired surface redox reactions. This drastically reduces the number of available charge carriers, lowering the overall quantum yield and photocatalytic performance [12].
Q2: My photocatalyst absorbs visible light well but shows very low activity. Could recombination be the issue? Yes, this is a common symptom. A narrow bandgap material absorbs visible light well, generating abundant charge carriers. However, these materials often suffer from rapid charge recombination and may have insufficient redox potential. Strategies like constructing heterojunctions can help separate charges and improve efficiency despite the narrow bandgap [12].
Q3: What is "cage escape" and why is it critical for quantum yield? Cage escape is the process where the primary quenching products—the reduced photocatalyst and the oxidized donor—diffuse away from the solvent cage they are embedded in after photoinduced electron transfer. Successful cage escape prevents a spontaneous, unproductive thermal reverse electron transfer within the cage. The cage escape quantum yield (ФCE) directly governs the number of charge carriers available for onward reaction and is a decisive factor in determining the overall reaction rate and quantum yield [13].
Q4: I am using a noble metal-modified photocatalyst. How does this help reduce recombination? Loading noble metals (e.g., Pt) on a photocatalyst surface creates a Schottky barrier at the metal-semiconductor interface. This junction acts as an efficient electron trap, capturing photogenerated electrons from the semiconductor. This spatial separation significantly delays the recombination of electrons and holes, increasing their lifetime and the probability they will participate in surface reactions [5].
Q5: How can I experimentally confirm that my material modification has successfully reduced charge recombination? Several characterization techniques can provide evidence:
- Photoluminescence (PL) Spectroscopy: A decrease in PL intensity indicates a lower rate of radiative electron-hole recombination.
- Electrochemical Impedance Spectroscopy (EIS): A smaller arc radius in the Nyquist plot suggests lower charge transfer resistance and more efficient charge separation.
- Transient Absorption Spectroscopy: Allows direct tracking of charge carrier lifetimes. For example, one study confirmed reduced recombination in a ZIF-11/g-C3N4 composite using both PL and EIS analyses [11].
Troubleshooting Common Experimental Problems
Problem: Low quantum yield despite using an efficient photocatalyst system.
- Potential Cause: Low cage escape yield. The photocatalyst itself may govern the achievable magnitude of ФCE by dictating the rate of unwanted charge recombination within the solvent cage [13].
- Solution: Consider switching the photocatalyst. For instance, a study found that the cage escape quantum yields (ФCE) for a [Ru(bpz)3]2+-based system were substantially higher than for a [Cr(dqp)2]3+-based system across a range of electron donors, leading to better performance [13].
Problem: Poor photocatalytic performance in a composite photocatalyst.
- Potential Cause: Incorrect charge transfer mechanism (e.g., Type-II heterojunction) which may still involve some Coulombic attraction between separated charges, leading to potential recombination.
- Solution: Design a direct Z-scheme or S-scheme heterojunction. These mechanisms not only achieve spatial charge separation but also preserve the strongest redox abilities of the system, often leading to higher activity. The Z-scheme in a ZIF-11/g-C3N4 composite effectively reduced recombination, as confirmed by characterization [11].
Problem: Rapid deactivation of the photocatalyst over multiple cycles.
- Potential Cause: Structural instability or the recombination centers acting as degradation sites over time.
- Solution: Focus on creating stable defect structures. For example, a defect-engineered La2TiO5 catalyst (LTO-400) demonstrated good cycle stability alongside its high nitrogen fixation rate, indicating that the introduced defects were stable and did not promote deactivation [4].
Quantitative Data on Recombination Reduction Strategies
The following table summarizes quantitative data from recent studies on different strategies to suppress electron-hole recombination.
Table 1: Performance Comparison of Recombination Suppression Strategies
| Strategy | Photocatalyst System | Key Performance Metric | Reported Improvement / Outcome | Reference |
|---|---|---|---|---|
| Defect Engineering | Laâ‚‚TiOâ‚… with oxygen vacancies (LTO-400) | Nitrogen Fixation Rate | 158.13 μmol·gâ»Â¹Â·hâ»Â¹; Defects inhibited charge recombination and improved visible light absorption. [4] | [4] |
| Z-Scheme Heterojunction | ZIF-11/g-C₃N₄ | Methylene Blue Degradation | 72.7% degradation in 60 min; PL and EIS confirmed reduced electron/hole recombination. [11] | [11] |
| Cage Escape Engineering | [Ru(bpz)₃]²⺠with TAA-OMe donor | Cage Escape Quantum Yield (ФCE) | ФCE = 58%; A higher ФCE directly correlated with faster product formation rates in benchmark reactions. [13] | [13] |
| S-Scheme Heterojunction | (Concept from review) | Overall System Capability | Resolves trade-off between light absorption & redox potential; enables both broad absorption and strong redox power for high STH efficiency. [12] | [12] |
Experimental Protocols for Key Techniques
Protocol 1: Constructing a Z-Scheme Heterojunction Photocatalyst
This protocol is adapted from the synthesis of ZIF-11/g-C₃N₄ nanocomposites [11].
Objective: To fabricate a Z-scheme heterojunction that minimizes electron-hole recombination while preserving strong redox ability.
Materials:
- Precursors: Zinc acetate dihydrate (Câ‚„Hâ‚â‚€O₆Zn·2Hâ‚‚O), Benzimidazole (C₇H₆Nâ‚‚), Urea (CHâ‚„Nâ‚‚O).
- Solvents: Methanol (CH₃OH), Toluene (C₆H₅CH₃).
- Other Chemicals: Ammonium hydroxide (NHâ‚„OH).
Procedure:
- Synthesis of g-C₃N₄: Place 16 g of urea in a covered alumina crucible. Heat in a muffle furnace to 550 °C at a ramp rate of 2 °C/min and hold for 4 hours. After cooling to room temperature, collect the resulting light-yellow g-C₃N₄ powder.
- Preparation of Solution A: Disperse a specific amount (e.g., 0.3 g) of the synthesized g-C₃N₄ in 6.1 mL of methanol. Stir for 150 minutes to achieve a homogeneous dispersion.
- Preparation of Solution B: In a separate container, dissolve 0.12 g of benzimidazole in a mixture of 6.1 mL methanol, 5.3 mL toluene, and 0.8 mL ammonia. Subsequently, add 0.11 g of zinc acetate to this solution and stir until dissolved.
- Combination and Reaction: Slowly add Solution A to Solution B under continuous stirring. Allow the reaction to proceed at room temperature for 3 hours with constant stirring.
- Product Isolation: Separate the solid product by filtration or centrifugation. Wash the solid three times with methanol to remove any residual toluene or unreacted precursors.
- Drying: Dry the final product (ZIF-11/g-C₃N₄) at room temperature for 3 hours.
Characterization to Verify Reduced Recombination:
- Use Photoluminescence (PL) Spectroscopy. A significant decrease in the PL emission intensity of the composite compared to pure g-C₃N₄ indicates suppressed radiative recombination.
- Perform Electrochemical Impedance Spectroscopy (EIS). A smaller arc radius in the Nyquist plot for the composite suggests lower charge transfer resistance and more efficient charge separation [11].
Protocol 2: Introducing Oxygen Vacancies via Thermal Reduction
This protocol is based on the defect density modulation of Laâ‚‚TiOâ‚… (LTO) [4].
Objective: To create oxygen vacancies in a metal oxide photocatalyst, which can act as electron traps and active sites, thereby reducing bulk recombination.
Materials:
- Precursor: Pre-synthesized Laâ‚‚TiOâ‚… (LTO) nanoparticles (e.g., synthesized via a sol-gel method).
- Equipment: Tube furnace, controlled atmosphere gas supply (e.g., 5% Hâ‚‚/Ar mixture or vacuum).
Procedure:
- Preparation: Place the as-synthesized LTO powder in a ceramic boat.
- Reduction Process: Insert the boat into a tube furnace. Flush the tube with an inert gas (e.g., Argon) to remove air.
- Thermal Treatment: Heat the furnace to a controlled reduction temperature (e.g., 400 °C) under a reducing atmosphere (e.g., a flow of 5% H₂/Ar mixture). Maintain the temperature for a set duration (e.g., 1-2 hours).
- Cooling: After the reduction time, allow the furnace to cool to room temperature under the same gas flow. The resulting sample can be labeled as R-LTO (e.g., LTO-400 for reduction at 400°C).
Characterization of Defects:
- X-ray Photoelectron Spectroscopy (XPS): Analyze the O 1s spectrum. A shoulder or peak at a lower binding energy can confirm the presence of oxygen vacancies [4].
- UV-Vis Diffuse Reflectance Spectroscopy (DRS): Measure the absorption spectrum. An enhanced absorption tail extending into the visible region (red-shift) indicates the successful introduction of defect levels within the bandgap [4].
Visualization of Mechanisms and Workflows
Z-Scheme Charge Transfer Mechanism
Diagram Title: Z-Scheme charge transfer and internal recombination
Cage Escape and Recombination Pathways
Diagram Title: Cage escape versus recombination in photoredox catalysis
Experimental Workflow for Photocatalyst Synthesis
Diagram Title: Photocatalyst development and characterization workflow
The Scientist's Toolkit: Key Research Reagent Solutions
Table 2: Essential Materials and Their Functions in Recombination Studies
| Reagent / Material | Function / Application | Key Characteristics & Purpose |
|---|---|---|
| g-C₃N₄ (Graphitic Carbon Nitride) | Metal-free semiconductor; base component in Z-scheme heterojunctions. | Visible light response, suitable band gap, high chemical stability. Provides a platform for constructing composites that suppress recombination. [11] |
| ZIF-11 (Zeolitic Imidazolate Framework-11) | MOF-based semiconductor; paired with g-C₃N₄ to form a heterojunction. | High surface area, unique porous structure. Acts as the second component in a Z-scheme system to facilitate directional charge transfer. [11] |
| Laâ‚‚TiOâ‚… (LTO) Precursors | Perovskite oxide photocatalyst for defect engineering studies. | Typical perovskite structure, wide bandgap. Serves as a model material for introducing oxygen vacancies to trap electrons and reduce recombination. [4] |
| [Ru(bpz)₃]²⺠Complex | Molecular photocatalyst for fundamental cage escape studies. | High cage escape quantum yield (ФCE). Used as a benchmark to study and quantify the role of cage escape in minimizing geminate recombination. [13] |
| Triarylamine (TAA) Donors | Electron donors in photoredox catalysis quenching experiments. | Reversible electron transfer. Used to quantitatively measure cage escape yields and study the parameters affecting charge separation efficiency. [13] |
| Aphos | Aphos, CAS:74548-80-4, MF:C16H14Cl3O5P, MW:423.6 g/mol | Chemical Reagent |
| AT-61 | AT-61, CAS:300669-68-5, MF:C21H21ClN2O2, MW:368.9 g/mol | Chemical Reagent |
In photocatalyst research, the rapid recombination of photogenerated electron-hole pairs is a primary factor limiting efficiency. Advanced characterization techniques are critical for directly observing and quantifying these recombination dynamics to develop effective suppression strategies. This guide details the application of Photoluminescence (PL), Time-Resolved Photoluminescence (TRPL), and Electrochemical Impedance Spectroscopy (EIS) for troubleshooting recombination issues, providing researchers with practical methodologies to diagnose loss mechanisms and validate material optimizations.
Frequently Asked Questions (FAQs)
Q1: How can I quickly determine if my new photocatalyst material has a high electron-hole recombination rate?
A1: A preliminary steady-state PL spectrum is the most direct tool for an initial assessment. A high-intensity PL peak typically indicates strong radiative recombination, which, while easy to measure, often competes with non-radiative pathways. In many photocatalyst systems, the goal is to minimize overall PL intensity, as this suggests that non-radiative pathways (like charge separation and transport) are being favored over direct band-to-band recombination. For example, in the development of a ZIF-11/g-C3N4 Z-scheme heterostructure, a significant reduction in PL intensity was a key indicator of suppressed charge recombination [11].
Q2: My steady-state PL shows low intensity, suggesting low recombination. Why is my photocatalytic performance still poor?
A2: Low PL intensity can be misleading. It can indicate either successful charge separation or the presence of numerous defects or traps that quench luminescence through fast, non-radiative pathways. To distinguish between these scenarios, you need Time-Resolved Photoluminescence (TRPL). TRPL measures the photoluminescence decay lifetime after pulsed excitation. A short lifetime, even with low PL intensity, points to defect-dominated non-radiative recombination, which is detrimental to performance. A longer lifetime is generally indicative of high material quality and more efficient charge carrier utilization [14].
Q3: What does a multi-exponential decay curve in my TRPL data mean, and how should I interpret it?
A3: A multi-exponential decay is common in complex materials and reveals the presence of multiple, concurrent recombination pathways. When fitting your decay curve with multiple lifetimes (e.g., Ï„1, Ï„2, Ï„3), each component can be attributed to a specific process:
- Ï„1 (Fast component): Often related to non-radiative recombination at surface or bulk defects.
- Ï„2 (Medium component): Can be associated with trap-assisted recombination.
- Ï„3 (Slow component): Typically attributed to radiative band-to-band recombination.
The amplitude-weighted average lifetime can provide a single metric for comparing different samples. The presence of a strong slow component after a material modification (e.g., passivation or heterojunction formation) is a positive sign of suppressed non-radiative recombination [14].
Q4: How does EIS complement the information I get from PL and TRPL?
A4: While PL and TRPL directly probe the recombination kinetics of photoexcited charges, EIS investigates the charge transfer resistance and conductivity within the material or at its interface. PL/TRPL tells you about the fate of electrons and holes, whereas EIS reveals how easily the separated charges can move. A smaller semicircle in a Nyquist plot under illumination indicates a lower charge transfer resistance, which is often a consequence of reduced recombination and more efficient charge separation, as demonstrated in Z-scheme heterostructures [11].
Troubleshooting Guides
Guide: Diagnosing Electron-Hole Recombination with Steady-State PL
Problem: Unclear how to interpret steady-state PL spectra to identify recombination types.
Solution: Follow this diagnostic workflow to correlate spectral features with material properties.
Guide: Resolving Common TRPL Experimental Challenges
Problem: Poor signal-to-noise ratio, instrument response function (IRF) broadening, or difficulty interpreting decay curves.
Solution: Address these common issues with the following corrective actions.
| Challenge | Root Cause | Corrective Action & Solution |
|---|---|---|
| Low Signal-to-Noise Ratio | Weak luminescence, low photon count, or detector inefficiency. | Increase laser power (avoiding sample damage), use a higher repetition rate, employ a detector with higher quantum efficiency (e.g., SNSPD), and extend data acquisition time. |
| Broadened IRF | High timing jitter from laser, detector, or electronics [14]. | Use a picosecond or femtosecond pulsed laser; ensure detectors (e.g., SPAD) and timing electronics (e.g., Time Tagger with <2 ps jitter) are optimized for low jitter [14]. |
| Multi-Exponential Decay Fitting Issues | Overfitting, incorrect model selection. | Validate the need for a multi-exponential fit by comparing the quality of fit (χ²) for different models. Correlate lifetime components with physical processes based on sample treatment. |
Guide: Integrating PL, TRPL, and EIS for a Comprehensive View
Problem: Isolated data from one technique provides an incomplete picture of recombination and charge transfer.
Solution: Strategically combine all three techniques to dissect the photocatalyst's workflow.
Experimental Protocols
Detailed Protocol: Time-Resolved Photoluminescence (TRPL) Measurement
Objective: To measure the time decay of photoluminescence and extract carrier recombination lifetimes.
Materials and Setup:
- Pulsed Laser: Picosecond or femtosecond laser source (e.g., Ti:Sapphire). Wavelength selected based on material bandgap [14] [15].
- Detection System: Single-photon avalanche diode (SPAD) or photomultiplier tube (PMT).
- Timing Electronics: Time-correlated single photon counting (TCSPC) module or a high-resolution time tagger (e.g., with picosecond jitter) [14].
- Optics: Beam splitter (to generate trigger), focusing lenses, collection objective, and spectral filters (to isolate emission from laser scatter).
Step-by-Step Procedure:
- Alignment: Align the laser beam to focus on the sample. Ensure the collection path is optimized to gather the maximum emitted light onto the detector.
- Spectral Filtering: Place a long-pass or band-pass filter in the collection path to completely block the scattered laser light while transmitting the photoluminescence.
- Trigger Setup: Use a fast photodiode or the laser's sync output to generate a "start" trigger signal for each laser pulse.
- Photon Counting: For each detected photon ("stop" signal), the timing electronics record the time difference between the "start" and "stop" [14]. Ensure the count rate is kept below 1-5% of the laser repetition rate to avoid pulse pile-up distortion.
- Data Acquisition: Accumulate photons over several minutes to build a histogram of arrival times, which represents the PL decay curve.
- Lifetime Fitting: Fit the decay curve with appropriate exponential models (e.g., single, bi-exponential) using software, extracting the lifetime components (Ï„) and their amplitudes (A).
- Equation: ( I(t) = \sum Ai \cdot \exp(-t/\taui) )
- The average lifetime can be calculated as ( \langle \tau \rangle = \frac{\sum Ai \taui^2}{\sum Ai \taui} ).
Detailed Protocol: Electrochemical Impedance Spectroscopy (EIS) for Photocatalysts
Objective: To characterize the charge transfer resistance and semiconductor properties of the photocatalyst.
Materials and Setup:
- Potentiostat/Galvanostat with EIS capability.
- Three-Electrode Electrochemical Cell:
- Working Electrode: Photocatalyst material deposited on a conductive substrate (e.g., FTO, ITO).
- Counter Electrode: Platinum wire or mesh.
- Reference Electrode: Ag/AgCl or Saturated Calomel Electrode (SCE).
- Electrolyte: Aqueous solution (e.g., 0.5 M Naâ‚‚SOâ‚„) or other relevant supporting electrolyte.
- Light Source: LED or laser matching the catalyst's absorption profile.
Step-by-Step Procedure:
- Electrode Preparation: Disperse the photocatalyst powder in a solvent with a binder (e.g., Nafion) and drop-cast onto the conductive substrate. Dry thoroughly.
- Cell Assembly: Immerse the three electrodes in the electrolyte, ensuring no air bubbles are trapped.
- Setup Parameters:
- Set the DC bias potential, often the open circuit potential (OCP).
- Set the AC voltage amplitude (typically 5-10 mV RMS).
- Define the frequency range (e.g., from 100 kHz to 0.1 Hz).
- Measurement:
- First, measure the impedance in the dark.
- Then, illuminate the working electrode with the light source and measure the impedance under steady-state illumination.
- Data Analysis:
- Plot the data as Nyquist plots (-Z'' vs Z').
- Fit the data to an equivalent circuit model (e.g., a modified Randles circuit with a constant phase element). The key parameter is the charge transfer resistance (Râ‚â‚œ), which should decrease under illumination for a good photocatalyst [11].
Research Reagent Solutions & Essential Materials
Table: Key materials for characterizing recombination dynamics in photocatalyst systems.
| Material / Reagent | Function / Role in Characterization | Example from Literature |
|---|---|---|
| Pulsed Laser System (e.g., Ti:Sapphire) | Provides ultrafast excitation pulses for TRPL; wavelength tunability is key for probing different materials [14] [15]. | Used in trARPES and TRPL for pump-probe experiments with femtosecond resolution [15]. |
| Single-Photon Avalanche Diode (SPAD) | High-sensitivity detector for time-resolved single-photon counting in TRPL; offers low jitter [14]. | Critical for high-time-resolution TRPL setups to minimize instrument response function [14]. |
| Graphitic Carbon Nitride (g-C₃N₄) | A metal-free polymer semiconductor used as a base photocatalyst or component in Z-scheme heterostructures [11]. | Combined with ZIF-11 to form a Z-scheme heterojunction, reducing recombination as confirmed by PL and EIS [11]. |
| Zeolitic Imidazolate Frameworks (ZIFs) | Provides a porous crystalline structure to form composite heterostructures, facilitating charge separation [11]. | ZIF-11 was composited with g-C₃N₄, leading to a Z-scheme system with reduced electron-hole recombination [11]. |
| Supporting Electrolyte (e.g., Naâ‚‚SOâ‚„) | Provides ionic conductivity in an electrochemical cell for EIS measurements, without participating in reactions. | Used in standard three-electrode setups to measure the charge transfer resistance of photocatalysts. |
Engineering Solutions: Proven Strategies to Minimize Charge Recombination
Frequently Asked Questions (FAQs)
Q1: What is the primary function of a heterojunction in photocatalysis? A1: The primary function is to enhance the spatial separation of photogenerated electron-hole pairs, thereby suppressing their recombination and increasing the efficiency of photocatalytic reactions. This is achieved by creating an interface between two semiconductors with different electronic structures, which facilitates the directional movement of charge carriers across the interface [16] [17].
Q2: Why are conventional Type-I and Type-II heterojunctions sometimes insufficient? A2: While conventional heterojunctions improve charge separation, they often do so at the expense of redox potential. In a typical Type-II system, electrons accumulate on the semiconductor with the lower conduction band (less negative potential), and holes accumulate on the semiconductor with the lower valence band (less positive potential). This spatial separation reduces recombination but also weakens the reducing power of the electrons and the oxidizing power of the holes, impairing the driving force for demanding reactions like water splitting and CO2 reduction [16].
Q3: How do S-scheme heterojunctions overcome the limitations of Type-II systems? A3: S-scheme heterojunctions are designed to simultaneously achieve efficient charge separation and preserve strong redox potentials. In an S-scheme system, useless electrons and holes recombine at the interface, while the most useful electrons (those with the highest reduction potential) remain in one semiconductor and the most useful holes (those with the highest oxidation potential) remain in the other. This maximizes the available energy for catalytic reactions [18].
Q4: What experimental evidence confirms an S-scheme charge transfer mechanism? A4: Multiple characterization techniques can provide evidence:
- X-ray Photoelectron Spectroscopy (XPS): Can detect shifts in the binding energy of core elements upon heterojunction formation, indicating electron transfer between semiconductors and the formation of an internal electric field (IEF) [18].
- Radical Scavenging Experiments: Can identify which reactive species (e.g., •OH, •O₂–, hâº) are active in the system, helping to trace the origin of electrons and holes [18].
- Electron Spin Resonance (ESR): Can directly detect and track the generation of radical species, providing further proof of the charge transfer pathway.
Q5: What is the role of the Internal Electric Field (IEF) in heterojunctions? A5: The IEF is a critical driving force for charge separation in heterojunctions, particularly in S-scheme and advanced Type-II systems. It forms at the interface due to the difference in Fermi levels (Ef) between the two semiconductors. Electrons flow from the semiconductor with the higher Ef to the one with the lower Ef until their Fermi levels equilibrate. This process creates a built-in electric field that promotes the desired migration of photoinduced carriers and inhibits their recombination [18] [19].
Troubleshooting Guides
Problem: Poor Charge Separation Despite Heterojunction Formation
Possible Causes and Solutions:
- Cause 1: Incorrect Band Alignment. The selected semiconductors do not have the required straddling of band edges to facilitate the intended charge transfer (Type-II, Z-scheme, or S-scheme).
- Cause 2: Low Quality of the Interface. A poor physical interface between the two semiconductors can hinder electron transfer.
- Cause 3: High Defect Density. Defects at the interface or within the semiconductors can act as recombination centers.
- Solution: Control synthesis conditions to minimize defects. Post-synthesis annealing can sometimes help, but the temperature must be optimized to avoid damaging the heterojunction structure.
Problem: Low Quantum Efficiency and Catalytic Performance
Possible Causes and Solutions:
- Cause 1: Severe Charge Recombination.
- Solution: Introduce a cocatalyst (e.g., Pt for reduction, CoOx for oxidation) onto the heterojunction surface. The cocatalyst provides active sites and can further extract specific charge carriers, reducing recombination [16].
- Cause 2: Inefficient Utilization of Visible Light.
- Solution: Combine a wide-bandgap semiconductor (e.g., CeOâ‚‚, TiOâ‚‚) with a narrow-bandgap, visible-light-responsive material (e.g., CuInSâ‚‚). The narrow-bandgap semiconductor acts as a sensitizer, expanding the light absorption range of the composite [18].
- Cause 3: Unoptimized Mass Ratio of Components.
Problem: Photocorrosion or Instability of the Heterojunction
Possible Causes and Solutions:
- Cause: Oxidation or Reduction of the Photocatalyst Itself. This is common in sulfide-based materials or those susceptible to reactions with photogenerated holes.
- Solution: For S-scheme systems, the recombination of less useful charges at the interface can protect the individual semiconductors from corrosion. Alternatively, consider using more chemically stable metal oxides as one component of the heterojunction or conducting reactions under controlled conditions [18].
Quantitative Performance Data
The following table summarizes performance metrics for selected heterojunction systems as reported in the literature, highlighting their efficacy in various applications.
Table 1: Performance Comparison of Heterojunction Photocatalysts
| Heterojunction System | Type | Application | Performance Metric | Reported Efficiency | Reference |
|---|---|---|---|---|---|
| CuInSâ‚‚/CeOâ‚‚ | S-scheme | Ciprofloxacin (CIP) Degradation | Degradation after specified time | ~90% (vs. 60% for CeOâ‚‚, 12% for CuInSâ‚‚) | [18] |
| Ag₂CO₃/Bi₂WO₆ (AB-9) | Type-II–II | Levofloxacin (LEV) Degradation | Degradation after specified time | 85.4% (1.38x Bi₂WO₆, 1.39x Ag₂CO₃) | [19] |
| BiOI/Bi₂WO₆ | Type-II | Methylene Blue (MB) Degradation | Degradation after specified time | 99% (30% improvement over Bi₂WO₆) | [19] |
| Bi₂WO₆/BiOCl | Type-II | Rhodamine B Degradation | Degradation after specified time | 93.3% (33% improvement over Bi₂WO₆) | [19] |
| g-Câ‚â‚‚N₇H₃ (predicted) | - | Water Splitting | Band Gap (HSE06 functional) | 3.24 eV | [20] |
Table 2: Key Redox Potentials for Photocatalytic Reactions (vs. NHE)
| Reaction | Equation | Redox Potential (V) |
|---|---|---|
| Water Oxidation | 2H₂O + 4h⺠→ O₂ + 4H⺠| +1.23 |
| Water Reduction | 2H⺠+ 2e⻠→ H₂ | 0.00 |
| Hydrogen Peroxide Formation | O₂ + 2H⺠+ 2e⻠→ H₂O₂ | +0.68 |
| Superoxide Radical Formation | O₂ + e⻠→ •O₂⻠| -0.33 |
| Hydroxyl Radical Formation | OH⻠+ h⺠→ •OH | +1.99 |
| Carbon Dioxide Reduction to CO | CO₂ + 2H⺠+ 2e⻠→ CO + H₂O | -0.53 |
| Carbon Dioxide Reduction to CH₃OH | CO₂ + 6H⺠+ 6e⻠→ CH₃OH + H₂O | -0.38 |
Experimental Protocols
Protocol 1: Synthesis of an S-Scheme Heterojunction (CuInSâ‚‚/CeOâ‚‚)
This protocol is adapted from the solvothermal synthesis of CuInSâ‚‚/CeOâ‚‚ for antibiotic degradation [18].
Research Reagent Solutions:
- Cerium Precursor: Cerium nitrate hexahydrate (Ce(NO₃)₃·3H₂O)
- Structure-Directing Agent: Sodium hydroxide (NaOH)
- Copper Source: Copper chloride (CuClâ‚‚)
- Indium Source: Indium chloride (InCl₃)
- Sulfur Source: Thioacetamide (Câ‚‚Hâ‚…NS)
- Solvent: N,N-Dimethylformamide (DMF)
- Target Pollutant: Ciprofloxacin (CIP)
Step-by-Step Methodology:
- Synthesis of CeO₂ Nanorods: a. Dissolve 1 g of Ce(NO₃)₃·3H₂O in 50 mL of deionized water. b. Add this solution to a stirred solution of 9.2 g of NaOH in 100 mL of deionized water. c. Transfer the mixture to a Teflon-lined autoclave and maintain at 100 °C for 24 h. d. Wash the resulting product thoroughly with deionized water and dry at 70 °C for 24 h.
- Synthesis of CuInS₂/CeO₂ Heterojunction: a. Disperse 0.2 g of the as-synthesized CeO₂ in DMF and stir for 15 minutes. b. Add stoichiometric amounts of copper chloride (1 mmol), indium chloride (1 mmol), and thioacetamide (2 mmol) to the suspension. Stir for an additional 30 minutes. c. Transfer the final mixture to an autoclave and heat at 180 °C for 12 h. d. After the reaction, wash the product thoroughly with deionized water and dry overnight at 70 °C. e. Label the heterojunction based on the mole ratio of CuInS₂ to CeO₂ (e.g., 1.0CuInS₂/CeO₂ for a 10% mole ratio).
Characterization and Validation:
- Use XRD to confirm the crystal structure and successful formation of the composite.
- Use UV-Vis spectroscopy to analyze the light absorption properties.
- Use XPS to investigate electron transfer and the potential formation of an internal electric field, which is key evidence for an S-scheme mechanism.
Protocol 2: Evaluating Photocatalytic Degradation Activity
This general protocol can be used to test the efficiency of synthesized heterojunctions for pollutant degradation [18] [19].
Research Reagent Solutions:
- Catalyst: The synthesized heterojunction powder.
- Target Pollutant: e.g., Ciprofloxacin (CIP), Levofloxacin (LEV), or a model dye.
- Radical Scavengers: Isopropanol (for •OH), p-benzoquinone (for •Oâ‚‚â»), EDTA (for hâº).
Step-by-Step Methodology:
- Adsorption-Desorption Equilibrium: Disperse 30 mg of the photocatalyst in 50 mL of an aqueous solution of the pollutant (e.g., 5 mg/L concentration). Stir the suspension in darkness for 30 minutes.
- Photocatalytic Reaction: Illuminate the mixture using a simulated solar light source (e.g., a 100 W Xenon lamp). Position the lamp at a fixed distance (e.g., 10 cm) above the solution surface.
- Sampling: At specific time intervals (e.g., 0, 10, 20, 30, 60 min), withdraw 3 mL aliquots of the suspension.
- Analysis: Centrifuge the samples to remove catalyst particles. Analyze the clear supernatant using a UV-Vis spectrophotometer to determine the remaining concentration of the pollutant. The degradation efficiency can be calculated as: Efficiency (%) = [(C₀ - Cₜ) / C₀] × 100, where C₀ and Cₜ are the initial concentration and concentration at time t, respectively.
- Mechanism Investigation (Radical Trapping): Repeat the experiment by adding different scavengers to the reaction mixture before illumination. A significant decrease in activity upon the addition of a specific scavenger indicates the corresponding species is a primary active radical in the process.
Schematic Diagrams
Diagram 1: Charge Transfer Mechanisms in Heterojunctions
Diagram 2: Experimental Workflow for Heterojunction Synthesis & Testing
The Scientist's Toolkit: Essential Research Reagents & Materials
Table 3: Key Reagents for Heterojunction Photocatalyst Research
| Reagent/Material | Function/Application | Example in Context |
|---|---|---|
| Cerium Nitrate Hexahydrate | Precursor for synthesizing CeOâ‚‚, a wide-bandgap metal oxide semiconductor. | Used as a base material in CuInSâ‚‚/CeOâ‚‚ S-scheme heterojunctions [18]. |
| Bismuth Nitrate Pentahydrate | Precursor for bismuth-based semiconductors (e.g., Bi₂WO₆, BiOI). | Used in the synthesis of Bi₂WO₆ for constructing Type-II heterojunctions with Ag₂CO₃ [19]. |
| Thioacetamide | Sulfur source for the synthesis of metal sulfide semiconductors. | Used to incorporate sulfur during the solvothermal synthesis of CuInSâ‚‚ [18]. |
| Silver Nitrate | Precursor for silver-based semiconductors (e.g., Ag₂CO₃, Ag₃PO₄). | Combined with Bi₂WO₆ to form a Type-II-II heterojunction for antibiotic degradation [19]. |
| p-Benzoquinone | Scavenger of superoxide radicals (•Oâ‚‚â») in mechanism studies. | Used in radical trapping experiments to identify the role of •Oâ‚‚â» in the degradation process [19]. |
| Isopropanol (IPA) | Scavenger of hydroxyl radicals (•OH) in mechanism studies. | Used to quench •OH radicals and determine their contribution to photocatalytic activity [19]. |
| EDTA | Scavenger of photogenerated holes (hâº) in mechanism studies. | Used to confirm the involvement of holes in the oxidation reaction [19]. |
| BMH-9 | BMH-9, CAS:457937-39-2, MF:C19H27N3O2, MW:329.4 g/mol | Chemical Reagent |
| BPTU | BPTU, MF:C23H22F3N3O3, MW:445.4 g/mol | Chemical Reagent |
Technical Support & Troubleshooting Hub
This section addresses common experimental challenges in defect engineering for photocatalysis, providing targeted solutions to improve research outcomes.
Frequently Asked Questions (FAQs)
Q1: Why does my defect-engineered photocatalyst show increased light absorption but no improvement in photocatalytic activity? This typically indicates that the introduced defects, while improving light absorption, are acting as recombination centers rather than effective electron traps. To resolve this:
- Verify Defect Type and Concentration: Use techniques like Electron Paramagnetic Resonance (EPR) to confirm you have created the intended defects (e.g., oxygen vacancies) and not other detrimental defect types. Excess defect concentration can form recombination hubs.
- Check Charge Carrier Dynamics: Perform photoluminescence (PL) spectroscopy or electrochemical impedance spectroscopy (EIS). A decreased PL intensity and reduced arc radius in EIS Nyquist plots for your modified sample confirm suppressed electron-hole recombination [11].
- Optimize Synthesis Conditions: Defect formation is highly sensitive to synthesis environment. For oxides like SrTiO₃, annealing under oxygen-poor conditions promotes oxygen vacancy formation, but the precise chemical potential must be controlled to avoid creating neutral or clustered vacancies that are ineffective [21].
Q2: How can I ensure that oxygen vacancies act as electron traps instead of recombination centers? The key is to prevent the in-gap states associated with vacancies from becoming deep traps. This can be achieved through defect passivation:
- Co-doping Strategy: Introduce a lower-valency dopant adjacent to the vacancy. For example, in SrTiO₃, Al³⺠doping at Tiâ´âº sites adjacent to an oxygen vacancy forms a [VO-AlTi] defect complex. This complex deactivates the deep Ti³+ trap state by breaking the Ti 3d–Ti 3d interaction across the vacancy, effectively eliminating the recombination channel [21].
- Select Dopants with No Valence d Orbitals: The absence of valence d orbitals in dopants like Al³⺠is crucial for successfully passivating the oxygen vacancy in-gap state [21].
Q3: My defect-engineered material performs well in the lab but deactivates quickly during prolonged use. How can I improve its stability? This often results from the instability or gradual healing of the defects under operational conditions.
- Stabilize Defects with a Heterostructure: Construct a Z-scheme heterojunction. In a system like UiO-66-NHâ‚‚@ZnInâ‚‚Sâ‚„, the Z-scheme mechanism effectively separates photogenerated electrons and holes, suppressing the photo-corrosion that typically degrades the catalyst (like ZnInâ‚‚Sâ‚„) [22].
- Modulate the Microenvironment: In the UiO-66-NHâ‚‚@ZnInâ‚‚Sâ‚„ example, the metal-organic framework (MOF) provides a porous structure with abundant channels. This not only facilitates mass transfer but may also help stabilize the sulfur vacancies in ZnInâ‚‚Sâ‚„, contributing to a system that demonstrated stable performance for over 200 hours [22].
Troubleshooting Common Experimental Setbacks
Problem: Inconsistent photocatalytic performance between different batches of the same defect-engineered material.
- Solution: Strictly control the precursor ratios and atmospheric conditions during synthesis. For sol-gel processes, ensure precise stoichiometry and drying/calcination temperatures. Using a robust structure-searching method during computational modeling can help identify the true ground-state defect configuration, guiding more reproducible synthesis [21].
Problem: Low selectivity for the desired reaction pathway (e.g., 2-electron oxygen reduction).
- Solution: Engineer defects to control adsorption configuration. Sulfur vacancies in ZnInâ‚‚Sâ‚„ modulate Oâ‚‚ adsorption from a Yeager-type (side-on) configuration to a Pauling-type (end-on) configuration. The Pauling-type favors the formation of the *OOH intermediate and suppresses O-O bond cleavage, thereby highly selectively steering the reaction toward Hâ‚‚Oâ‚‚ production [22].
Quantitative Performance Data
The following table summarizes key performance metrics from recent studies, highlighting the efficacy of different defect engineering strategies.
Table 1: Performance Metrics of Defect-Engineered Photocatalysts
| Material System | Defect / Engineering Strategy | Primary Application | Performance Metric | Reported Value | Key Improvement Mechanism |
|---|---|---|---|---|---|
| UiO-66-NHâ‚‚@ZnInâ‚‚Sâ‚„ (Z-scheme) [22] | Sulfur Vacancies in ZIS | Hâ‚‚Oâ‚‚ Production | Production Rate: 3200 µmol gâ»Â¹ hâ»Â¹Selectivity: 94.3% | Promotes Pauling-type Oâ‚‚ adsorption for efficient 2e ORR; Z-scheme enhances charge separation. | |
| SrTiO₃:Al [21] | Al³⺠Doping passivating Oxygen Vacancies | Water Splitting | Quantum Efficiency: >90% | Eliminates deep trap states (Ti³+) from oxygen vacancies, drastically reducing recombination. | |
| ZIF-11/g-C₃N₄ [11] | Z-scheme Heterojunction | Dye Degradation (Methylene Blue) | Degradation Efficiency: 72.7% (in 60 min)TOC Removal: 66.5% (in 5 hr) | Z-scheme mechanism effectively separates electrons and holes, reducing recombination. | |
| Ag,CdO,ZnO/TiOâ‚‚ [23] | Ternary Doping (Schottky, Z-scheme, Type II) | Water Splitting (Hâ‚‚ Production) | High Hâ‚‚ Production Rate (departure from Arrhenius behavior) | Synergistic effects create multiple pathways for charge separation, overcoming recombination. |
Standardized Experimental Protocols
Protocol 1: Creating and Passivating Oxygen Vacancies in SrTiO₃ via Al Doping
This protocol is adapted from studies achieving high quantum efficiency in water splitting [21].
Objective: To synthesize Al-doped SrTiO₃ where Al³⺠ions passivate the in-gap states of oxygen vacancies, thereby suppressing charge carrier recombination.
Materials:
- Precursors: Strontium salt (e.g., Sr(NO₃)₂), Titanium precursor (e.g., Ti-isopropoxide), Aluminum precursor (e.g., Al(NO₃)₃).
- Solvent: Deionized water or ethanol.
- Flux agent: SrClâ‚‚ (for flux-assisted synthesis).
- Equipment: High-temperature muffle furnace, alumina crucibles, magnetic stirrer, drying oven.
Methodology:
- Precursor Solution Preparation: Dissolve the Sr, Ti, and Al precursors in the solvent according to the desired stoichiometric ratio (e.g., SrTiâ‚â‚‹â‚“Alâ‚“O₃). Stir vigorously for 2 hours to obtain a homogeneous solution.
- Drying: Evaporate the solvent slowly at 80°C to form a dry gel.
- Calcination (Flux Method):
- Mix the dried precursor powder with SrClâ‚‚ flux in a defined weight ratio.
- Place the mixture in an alumina crucible and calcine in a muffle furnace at 1423 K (1150°C) for 4-6 hours under an air atmosphere. The high temperature and flux promote crystal growth and defect formation.
- Critical Step: The "oxygen-poor" condition during crystal growth is intrinsic to this high-temperature process in a closed crucible, favoring the formation of oxygen vacancies [21].
- Post-processing: After cooling to room temperature, wash the resulting product repeatedly with deionized water to completely remove the SrCl₂ flux. Dry the final powder at 100°C overnight.
Validation Techniques:
- X-ray Photoelectron Spectroscopy (XPS): To confirm the presence of Al and analyze the Ti³+/Tiâ´+ ratio. A successful passivation will show a suppression of Ti³+ signals [21].
- Electron Paramagnetic Resonance (EPR): To detect and quantify paramagnetic defect states like unpassivated oxygen vacancies before and after doping.
- Photoluminescence (PL) Spectroscopy: A significant quenching of PL emission in the Al-doped sample indicates a reduction in electron-hole recombination.
Protocol 2: Constructing a Z-scheme Heterojunction with Defect-Modulated Surface (UiO-66-NHâ‚‚@ZIS)
This protocol is based on a system for highly selective Hâ‚‚Oâ‚‚ production [22].
Objective: To in-situ grow sulfur-deficient ZnInâ‚‚Sâ‚„ (ZIS) nanosheets on UiO-66-NHâ‚‚ MOF crystals to form a Z-scheme heterojunction where sulfur vacancies optimize Oâ‚‚ adsorption.
Materials:
- UiO-66-NHâ‚‚ crystals (synthesized separately via solvothermal method).
- Precursors: Zinc acetate (Zn(CH₃COO)₂), Indium chloride (InCl₃), Thioacetamide (C₂H₅NS).
- Solvents: Methanol, Dimethylformamide (DMF).
Methodology:
- Dispersion of MOF: Disperse a known quantity of pre-synthesized UiO-66-NHâ‚‚ crystals in methanol using ultrasonication for 30 minutes.
- In-situ Growth of ZIS:
- Add Zinc acetate and Indium chloride to the above dispersion. Stir for 30 minutes to allow adsorption of metal ions onto the MOF surface.
- Add a controlled amount of Thioacetamide (the sulfur source) to the mixture.
- Heat the reaction mixture at 60-70°C for several hours under continuous stirring. The controlled decomposition of thioacetamide and the limited sulfur source lead to the in-situ growth of ZIS nanosheets with inherent sulfur vacancies on the UiO-66-NH₂ surface [22].
- Isolation and Washing: Collect the solid product by centrifugation. Wash thoroughly with methanol and ethanol to remove unreacted precursors.
- Drying: Dry the final U6N@ZIS composite at 60°C in a vacuum oven.
Validation Techniques:
- High-Angle Annular Dark-Field STEM (HAADF-STEM) and EDS Mapping: To confirm the core-shell structure and uniform distribution of elements.
- X-ray Absorption Fine Structure (XAFS): Analyze the Zn K-edge to detect the negative shift and reduced coordination number, providing direct evidence for sulfur vacancies [22].
- Photocatalytic Test: Evaluate Hâ‚‚Oâ‚‚ production in pure water under visible light. A high production rate and selectivity confirm the successful synergy between the Z-scheme charge transfer and defect-modulated surface reaction.
Mechanism and Workflow Visualizations
Defect Passivation Resolves Recombination
Z-Scheme Heterojunction with Defect Engineering Workflow
The Scientist's Toolkit: Research Reagent Solutions
Table 2: Essential Materials for Defect-Engineered Photocatalyst Synthesis
| Reagent / Material | Function in Experiment | Specific Example |
|---|---|---|
| Strontium Nitrate (Sr(NO₃)₂) | Sr precursor for perovskite oxides (e.g., SrTiO₃). | Synthesis of SrTiO₃ photocatalyst [21]. |
| Titanium Isopropoxide (Câ‚â‚‚H₂₈Oâ‚„Ti) | Ti precursor for TiOâ‚‚ and titanate-based photocatalysts. | Synthesis of TiOâ‚‚ and SrTiO₃ [23] [21]. |
| Aluminum Nitrate (Al(NO₃)₃·9H₂O) | Al³⺠dopant source for passivating oxygen vacancies. | Passivation of deep traps in SrTiO₃ [21]. |
| Zinc Acetate (Zn(CH₃COO)₂) | Zn²⺠precursor for chalcogenide semiconductors. | Synthesis of ZnIn₂S₄ and ZnO-based photocatalysts [22] [23]. |
| Thioacetamide (Câ‚‚Hâ‚…NS) | Sulfur source. Controlled use can introduce sulfur vacancies. | Creating S-deficient ZnInâ‚‚Sâ‚„ [22]. |
| Zirconium Chloride (ZrClâ‚„) | Metal cluster precursor for Zr-based MOFs (e.g., UiO-66). | Synthesis of UiO-66-NHâ‚‚ MOF support [22]. |
| 2-Aminoterephthalic Acid | Organic linker for constructing functionalized MOFs (UiO-66-NHâ‚‚). | Provides NHâ‚‚ groups for heterojunction formation in UiO-66-NHâ‚‚ [22]. |
| B 746 | B 746, CAS:103051-26-9, MF:C26H20Cl2N4, MW:459.4 g/mol | Chemical Reagent |
| iMAC2 | iMAC2, CAS:335166-36-4, MF:C19H20Br2FN3, MW:469.2 g/mol | Chemical Reagent |
Morphological Control and Nanostructuring for Shortened Charge Migration Paths
Troubleshooting Guide: FAQ on Nanostructuring for Charge Carrier Management
This guide addresses common challenges researchers face when designing photocatalysts with optimized charge carrier pathways to reduce electron-hole recombination.
FAQ 1: Why does my synthesized hollow nanostructure show lower photocatalytic activity than expected, despite a high surface area?
- Potential Cause: Incomplete or collapsed hollow structures can hinder mass transport and charge carrier migration, while poor interfacial contact in composite materials can lead to high charge transfer resistance.
- Solution:
- Verify the integrity of the hollow structure using techniques like TEM and SEM. A successful hollow shell nanostructure should show a distinct void space and a well-defined shell [24].
- For composite hollow structures (e.g., MOF-derived materials), ensure a coherent interface between components. Techniques like HRTEM can confirm this. In the TiOâ‚‚@ZrBTB hollow shell nanostructure, the in situ self-sacrificial template method was key to forming a well-integrated heterostructure with a well-defined hollow morphology [24].
- Use a structure-directing agent, like Polyvinylpyrrolidone (PVP) in the synthesis of TiOâ‚‚@ZrBTB, to control the growth and etching processes for a uniform hollow architecture [24].
FAQ 2: My heterojunction photocatalyst absorbs light but shows poor charge separation. What is wrong?
- Potential Cause: The problem often lies in the band alignment between the semiconductors. A simple physical mixture without intimate contact or an incorrect band alignment (e.g., Type-I) does not create the internal electric field needed for effective charge separation.
- Solution:
- Design an S-scheme or Z-scheme heterojunction. These systems not only enhance charge separation but also preserve the strongest redox abilities of the constituent semiconductors [25] [26]. For instance, the GaP-TiOâ‚‚ S-scheme heterojunction was confirmed to significantly enhance carrier separation and boost hydrogen production [27].
- Perform characterization like XPS to verify the presence of an internal electric field and the desired charge migration pathway [28] [25].
- Ensure synthesis methods (e.g., in-situ growth, calcination) create close interfacial contact rather than just mixing pre-formed components.
FAQ 3: The charge carrier lifetime in my one-dimensional (1D) nanofiber photocatalyst is still insufficient. How can I further improve it?
- Potential Cause: While 1D structures provide a direct path for electron travel, recombination can still occur rapidly if electron extraction and hole scavenging are not simultaneous.
- Solution:
- Implement a multichannel charge transfer system. This involves integrating multiple functional components into a single structure. A proven design is a Z-scheme heterostructure (e.g., TiO₂/WO₃) decorated with dual cocatalysts.
- Use a noble metal with low overpotential, like Platinum (Pt), as an electron collector to facilitate the reduction reaction.
- Simultaneously, use a semiconductor like Tungsten Trioxide (WO₃) as a hole collector. This creates multiple, parallel pathways for electrons and holes, drastically reducing their chance of recombination and directly evidenced by improved photocurrent and electrochemical impedance spectroscopy (EIS) results [29].
FAQ 4: How can I accurately confirm the charge transfer mechanism in my novel S-scheme homojunction?
- Potential Cause: Relying solely on indirect performance metrics is insufficient; direct evidence of the charge transfer pathway is needed.
- Solution:
- Use in-situ spectroscopic techniques to track electron flow under actual working conditions.
- A highly effective method is to deposit bimetallic cocatalysts (e.g., Pt and Au oxide) as redox probes on different components of the homojunction. Subsequent analysis with in-situ XPS can track electron transfer between the constituents (e.g., from C₃N₅ to C₃N₄), providing direct verification of the S-scheme mechanism [28].
- Femtosecond transient absorption spectroscopy (fs-TAS) can further provide deep insights into the ultrafast charge transfer dynamics [28].
Performance Data of Nanostructured Photocatalysts
The following table summarizes quantitative data from recent studies on various nanostructuring strategies for improving charge migration.
Table 1: Performance of Photocatalysts with Engineered Charge Migration Paths
| Material System | Nanostructure / Strategy | Application | Key Performance Metric | Reference / Model System |
|---|---|---|---|---|
| C₃Nâ‚…/C₃Nâ‚„ | Polymeric S-scheme Homojunction | Hâ‚‚Oâ‚‚ Production | 8.78 mmol gâ»Â¹ hâ»Â¹ (visible light) | [28] |
| TiOâ‚‚@ZrBTB | Hollow Shell Nanostructure | Tetracycline Degradation | Enhanced degradation rate vs. precursors | [24] |
| GaP-TiOâ‚‚ | S-scheme Heterojunction | Hâ‚‚ Production | 12-fold enhancement vs. pristine catalyst | [27] |
| Au/Pt/WO₃/TiO₂ | 1D Nanofibers, Z-scheme, Multichannel | H₂ Evolution | Greatly enhanced rate vs. single components | [29] |
| MOFs (General) | Multiscale Structural Regulation | Various (Energy/Environment) | Enhanced efficiency via synergistic structural effects | [30] |
Detailed Experimental Protocols
Protocol 1: Synthesis of a Hollow Shell Nanostructure via In Situ Self-Sacrificial Template
This protocol is adapted from the synthesis of TiOâ‚‚@ZrBTB for photocatalytic degradation [24].
- Objective: To fabricate a hollow shell heterostructure that shortens charge migration distances and provides separate reaction zones.
- Materials:
- Precursor MOF (e.g., NHâ‚‚-MIL-125(Ti))
- Zirconium-based salt (e.g., ZrClâ‚„)
- Organic linker (e.g., H₃BTB - 1,3,5-Tris(4-carboxyphenyl)benzene)
- Structure-directing agent (e.g., PVP - Polyvinylpyrrolidone)
- Solvents: Dimethylformamide (DMF), Methanol
- Procedure:
- Synthesize the sacrificial template: First, prepare NH₂-MIL-125(Ti) crystals using a solvothermal method (e.g., 150°C for 8 hours) [24].
- Pretreatment: Disperse the pre-formed NHâ‚‚-MIL-125(Ti) in a solution containing PVP to modify its surface [24].
- In-situ growth and etching: Combine the PVP-pretreated precursor with the ZrBTB synthesis reagents (Zr salt and H₃BTB linker) in a binary solvent system (DMF/Methanol). Transfer the mixture to a Teflon-lined autoclave.
- Hydrothermal reaction: Maintain the reactor at the required temperature (e.g., 150°C). The reaction time is critical:
- A shorter duration (e.g., 12 hours) may yield a core-shell intermediate (NHâ‚‚-MIL-125(Ti)@ZrBTB).
- Extending the time (e.g., 48 hours) allows the acidic conditions and hydrothermal environment to in-situ etch and convert the NHâ‚‚-MIL-125(Ti) core, ultimately forming the hollow-shell TiOâ‚‚@ZrBTB nanostructure [24].
- Purification: After cooling, collect the product by centrifugation and wash thoroughly with DMF and ethanol to remove unreacted precursors and PVP.
Experimental Workflow for Hollow Shell Synthesis
Protocol 2: Constructing a Multichannel Charge Transfer System in 1D Nanofibers
This protocol is based on the fabrication of Au/Pt/WO₃/TiO₂ nanofibers for enhanced H₂ evolution [29].
- Objective: To create a 1D Z-scheme heterostructure with dual cocatalysts for simultaneous electron and hole extraction.
- Materials:
- Titanium precursor (e.g., Titanium(IV) isopropoxide)
- Tungsten precursor (e.g., Ammonium metatungstate)
- Polymeric matrix (e.g., PVP for electrospinning)
- Solvent (e.g., Ethanol, Acetic acid)
- Metal salts (Chloroauric acid, Chloroplatinic acid)
- Procedure:
- Electrospinning precursor solution: Prepare a homogeneous solution containing the Ti and W precursors within the polymeric matrix. Load the solution into a syringe for electrospinning.
- Electrospinning: Use a high voltage to draw fibers from the solution, collecting them on a rotating drum to form a non-woven mat.
- Calcination: Subject the collected fiber mat to a controlled calcination process in air. This step removes the polymer and crystallizes the metal oxides, forming WO₃/TiO₂ composite nanofibers [29].
- Photodeposition of cocatalysts: Disperse the calcined nanofibers in an aqueous solution containing methanol (as a sacrificial agent).
- Add a gold salt (e.g., HAuClâ‚„) and irradiate with UV-Vis light to photodeposit Au nanoparticles.
- Similarly, add a platinum salt (e.g., H₂PtCl₆) to photodeposit Pt nanoparticles.
- The final product is Au/Pt/WO₃/TiO₂ nanofibers, where the 1D structure provides a direct path, the Z-scheme between TiO₂ and WO₃ enhances separation, and Au/Ps serve as electron collectors and plasmonic sensitizers [29].
Multichannel Charge Transfer Pathways in a 1D Z-Scheme System
The Scientist's Toolkit: Research Reagent Solutions
Table 2: Essential Materials for Nanostructuring and Charge Carrier Management
| Research Reagent / Material | Function in Experiment | Key Characteristic / Rationale |
|---|---|---|
| PVP (Polyvinylpyrrolidone) | Structure-directing agent and stabilizer. | Controls the growth kinetics and morphology during nanostructure synthesis, crucial for forming hollow architectures [24]. |
| NHâ‚‚-MIL-125(Ti) | Sacrificial template and Ti precursor. | A titanium-based MOF that can be controllably etched or converted to form defined TiOâ‚‚-containing heterostructures [24]. |
| ZrBTB Nanosheets | Porous shell material and support platform. | Provides an ultrathin, porous boundary layer that reduces charge migration distance and offers abundant active sites [24]. |
| GaP (Gallium Phosphide) | Component for S-scheme heterojunction. | Forms an effective S-scheme heterojunction with TiOâ‚‚, enhancing carrier separation and photocatalytic Hâ‚‚ production [27]. |
| WO₃ (Tungsten Trioxide) | Hole-accepting semiconductor. | Used in Z-scheme systems with TiO₂; its valence band position makes it an excellent hole collector, suppressing recombination [29]. |
| Pt Nanoparticles | Cocatalyst and electron collector. | Its small work function and low overpotential for proton reduction make it an excellent electron sink for Hâ‚‚ evolution reactions [29]. |
| Au Nanoparticles | Plasmonic sensitizer and electron donor. | Exhibits Surface Plasmon Resonance (SPR), extending light absorption into the visible range and injecting hot electrons into semiconductors [29]. |
| BX517 | BX517, CAS:850717-64-5, MF:C15H14N4O2, MW:282.3 g/mol | Chemical Reagent |
| Alert | Alert|Structural Alert Compound|RUO | The compound 'Alert' is a research tool for studying structural alerts in predictive toxicology. This product is For Research Use Only. Not for human or veterinary use. |
In the pursuit of enhancing photocatalytic efficiency for applications ranging from water splitting to environmental remediation, the significant recombination of photogenerated electron-hole pairs remains a central challenge. While strategies like doping and heterojunction engineering focus on the charge property of electrons, a nascent frontier leverages their intrinsic spin property. Controlling electron spin and applying external magnetic fields presents a revolutionary approach to regulate exciton dissociation and charge separation, offering a powerful, often non-contact, method to suppress recombination and boost photocatalytic performance [31] [32].
This technical support center provides troubleshooting guides and experimental protocols for researchers integrating these advanced spin-based strategies into their photocatalysis work.
Core Concepts: Spin Polarization and Magnetic Field Effects
Frequently Asked Questions
Q1: How can an external magnetic field possibly influence a non-magnetic photocatalyst? Even for diamagnetic or paramagnetic catalysts that are not inherently magnetic, an external magnetic field can enhance charge separation through the Lorentz force. This force acts on moving charges (electrons and holes), causing them to follow curved paths, which increases their diffusion length and reduces the chance of immediate recombination [32].
Q2: What is spin polarization and how is it different from applying a magnetic field? Spin polarization is an internal property of a material where electrons prefer to align in one spin state (up or down). This creates an internal magnetic environment. An external magnetic field, in contrast, is an external force that can align spins and induce the Lorentz effect. In ferromagnetic catalysts, these two effects can work synergistically [32].
Q3: My photocatalytic material is not magnetic. Do I need to redesign it completely? Not necessarily. While designing materials with innate spin polarization is ideal, you can still achieve significant performance gains by applying an external magnetic field to your existing setup. Furthermore, you can dope your current material (e.g., with single metal atoms like Cobalt) to introduce spin polarization without a full material redesign [31].
Troubleshooting Guide: Common Experimental Challenges
| Problem Phenomenon | Potential Cause | Diagnostic Steps | Proposed Solution |
|---|---|---|---|
| No performance improvement under magnetic field | Magnetic field strength is too weak to overcome thermal randomization. | Verify field strength at the reaction site with a Gauss meter. Check if catalyst is diamagnetic. | Increase field strength (e.g., switch to NdFeB magnets). For diamagnetic catalysts, focus on Lorentz force effects. |
| Inconsistent results between experiments | Inhomogeneous magnetic field across the reaction vessel. | Map the magnetic field distribution within your reactor. | Redesign reactor geometry or magnet placement to ensure a uniform field covers the entire reaction volume. |
| Performance enhancement diminishes over time | Heating of permanent magnets near light source, reducing field strength. | Monitor temperature of magnets and reactor over time. | Introduce active cooling or use thermal shielding between light source and magnets. |
| Uncertainty about spin-polarized material function | Lack of characterization for spin-dependent electronic structure. | Perform Electron Paramagnetic Resonance (EPR) spectroscopy to confirm unpaired electrons and spin states [33]. | Correlate EPR data with photocatalytic activity; optimize doping concentrations to maximize active spin sites. |
Experimental Protocols
Protocol 1: Applying a Static Magnetic Field to a Photocatalytic Reaction
Objective: To boost photocatalytic reaction rate (e.g., hydrogen evolution or pollutant degradation) via an external magnetic field.
Materials and Setup:
- Photocatalytic reactor (e.g., batch-type with optical window).
- Light source (e.g., Xe lamp simulating solar spectrum).
- Permanent neodymium (NdFeB) magnets or an electromagnet.
- Gauss meter for magnetic field calibration.
Methodology:
- Setup Configuration: Position the magnets to generate a uniform magnetic field perpendicular to the primary direction of light illumination. Measure and record the field strength (e.g., 24.5 mT to 500 mT) using the Gauss meter at the reactor's center [31] [32].
- Control Experiment: Run the photocatalytic reaction (e.g., hydrogen evolution from water) under standard conditions without the magnetic field.
- Magnetic Field Experiment: Repeat the reaction under identical conditions with the magnetic field applied.
- Quantitative Analysis: Compare the production rates (e.g., µmol·gâ»Â¹Â·hâ»Â¹ of Hâ‚‚) between the two experiments. A successful outcome is a significant rate increase, such as the 340-fold enhancement observed in a C3N4 system [31].
Protocol 2: Synthesizing a Spin-Polarized Co-Doped C3N4 Photocatalyst
Objective: To create a photocatalyst with intrinsic spin polarization for enhanced charge separation.
Materials: Urea or melamine (precursor), Cobalt nitrate (Co source), Muffle furnace.
Methodology:
- Precursor Mixing: Thoroughly mix the C3N4 precursor (e.g., urea) with a calculated amount of Cobalt nitrate to achieve the desired doping level (e.g., 1-3 wt% Co).
- Thermal Polycondensation: Place the mixture in a crucible and heat in a muffle furnace under air. A typical program is: ramp to 550°C over 2 hours and hold for 4 hours.
- Collection and Grinding: After cooling, collect the resulting solid and grind it into a fine powder.
- Validation: Confirm successful doping and spin polarization using techniques like X-ray photoelectron spectroscopy (XPS) and EPR spectroscopy [31]. The Co atoms change the local symmetry of C3N4, creating spin polarization that facilitates exciton dissociation under magnetic fields.
Essential Research Reagents and Materials
| Item | Function / Relevance in Spin Control | Example from Literature |
|---|---|---|
| Cinchonine / Cinchonidine | Chiral organic molecules used to guide the formation of left- or right-handed magnetic nanohelices during electrochemical synthesis [34]. | Used to create nanohelices for spin-selective electron transport [34]. |
| Cobalt (II) Nitrate | A source of single Co²⺠atoms for doping semiconductors. Introduces unpaired electrons, creating spin polarization in the host material [31]. | Doped into C3N4 to create a spin-polarized photocatalyst [31]. |
| Neodymium Magnets | Provide a strong, persistent external magnetic field for experimental setups, crucial for studying magnetically enhanced photocatalysis [31] [32]. | Used to apply a ~24.5 mT field, boosting Hâ‚‚ production by 340 times [31]. |
| TiH Molecules on MgO | A model quantum spin system used with ESR-STM to demonstrate precise electric field control over single spin states at the atomic scale [35]. | Enabled observation of strong spin-electric coupling, shifting ESR peaks via bias voltage [35]. |
Supporting Diagrams and Workflows
Diagram 1: Mechanisms of Magnetic Field-Enhanced Charge Separation
Diagram 2: Electric Field Control of a Single Spin (ESR-STM)
Troubleshooting Guides & FAQs
Bi2MoO6-Based Photocatalysts
Q1: My Bi2MoO6 photocatalyst shows poor degradation efficiency for organic pollutants. What could be the main issue?
A: The most common cause is the rapid recombination of photogenerated electron-hole pairs, a fundamental bottleneck for pristine Bi2MoO6 [36]. This limits the availability of charge carriers for redox reactions. To diagnose this:
- Perform Photoluminescence (PL) Spectroscopy: A high-intensity PL peak indicates strong charge carrier recombination. Compare the PL intensity of your sample with modified composites (e.g., heterojunctions) which should show a significant reduction in peak intensity [36].
- Check Photocurrent Response: A weak photocurrent in transient photocurrent response measurements confirms poor charge separation and slow electron transfer [36].
Q2: How can I improve the visible-light absorption and charge separation of Bi2MoO6?
A: The most effective strategy is constructing heterojunctions. A proven case is the Bi2MoO6/Bi4V2O11 heterojunction fabricated via a one-pot solvothermal method [37].
- Mechanism: The heterostructure creates a built-in electric field at the interface that efficiently drives photo-induced electrons and holes in opposite directions, thereby suppressing their recombination [37].
- Expected Outcome: This heterojunction has demonstrated significantly enhanced photocatalytic activity for methylene blue (MB) degradation and Cr(VI) reduction compared to pristine Bi2MoO6 [37].
g-C3N4-Based Photocatalysts
Q1: My g-C3N4 material suffers from a fast recombination rate and low surface area. What modification strategies can I use?
A: g-C3N4 is notoriously limited by these factors. You can employ several engineering strategies [38]:
- Morphological Control: Use a templating strategy to create hollow structures. For example, Hollow g-C3N4 Nanospheres (HCNS) synthesized with a silica template provide a high specific surface area, acting as a superior light-harvesting platform [38].
- Elemental Doping: Incorporating foreign atoms into the g-C3N4 lattice can tune its electronic band structure and create separation centers for charge carriers.
- Heterojunction Construction: Coupling g-C3N4 with another semiconductor to form a Z-scheme heterojunction is highly effective. A double Z-scheme system like g-C3N4/AgI/β-AgVO3 has shown improved spatial charge separation and enhanced generation of reactive radicals for pollutant degradation [38].
Q2: What is a simple method to prepare g-C3N4 with a high surface area?
A: A straightforward method is the hydrothermal treatment of bulk g-C3N4.
- Protocol: Treat bulk g-C3N4 in pure water at 180°C via a one-step hydrothermal process [38].
- Result: This treatment causes interlayer delamination and intralayer depolymerization, drastically increasing the specific surface area from 2.3 m² gâ»Â¹ to 69.8 m² gâ»Â¹. The resulting material also contains oxygen-containing groups, which contribute to high photocatalytic performance for Hâ‚‚ evolution [38].
General Photocatalyst Issues
Q1: How can I experimentally confirm that my material modification has successfully reduced electron-hole recombination?
A: You should characterize your materials using the following techniques, which provide direct and indirect evidence of improved charge separation:
- Photoluminescence (PL) Spectroscopy: A decrease in the PL emission peak intensity directly indicates suppressed electron-hole recombination [36].
- Transient Photocurrent Response: A stronger and more stable photocurrent response upon light irradiation signifies more efficient separation and migration of charge carriers [36].
- Electrochemical Impedance Spectroscopy (EIS): A smaller arc radius in the Nyquist plot demonstrates lower charge transfer resistance and more efficient charge separation at the catalyst interface [36].
The table below summarizes performance data for selected material systems from the case studies, highlighting the impact of different engineering strategies on reducing recombination and enhancing photocatalytic activity.
Table 1: Quantitative Performance of Engineered Photocatalysts
| Photocatalyst | Synthesis Method | Key Modification Strategy | Performance Metric | Result | Reference |
|---|---|---|---|---|---|
| BPB/Biâ‚‚MoO₆ (1:4) | Hydrothermal | Composite with Biochar | Rate constant for CIP degradation | 0.0486 minâ»Â¹ (12.5x higher than pure Biâ‚‚MoO₆) | [36] |
| Biâ‚‚MoO₆/Biâ‚„Vâ‚‚Oâ‚â‚ | One-pot Solvothermal | Heterojunction | MB Degradation & Cr(VI) Reduction | "Significantly enhanced" vs. pristine components | [37] |
| OG/g-C₃Nâ‚„ | Hydrothermal | Surface Area Increase | Specific Surface Area | Increased from 2.3 to 69.8 m² gâ»Â¹ | [38] |
| g-C₃N₄/AgI/β-AgVO₃ | One-pot Hydrothermal | Dual Z-Scheme Heterojunction | Charge Carrier Transfer | Improved separation & transfer for radical generation | [38] |
| HCNS (g-C₃N₄) | Template-based | Morphological Control (Hollow Sphere) | H₂ Evolution | Enhanced performance due to better light harvesting | [38] |
Experimental Protocols
1. Objective: To fabricate a heterojunction photocatalyst with nanoscale interfacial contact to enhance charge carrier separation. 2. Materials:
- Precursors: Bi(NO₃)₃·5H₂O, (NH₄)₆Mo₇O₂₄·4H₂O, NH₄VO₃.
- Solvent: Ethylene Glycol.
- pH Modifier: 2 M Sodium Hydroxide (NaOH) solution. 3. Procedure:
- Step 1: Dissolve 2 mmol of Bi(NO₃)₃·5H₂O in 15 mL of ethylene glycol with magnetic stirring in an 80°C water bath until a clear solution forms.
- Step 2: Add appropriate stoichiometric amounts of (NH₄)₆Mo₇O₂₄·4H₂O and NH₄VO₃ to the bismuth solution. Continuously stir for 20 minutes at 80°C.
- Step 3: Adjust the pH of the resulting solution to approximately 8 by the slow, dropwise addition of 2 M NaOH solution.
- Step 4: Transfer the final solution into a 25 mL Teflon-lined stainless steel autoclave. Seal the autoclave and heat it in an oven at 160°C for 16 hours.
- Step 5: After the autoclave cools to room temperature naturally, collect the product by centrifugation. Wash the precipitate three times with deionized water and absolute ethanol.
- Step 6: Dry the final product at 80°C in air for 4 hours to obtain the Biâ‚‚MoO₆/Biâ‚„Vâ‚‚Oâ‚â‚ heterojunction photocatalyst.
1. Objective: To increase the specific surface area of bulk g-C₃N₄ and introduce oxygen-containing functional groups. 2. Materials:
- Bulk g-C₃N₄ (synthesized via thermal condensation of urea or melamine).
- Deionized water. 3. Procedure:
- Step 1: Subject bulk g-C₃N₄ to a one-step hydrothermal treatment in pure water.
- Step 2: Maintain the reaction temperature at 180°C for a specified period.
- Step 3: Recover the product, now referred to as oxygen-containing-groups-modified g-C₃N₄ (OG/g-C₃N₄). This process promotes interlayer delamination and intralayer depolymerization, resulting in a material with a high surface area and modified surface properties.
Visualization of Mechanisms and Workflows
Charge Separation in a Heterojunction
The following diagram illustrates the general mechanism of enhanced electron-hole separation in a semiconductor heterojunction, a key strategy for Bi₂MoO₆ and g-C₃N₄ composites.
Experimental Workflow for Photocatalyst Synthesis & Testing
This flowchart outlines a standard experimental workflow for developing and evaluating a novel photocatalyst, integrating the protocols and characterization methods discussed.
The Scientist's Toolkit: Research Reagent Solutions
Table 2: Essential Reagents for Photocatalyst Synthesis and Evaluation
| Reagent / Material | Function in Research | Example Use Case |
|---|---|---|
| Bismuth Nitrate Pentahydrate (Bi(NO₃)₃·5Hâ‚‚O) | Common Bi-precursor for synthesizing bismuth-based photocatalysts. | Synthesis of Biâ‚‚MoO₆ and Biâ‚„Vâ‚‚Oâ‚â‚ [37]. |
| Melamine / Urea | Nitrogen-rich precursors for the thermal synthesis of g-C₃N₄. | Preparation of bulk g-C₃N₄ via thermal condensation [38]. |
| Ammonium Metavanadate (NHâ‚„VO₃) | Source of Vanadium (V) for constructing complex oxides. | Forming the Biâ‚„Vâ‚‚Oâ‚â‚ component in a heterojunction [37]. |
| Ammonium Molybdate ((NH₄)₆Mo₇O₂₄·4H₂O) | Source of Molybdenum (Mo) for molybdate-based catalysts. | Formation of the Bi₂MoO₆ phase [37]. |
| Ethylene Glycol | Solvent and complexing agent in solvothermal synthesis. | Used as the reaction medium in the one-pot solvothermal synthesis of Biâ‚‚MoO₆/Biâ‚„Vâ‚‚Oâ‚â‚ [37]. |
| Cetyltrimethylammonium Bromide (CTAB) | Surfactant and structure-directing agent. | Controls the morphology and size of Bi₂MoO₆ crystals during synthesis, leading to higher surface area and activity [36]. |
| Methylene Blue (MB) | Model organic pollutant for evaluating photocatalytic degradation efficiency. | Standard dye used to test and compare the performance of photocatalysts like Biâ‚‚MoO₆/Biâ‚„Vâ‚‚Oâ‚â‚ [37]. |
| Potassium Dichromate (K₂Cr₂O₇) | Source of Cr(VI) ions for testing photocatalytic reduction capability. | Used to evaluate the reduction performance of photocatalysts in remediating heavy metal pollution [37]. |
| Unii-wtw6cvn18U | Cevin (Vinorelbine) | Cevin (Vinorelbine 10mg) is a vinca alkaloid for cancer research. It inhibits microtubule polymerization. For Research Use Only. Not for human use. |
| Dabth | Dabth, CAS:72683-57-9, MF:C17H17N5OS, MW:339.4 g/mol | Chemical Reagent |
Optimizing Photocatalytic Systems: Navigating Challenges and Fine-Tuning Parameters
Troubleshooting Guides
Guide 1: Diagnosing and Correcting Poor Band Alignment
Problem: Low photocatalytic efficiency due to incorrect band alignment, leading to inefficient charge separation or reduced redox power.
Q1: How can I quickly diagnose a Type-II band alignment that is diminishing my system's redox ability? A: A primary indicator is a measurable drop in the open-circuit voltage (V_OC) of your system compared to the individual components. Thermodynamically, in a faulty Type-II system, you will observe photogenerated electrons moving to a semiconductor with a less negative conduction band and holes moving to a semiconductor with a less positive valence band. This results in spatially separated but energetically weakened charges. Measure the quasi-Fermi level splitting to confirm the loss in achievable photovoltage. [39]
Q2: What is the most reliable method to verify the actual band alignment at my heterojunction interface? A: While Anderson's rule (using vacuum electron affinity) offers a first approximation, it is often inaccurate as it neglects interface-specific chemical bonding and dipoles. [40] [41] For a more definitive measurement:
- UV Photoelectron Spectroscopy (UPS): Use UPS to directly measure the work function and valence band maximum (VB) of your individual semiconductors and the formed heterostructure. The shift in the VB edge upon contact reveals the valence band offset (ΔE_V). [42]
- Photoluminescence (PL) Spectroscopy: Measure the exciton energies in the luminescence spectra of the individual materials and the heterostructure. The shifts in emission peaks can be used to calculate the band offsets. [41]
- First-Principles Calculations: Employ density-functional theory (DFT) calculations, specifically the macroscopic average method, to determine the potential difference (ΔVαβ) and valence band difference (δEV^α) at the interface from first principles. This is considered a highly accurate multiscale approach. [40]
Q3: My band alignment is correct, but performance is still poor. What related issue should I investigate? A: Investigate the presence of Schottky barriers at the interfaces between your semiconductors and charge extraction layers. A misalignment, even with a correct heterojunction type, can create energy cliffs or spikes that block electron or hole transfer, leading to recombination at the interface and a significant V_OC deficit. [42]
Table 1: Troubleshooting Band Alignment Issues
| Observed Symptom | Potential Root Cause | Corrective Action |
|---|---|---|
| Low Open-Circuit Voltage (V_OC) | Type-II alignment reducing redox potentials | Redesign as an S-scheme heterojunction [39] |
| Mismatch between predicted and measured band offsets | Over-reliance on Anderson's rule | Use UPS or DFT calculations for accurate alignment [40] [41] [42] |
| Poor charge extraction despite good absorption | Schottky barriers at extraction layer interfaces | Engineer a gradient electron transport layer to eliminate energy cliffs [42] |
Guide 2: Improving Heterojunction Interface Quality
Problem: High charge recombination at the heterojunction interface due to defects, poor lattice matching, or inefficient interlayer contact.
Q4: What are the primary sources of interfacial defects, and how can I minimize them during synthesis? A: Defects arise from dangling bonds at crystallographic peaks and valleys on textured surfaces, lattice mismatch between the two semiconductors, and ion bombardment damage during deposition processes like PECVD. [43] To minimize them:
- Surface Planarization: For critical interfaces, implement rear-side polishing. A polished (002) surface offers a lower density of defect states (D_it) compared to a textured (111) pyramid surface, providing a cleaner surface for high-quality film deposition. [43]
- Gentle Deposition Techniques: Optimize PECVD processes. Using a 13 MHz RF nucleation layer before a high-power VHF-PECVD step can suppress damage to the underlying intrinsic layer, enabling fast nanocrystalline formation without creating porous, defective structures. [43]
Q5: My heterojunction has a high density of interfacial defects. How can I quantify this and its impact? A: Characterize the interface using:
- High-Resolution Transmission Electron Microscopy (HRTEM): HRTEM can visually reveal the crystallographic quality, layer uniformity, and the presence of disordered regions at the interface. Compare growth on textured vs. planarized surfaces to see the improvement in columnar nanocrystalline structure. [43]
- Surface Recombination Current Density (J0): A high J0 value, measured via photoconductance decay, directly indicates poor passivation and high interfacial recombination. A state-of-the-art J01 value is close to 1 fA/cm². [43]
Q6: Beyond material choice, what physical mechanism can I use to force charge separation at the interface? A: Implement electron spin control. By inducing spin polarization in your photocatalyst through doping, defect engineering, or applying an external magnetic field, you can promote the separation of photogenerated electrons and holes. Spin polarization can reduce bulk and surface recombination by altering the spin states of the charge carriers, thereby strengthening the interaction with reactants and improving surface reaction kinetics. [44]
Table 2: Quantifying and Improving Interface Quality
| Parameter to Measure | Technique/Method | Target Value / Ideal Outcome |
|---|---|---|
| Interfacial Defect Density (D_it) | Capacitance-Voltage (C-V) profiling | As low as possible; minimized on polished (002) surfaces [43] |
| Surface Recombination (J0) | Sinton FCT-660 tester (Photoconductance decay) | J01 ~ 1 fA/cm² (practical limit) [43] |
| Crystallographic Interface Quality | HRTEM | Uniform, columnar nanocrystalline structure without isolated clusters [43] |
| Charge Separation Efficiency | Transient Absorption Spectroscopy | Enhanced by strategies like electron spin control [44] |
Frequently Asked Questions (FAQs)
Q1: What are the main energy loss pathways in a heterojunction photocatalyst, and which should I tackle first? A: Losses are categorized as: 1) External (light reflection/scattering), 2) Internal (carrier recombination, thermalization), and 3) Backward Reactions (product recombination). For heterojunction design, internal losses from charge recombination are the primary addressable target. Focus first on optimizing band alignment and interface quality to ensure photogenerated electrons and holes are separated quickly and efficiently before they can recombine. [39]
Q2: What is the fundamental difference between Type-II and S-scheme heterojunctions? A: While both achieve spatial charge separation, their thermodynamic outcomes differ radically. In a Type-II heterojunction, electrons and holes migrate to lower-energy bands, which often sacrifices redox power for the sake of separation. An S-scheme heterojunction is composed of a reduction photocatalyst (RP) and an oxidation photocatalyst (OP). Upon contact, an internal electric field (IEF) forms. Under light, carriers with weak redox ability recombine at the interface, while carriers with strong redox ability are preserved and spatially separated, thus maintaining the maximum redox potential of the system. [39]
Q3: Can I use machine learning in heterojunction design? A: Yes. Artificial intelligence and machine learning are being applied to the design and selection of novel photocatalysts. These tools can help predict band gaps, band alignment, and other key electronic properties from material composition and structure, accelerating the discovery of optimal heterojunction pairs for specific energy and environmental applications. [45]
The Scientist's Toolkit: Research Reagent Solutions
Table 3: Essential Materials for Advanced Heterojunction Fabrication and Analysis
| Reagent / Material | Function in Heterojunction Research |
|---|---|
| Nanocrystalline Silicon (ncSi) | Serves as a superior passivation and contact layer in silicon heterojunctions, enabling very low surface recombination and high open-circuit voltages. [43] |
| Magnesium-doped Tin Dioxide (Mg-SnO2) QDs | Used to construct gradient electron transport layers (ETLs). Mg doping raises the Fermi level, suppresses defects, and enhances conductivity, eliminating Schottky barriers for improved electron extraction. [42] |
| VHF-PECVD Reactor | Enables high-rate, low-temperature deposition of high-quality nanocrystalline silicon films, which is critical for scalable manufacturing of high-efficiency heterojunction devices. [43] |
| Intrinsic Amorphous Silicon (a-Si) | Acts as an outstanding passivation layer in silicon heterojunctions, effectively reducing interface defect states. [43] |
| Dinex |
Experimental Protocols & Visualization
Protocol 1: Constructing a Gradient Electron Transport Layer
Objective: To fabricate a TiO2/Mg-SnO2 QDs bilayer ETL for minimizing voltage loss in planar perovskite solar cells. [42]
- Substrate Preparation: Clean FTO glass sequentially in detergent, deionized water, acetone, and ethanol under ultrasonication for 15 minutes each. Dry under nitrogen stream and treat with UV-ozone for 15 minutes.
- TiO2 Layer Deposition: Spin-coat a compact TiO2 precursor solution (e.g., titanium isopropoxide in ethanol) onto the FTO substrate at 3000 rpm for 30 s. Anneal at 150°C for 10 minutes, then sinter at 500°C for 45 minutes.
- Mg-SnO2 QDs Layer Deposition: Synthesize Mg-SnO2 QDs via a hydrothermal method. Spin-coat a dispersion of the QDs in ethanol onto the TiO2 layer at 4000 rpm for 30 s. Anneal at 150°C for 30 minutes to form a dense, modified layer.
- Validation: Characterize the work function of the resulting ETL stack using UV Photoelectron Spectroscopy (UPS) to confirm the elimination of the energy cliff and the creation of a favorable gradient energy level alignment. [42]
Protocol 2: Implementing Rear-Side Polishing for Superior Interface Passivation
Objective: To create a planarized silicon surface for depositing high-quality silicon heterojunction layers with ultra-low interface recombination. [43]
- Masking: Deposit a silicon nitride (SiNx) layer as a protective mask on the front side of the textured silicon wafer.
- Wet Etching: Immerse the wafer in a 6 wt% alkaline solution (e.g., KOH) stabilized at 70°C. Etch for an optimized time (e.g., 110 seconds) to transition the rear surface from textured (111) pyramids to a mixed facet structure with a high planar fraction (fp > 90%).
- Characterization: Measure the characteristic angle and planar fraction (fp) of the etched surface using techniques like atomic force microscopy (AFM) or scanning electron microscopy (SEM).
- Layer Deposition: Remove the SiNx mask. Use a progressive PECVD process (starting with an RF nucleation layer) to deposit intrinsic a-Si and doped ncSi layers on the polished rear surface.
- Validation: Use HRTEM to confirm the formation of uniform, columnar ncSi structures on the planarized surface. Measure the surface recombination current density (J0) with a Sinton FCT-650 tester to verify superior passivation. [43]
Heterojunction Charge Transfer Mechanisms
Diagram 1: Charge transfer mechanics in Type-II vs. S-Scheme heterojunctions. The S-Scheme selectively recombines less useful carriers, preserving the strongest redox potentials. [39]
Advanced Electron Extraction Layer Design
Diagram 2: Gradient electron energy level strategy for efficient charge extraction, eliminating Schottky barriers. [42]
Core Concepts: Defects and Stability
What is the fundamental relationship between defect concentration and photocatalytic stability? Defects, particularly oxygen vacancies, enhance photocatalytic activity by creating active sites, improving visible light absorption, and facilitating charge separation. However, an optimal concentration exists; exceeding this threshold accelerates electron-hole recombination and destabilizes the catalyst structure, leading to rapid deactivation. [4] [46]
How do defects introduced via different methods affect long-term stability? The method of defect creation significantly impacts stability. Defects from base treatment (e.g., in ZrOâ‚‚) generate stable oxygen vacancies that maintain activity over multiple cycles, while metal ion doping can create less stable defect structures that may poison the catalyst over time. [46]
Troubleshooting Guides
Problem 1: Rapid Catalyst Deactivation
Observed Symptom: Significant performance drop (>30% activity loss) within the first 3 reaction cycles.
| Possible Cause | Diagnostic Tests | Solution |
|---|---|---|
| Excessive defect density | XPS analysis of ZrOx/ZrO2 ratio; EELS mapping | Reduce reduction temperature/time; optimize dopant concentration [4] [46] |
| Unstable defect structure | Recyclability testing (5+ cycles); in situ XPS | Switch from metal doping to base treatment methods [46] |
| Surface poisoning | FT-IR analysis of surface groups; TGA-MS | Implement intermediate calcination (300-400°C) between cycles [4] |
Experimental Protocol for Diagnosis:
- Collect used catalyst by centrifugation (8000 rpm, 10 min)
- Wash三次 with deionized water and dry at 80°C for 2 hours
- Analyze surface composition via HR-XPS, focusing on Zr 3d and O 1s regions
- Calculate the ZrOx/ZrO2 peak intensity ratio - values >0.175 indicate potentially unstable defects [46]
Problem 2: Declining Charge Separation Efficiency
Observed Symptom: Increasing photoluminescence intensity and decreasing photocurrent response.
| Quantitative Indicator | Acceptable Range | Critical Range | Intervention |
|---|---|---|---|
| PL intensity increase | <15% over 5 cycles | >30% over 5 cycles | Optimize reduction temperature to 400°C [4] |
| Photocurrent decay | <20% over 5 cycles | >40% over 5 cycles | Introduce cocatalysts for electron extraction |
| Nyquist plot radius | <25% increase | >50% increase | Form heterojunctions for spatial charge separation [47] |
Characterization Workflow: The diagnostic pathway for charge separation issues follows a logical sequence, as shown in the diagram below.
Problem 3: Inconsistent Defect Reproduction
Observed Symptom: Variable photocatalytic performance between batches using identical synthesis parameters.
| Controlled Parameter | Optimal Range | Effect on Defect Density | Stability Impact |
|---|---|---|---|
| Reduction temperature | 375-425°C | Directly controls oxygen vacancy concentration | Maximum stability at 400°C [4] |
| Base concentration | 0.1-1.0 M | Determines surface hydroxyl group density | Higher concentrations yield more stable defects [46] |
| Annealing time | 1-4 hours | Affects defect crystallization | 2 hours optimal for homogeneous distribution [4] |
Standardized Protocol for Defect Introduction via Base Treatment:
- Disperse 500 mg of pristine catalyst in 100 mL of 0.5 M NaOH solution
- Stir continuously at 400 rpm for 12 hours at room temperature
- Centrifuge at 10,000 rpm for 15 minutes and wash until neutral pH
- Dry at 80°C for 6 hours followed by annealing at 400°C for 2 hours
- Characterize defect density using Raman spectroscopy (red-shift confirmation) and XPS [46]
Frequently Asked Questions
Q1: What is the most reliable method to quantify defect concentration in photocatalysts? Combine multiple characterization techniques: use XPS to measure the ZrOx/ZrO2 ratio (target ~0.175 for stability), employ Raman spectroscopy to identify red-shifted peaks indicating oxygen vacancies, and utilize STEM-EELS for direct visualization of defect sites. Cross-verification provides the most reliable quantification. [46]
Q2: How can I determine if my catalyst has exceeded the optimal defect concentration? Monitor these warning signs: (1) activity decreases after initial peak despite increasing defect density, (2) photoluminescence intensity increases by >30%, (3) recyclability tests show >40% performance loss within 3 cycles, and (4) XPS shows ZrOx/ZrO2 ratio >0.2. [4] [46]
Q3: Which defect engineering method provides the best balance between activity and stability? Base treatment generally produces more stable defects than metal doping. In direct comparisons, base-treated ZrOâ‚‚ maintained activity over 5 cycles (15 hours), while Cr-ion doped counterparts showed faster deactivation. Base treatment creates oxygen vacancies that actively participate in charge separation without introducing foreign ions that may act as recombination centers. [46]
Q4: What are the key indicators of successful defect engineering in photocatalysts? The optimal defect-modified catalyst should show: (1) 150+ μmol·gâ»Â¹Â·hâ»Â¹ nitrogen fixation rate or comparable activity metrics, (2) >99% organic pollutant degradation within 30-150 minutes, (3) maintained performance over ≥5 consecutive cycles, and (4) enhanced visible light absorption with minimal charge recombination. [4] [1] [46]
Experimental Protocols
Defect Engineering via Controlled Reduction
Materials Synthesis:
- Synthesize pristine Laâ‚‚TiOâ‚… using sol-gel method with stoichiometric La and Ti precursors
- Divide material into equal batches for reduction treatment
- Heat batches at different temperatures (375°C, 400°C, 425°C) for 2 hours under 5% H₂/Ar atmosphere
- Characterize resulting materials (LTO-375, LTO-400, LTO-425) for comparative analysis [4]
Performance Evaluation:
- Conduct photocatalytic nitrogen fixation under simulated sunlight
- Measure ammonia production rate using indophenol blue method
- Perform recyclability tests by recovering catalyst after each cycle (centrifugation, washing, drying)
- The optimal sample (LTO-400) achieves 158.13 μmol·gâ»Â¹Â·hâ»Â¹ nitrogen fixation rate with excellent stability [4]
Stability Assessment Protocol
Accelerated Testing Method:
- Run consecutive photocatalytic cycles (4-CP degradation recommended)
- After each cycle, recover catalyst by centrifugation (10,000 rpm, 10 min)
- Wash with deionized water and dry at 80°C for 1 hour
- Reuse with fresh pollutant solution
- Monitor performance decay - acceptable: <20% over 5 cycles; critical: >40% over 5 cycles [46]
Post-Stability Characterization:
- Analyze used catalyst by XPS to monitor defect state changes
- Perform STEM-EELS to visualize defect structure stability
- Conduct XRD to confirm crystal structure maintenance
- Optimal catalysts show minimal changes in all characterization after cycling [46]
The Scientist's Toolkit
Research Reagent Solutions
| Essential Material | Function in Defect Engineering | Application Example |
|---|---|---|
| NaOH solution (0.1-1.0 M) | Base treatment for oxygen vacancy creation | Generating stable surface defects in ZrOâ‚‚ nanoparticles [46] |
| H₂/Ar reducing atmosphere | Controlled reduction for defect formation | Creating oxygen vacancies in La₂TiO₅ at 400°C [4] |
| Cr³⺠doping precursors | Metal ion doping for defect creation | Comparative studies of defect generation methods [46] |
| 4-Chlorophenol solution | Standardized pollutant for stability testing | Assessing photocatalytic durability over multiple cycles [46] |
| Benzoic acid reagent | Hydroxyl radical trapping agent | Quantifying ·OH production capacity of defective catalysts [46] |
Characterization Techniques for Defect Analysis
| Technique | Information Obtained | Optimal Parameters |
|---|---|---|
| HR-XPS | ZrOx/ZrO2 ratio, oxygen vacancy quantification | Monitor Zr 3d (182.8 eV) and ZrOx (180.2 eV) peaks [46] |
| STEM-EELS | Direct visualization of defect sites | Atomic resolution mapping of oxygen-deficient regions [46] |
| In situ XPS | Electronic structure changes under reaction conditions | Real-time monitoring of defect behavior during catalysis [46] |
| Photoluminescence | Charge carrier recombination rates | Decreasing intensity indicates suppressed recombination [4] |
| Raman spectroscopy | Structural defects through peak shifts | Red-shifted peaks confirm oxygen vacancy formation [46] |
Frequently Asked Questions (FAQs)
Q1: Why are operational parameters like pH, temperature, and light intensity so critical in photocatalytic experiments? These parameters directly control the efficiency of the photocatalytic process by influencing the catalyst's surface charge, the rate of electron-hole pair generation, and the kinetics of the chemical reactions. More specifically, they are fundamental tools for minimizing electron-hole recombination, which is the primary cause of efficiency loss in photocatalysis. Optimizing these parameters enhances the separation of photogenerated charge carriers, thereby increasing the production of Reactive Oxygen Species (ROS) essential for degrading pollutants [48] [1].
Q2: How does pH specifically affect electron-hole recombination? The pH of the solution determines the surface charge of the photocatalyst, which is defined by its Point of Zero Charge (PZC) [48].
- Below the PZC: The catalyst surface is positively charged, which favors the adsorption of anionic pollutants and can attract the electrons (e-) to some degree, influencing charge separation.
- Above the PZC: The catalyst surface is negatively charged, favoring the adsorption of cationic pollutants. This electrostatic environment affects the interaction with water and hydroxyl ions, which are the source of holes (h+) for generating hydroxyl radicals (•OH). An optimal pH maximizes the adsorption of target pollutants and reactants, facilitating faster consumption of electrons and holes and reducing their chance to recombine [48].
Q3: Can temperature alone prevent electron-hole recombination? While temperature does not directly prevent recombination, it significantly influences the reaction kinetics. Moderate temperatures accelerate the reaction rates at the catalyst surface, meaning photogenerated electrons and holes are consumed more quickly in redox reactions. This rapid consumption reduces their lifetime and, consequently, their probability of recombining. However, excessively high temperatures can be detrimental, as they may degrade the photocatalyst and shorten the lifetime of the reactive species [48].
Q4: What is the relationship between light intensity and the rate of recombination? Higher light intensity increases the population of photogenerated electron-hole pairs. While this can boost the reaction rate, it also raises the local concentration of both charge carriers, potentially increasing the recombination rate. The key is that the effect of intensity is often sub-linear. The benefits of increased charge carrier generation can be fully realized only if the catalyst's design (e.g., through heterojunctions or doping) and the operational parameters are optimized to ensure efficient charge separation and rapid surface reaction kinetics [48].
Troubleshooting Guides
Issue 1: Low Pollutant Degradation Efficiency
Potential Cause: Sub-optimal pH leading to poor pollutant adsorption and rapid electron-hole recombination.
Solutions:
- Determine the PZC: Identify the Point of Zero Charge for your photocatalyst. This is a fundamental property you can find in the material's characterization data or related literature.
- Adjust Solution pH:
- If degrading a cationic pollutant (e.g., Methylene Blue), set the solution pH to a value above the catalyst's PZC to ensure the surface is negatively charged and attracts the pollutant [48].
- If degrading an anionic pollutant, set the pH to a value below the PZC to create a positively charged catalyst surface [48].
- Monitor pH Effects: Remember that pH also affects the generation of ROS. Lower pH generally favors the production of hydroxyl radicals (•OH), which are powerful oxidants [48].
Issue 2: Inconsistent Reaction Rates and Low ROS Production
Potential Cause: Incorrect temperature or light intensity settings, leading to inefficient carrier utilization.
Solutions:
- Optimize Temperature:
- Avoid very low temperatures (< 0°C), which slow down reaction kinetics [48].
- Operate at moderate, controlled room temperature or slightly above to enhance charge carrier mobility and surface reaction rates.
- Ensure the reaction temperature does not exceed the thermal stability limit of your photocatalyst.
- Calibrate Light Intensity:
- Use a light meter to quantify and standardize the intensity reaching the reaction mixture.
- If the reaction rate does not scale with intensity, it indicates a dominance of recombination processes. Consider engineering your catalyst (e.g., creating heterojunctions) to improve intrinsic charge separation [49] [1].
Issue 3: Poor Catalyst Stability and Deactivation Over Cycles
Potential Cause: Operational stress from extreme pH, high temperature, or intense light.
Solutions:
- Check pH Stability: Perform post-reaction characterization (e.g., XRD) to check for catalyst dissolution or structural changes, especially after use in highly acidic or alkaline conditions [48].
- Control Thermal Stress: For long-term or cyclic experiments, use a temperature-controlled water bath to prevent local overheating from the light source.
- Mitigate Photocorrosion: For non-oxide semiconductors, use sacrificial agents or operate at a mild pH to reduce light-induced degradation. Oxide semiconductors (e.g., TiOâ‚‚, ZnO) are generally more stable under illumination [48].
The following tables consolidate key quantitative data and effects from the literature to guide experimental design.
Table 1: Summary of Parameter Effects on Photocatalytic Processes
| Parameter | Optimal Range / Condition | Primary Effect on Recombination | Impact on ROS Generation |
|---|---|---|---|
| pH | Dependent on catalyst PZC & pollutant type [48] | Controls surface charge and pollutant adsorption, influencing carrier consumption rates. | Lower pH generally favors •OH production [48]. |
| Temperature | Moderate (e.g., room temp to ~50°C) [48] | Higher kinetics consume carriers faster, reducing recombination probability. | Excessive heat can degrade ROS [48]. |
| Light Intensity | System-dependent; often sub-linear effect [48] | Higher intensity generates more e-/h+ pairs, but can increase recombination without proper catalyst design. | Increases ROS generation potential, but efficiency depends on charge separation. |
Table 2: Exemplary Performance of Optimized Photocatalytic Systems
| Photocatalyst System | Target Pollutant/Reaction | Key Operational Parameters | Degradation/Performance Outcome | Reference Context |
|---|---|---|---|---|
| Pd/TiOâ‚‚ | Hâ‚‚Oâ‚‚ Evolution + Furfural Oxidation | Simulated sunlight (AM 1.5 G) [50] | Hâ‚‚Oâ‚‚ rate: 3672.31 μM hâ»Â¹; Furoic acid rate: 4529.08 μM hâ»Â¹ [50] | [50] |
| TiOâ‚‚/C-550 | Methylene Blue (MB) | Visible/UV light [1] | >99% degradation in 30-150 min [1] | [1] |
| WSâ‚‚/GO/Au | Methylene Blue (MB) | Visible/UV light [1] | >99% degradation [1] | [1] |
Experimental Protocols
Protocol 1: Standardized Procedure for Determining Optimal pH
- Preparation: Prepare a stock solution of the target pollutant at a standard concentration (e.g., 10 mg/L).
- pH Adjustment: Divide the solution into several equal-volume samples. Adjust each sample to a different pH value (e.g., 3, 5, 7, 9, 11) using dilute NaOH or HNO₃.
- Catalyst Addition: Add a fixed, known mass of the photocatalyst to each sample.
- Equilibration: Stir the mixtures in the dark for 30-60 minutes to establish adsorption-desorption equilibrium.
- Irradiation: Expose all samples to the same light source (consistent intensity and wavelength) for a fixed duration.
- Analysis: Withdraw samples at regular intervals, centrifuge to remove catalyst, and analyze the supernatant (e.g., via UV-Vis spectrophotometry) to determine pollutant concentration.
- Calculation: Plot degradation efficiency (%) versus pH to identify the optimal condition [48].
Protocol 2: Methodology for Evaluating Light Intensity Dependence
- Setup: Set up the photoreactor with a variable power light source (e.g., a LED array with a dimmable power supply).
- Calibration: Use a calibrated light meter to measure the intensity (mW/cm²) at the reaction vessel for different power settings.
- Experimental Run: Using the optimal pH and catalyst load from previous tests, run identical photocatalytic experiments at different light intensities (Iâ‚, Iâ‚‚, I₃...).
- Kinetic Analysis: Determine the apparent reaction rate constant (k) for each intensity from the degradation kinetics.
- Relationship Modeling: Plot the reaction rate (or k) versus light intensity. The relationship often follows a power law (Rate ∠Iâ¿), where
nindicates the dependence and can reveal the extent of recombination; annvalue significantly less than 1 suggests that recombination is becoming dominant [48].
Parameter Optimization Workflow
The following diagram outlines a logical workflow for systematically optimizing operational parameters to minimize electron-hole recombination.
The Scientist's Toolkit: Essential Research Reagents & Materials
Table 3: Key Reagent Solutions for Photocatalysis Experiments
| Item | Function / Purpose | Example Use Case |
|---|---|---|
| pH Buffers | To maintain a constant and precise pH environment throughout the experiment. | Crucial for studying the specific effect of pH on degradation kinetics without drift [48]. |
| Sacrificial Reagents | To selectively consume either photogenerated electrons or holes, helping to quantify the contribution of each carrier. | Isopropanol (hole scavenger), Ammonium Oxalate (electron scavenger); used in mechanistic studies. |
| ROS Scavengers | To identify which reactive oxygen species is primarily responsible for degradation. | Tert-Butanol (scavenges •OH), Benzoquinone (scavenges •Oâ‚‚â»), Sodium Azide (scavenges ¹Oâ‚‚) [1]. |
| Calibrated Light Source | To provide consistent, reproducible, and quantifiable irradiation. | LED arrays with specific wavelengths; solar simulators (e.g., AM 1.5 G) [50]. |
| Standard Pollutant Solutions | To provide a consistent and measurable target for degradation assays. | Methylene Blue (MB), Rhodamine B, or specific pharmaceuticals/POPS [49] [1]. |
Mitigating Photo corrosion and Ensuring Long-Term Catalyst Stability
Frequently Asked Questions (FAQs)
FAQ 1: What is the fundamental connection between electron-hole recombination and photocorrosion? Photocorrosion is fundamentally a destructive oxidation or reduction reaction that degrades the photocatalyst itself. It is exacerbated by the rapid recombination of photogenerated electron-hole pairs. When these charge carriers recombine instead of participating in the desired surface reactions (like water splitting), the energy is released as heat or light, wasting the photon's energy [45]. More critically, this recombination limits the availability of holes for the water oxidation reaction. Consequently, photogenerated holes accumulate and can directly oxidize the semiconductor lattice (e.g., converting Cuâ‚‚O to CuO or ZnO to Zn²âº), leading to its decomposition [51] [52]. Therefore, strategies that mitigate recombination directly enhance stability by productively channeling holes away from the catalyst lattice.
FAQ 2: Beyond noble metals, what are effective and affordable cocatalysts for stability? Research has identified several low-cost and effective alternative cocatalysts. Transition metal sulfides, such as Cu₇S₄, have shown great promise. When coated onto a photocatalyst like Cu₂O, Cu₇S₄ acts as a cocatalyst that enhances electron transfer, prolongs hole lifetime, and suppresses recombination, thereby improving both activity and stability [53]. Another category is carbon-based materials, which are emerging as excellent cocatalysts for hole extraction. Their high conductivity and tunable surface properties facilitate the separation of charges, protecting the host photocatalyst from corrosive holes [52].
FAQ 3: How do heterojunctions like Type II and Z-scheme systems improve catalyst longevity? Heterojunctions physically separate photogenerated electrons and holes, which is key to enhancing stability.
- Type II Heterojunction: In a system like ZnO/TiOâ‚‚, the conduction band (CB) and valence band (VB) positions are staggered. Electrons migrate to the TiOâ‚‚ CB, while holes move to the ZnO VB. This spatial separation significantly reduces the bulk recombination rate, increasing the number of productive charges and reducing destructive ones [23].
- Z-Scheme System: This system more directly addresses hole accumulation. In a Z-scheme like CdO/TiOâ‚‚, photogenerated electrons in the CdO CB recombine with photogenerated holes in the TiOâ‚‚ VB. This process effectively "extinguishes" the most corrosive holes within the main photocatalyst (TiOâ‚‚), leaving highly reactive electrons in the CdO for reduction reactions. This mechanism protects the primary photocatalyst from hole-induced damage [23].
FAQ 4: Can you list common hole sacrificial agents and their trade-offs? Yes, the following table summarizes common hole sacrificial agents used in experimental setups.
Table 1: Common Hole Sacrificial Agents and Their Characteristics
| Sacrificial Agent | Chemical Formula | Primary Function | Advantages | Disadvantages |
|---|---|---|---|---|
| Sodium Sulfite/Sulfide | Na₂SO₃ / Na₂S | Efficiently consumes holes, forming sulfate | Drastically improves H₂ evolution yield | Can cause secondary pollution; not sustainable [53] [52] |
| Triethanolamine | (HOCH₂CH₂)₃N | Organic hole scavenger | Effective for probing H₂ evolution activity | Expensive; creates chemical waste [52] |
| Hydrogen Peroxide | Hâ‚‚Oâ‚‚ | Scavenges holes and electrons | Can lower reaction overpotential | Decomposes readily; can be consumed in side reactions [52] |
| Methanol / Ethanol | CH₃OH / CH₃CH₂OH | Organic hole scavenger | Low cost, readily available | Low efficiency; can lead to over-oxidation products |
Troubleshooting Guides
Problem 1: Rapid Activity Loss in Metal Oxide Photocatalysts (e.g., ZnO, Cuâ‚‚O)
Symptoms: Photocatalytic hydrogen evolution rate drops significantly within the first few hours of operation. The catalyst solution may show visible discoloration or precipitate formation.
Underlying Cause: This is typically a classic sign of photocorrosion, where photogenerated holes oxidize the catalyst material itself instead of water [51]. For example, ZnO can corrode via the reaction: ZnO + 2h⺠→ Zn²⺠+ ½O₂.
Solutions:
- Construct a Core-Shell Heterostructure:
- Principle: Coating the unstable photocatalyst with a stable, conductive shell protects it from the electrolyte and facilitates charge extraction.
- Protocol: As demonstrated with Cu₂O nanocubes [53], a protective shell of Cu₇S₄ can be applied via an in-situ ion exchange method.
- Synthesize Cuâ‚‚O nanocubes (47 nm average size) as the core.
- Prepare an aqueous solution of Na₂S·9H₂O.
- Under constant stirring, add the Naâ‚‚S solution to the Cuâ‚‚O nanocube dispersion.
- Allow the reaction to proceed at room temperature for a specific duration to form a thin, conformal shell of Cu₇Sâ‚„. The resulting core-shell structure (Cuâ‚‚O/Cu₇Sâ‚„) showed a high hydrogen production rate of 1689.00 μmol gâ»Â¹ hâ»Â¹ with enhanced stability under full-spectrum light [53].
- Dope with Cations to Introduce Hole Traps:
- Principle: Doping introduces energy states that can temporarily trap holes, preventing them from reaching and reacting with the catalyst lattice.
- Protocol: Doping ZnO with metals like Al or Cd can modify its electronic structure.
- Use a sol-gel method. Dissolve a zinc precursor (e.g., zinc acetate dihydrate) and the dopant precursor (e.g., aluminum nitrate for Al-doping) in a solvent like ethanol.
- Add a chelating agent (e.g., citric acid) and stir to form a clear gel.
- Dry the gel and calcine it at temperatures between 400-600°C to form crystalline, doped ZnO nanoparticles.
- Characterization via XRD and UV-Vis is crucial to confirm doping and assess changes in the band gap [51].
Problem 2: Poor Performance and Deactivation in Visible Light Catalysts
Symptoms: The catalyst shows good initial activity under visible light but deactivates rapidly. Performance under full-spectrum light is better but still decays.
Underlying Cause: Many visible-light catalysts have narrow band gaps, which often correlates with higher innate electron-hole recombination rates and lower structural stability, making them susceptible to photocorrosion or chemical degradation [8].
Solutions:
- Create a Solid-State Z-Scheme Heterojunction:
- Principle: This system mimics natural photosynthesis, selectively recombining electrons from one semiconductor with holes from another, leaving the most energetic charges for reactions and protecting the catalysts.
- Protocol: Fabricating a TiOâ‚‚/CdO Z-scheme heterojunction [23].
- Synthesize TiOâ‚‚ nanoparticles via a sol-gel process using titanium (IV) isopropoxide.
- Dope the TiOâ‚‚ with CdO by incorporating cadmium acetate dihydrate into the sol-gel precursor solution.
- The mixture is gelled, dried, and calcined to form the composite.
- In this system, electrons in the TiOâ‚‚ CB recombine with holes in the CdO VB, leaving the highly reductive electrons in CdO for proton reduction and minimizing hole-induced damage to TiOâ‚‚ [23].
- Graft Electron-Withdrawing Functional Groups:
- Principle: For carbon nitride (g-C₃N₄) or covalent organic frameworks (COFs), modifying the molecular structure with strong electron-withdrawing groups (e.g., -NO₂) can pull electron density, which helps to spatially separate the electron-hole pairs upon photoexcitation.
- Protocol: Functionalizing g-C₃N₄ with p-nitrobenzaldehyde [54].
- Prepare bulk g-C₃N₄ by heating urea at 580°C.
- React the g-C₃N₄ with terephthalaldehyde in ethanol with acetic acid catalyst at 80°C to form an intermediate.
- Further react this intermediate with p-nitrobenzaldehyde to yield the final functionalized material (e.g., CN-306).
- DFT calculations can confirm the enhanced charge separation efficiency in the modified material [54].
Problem 3: Inconsistent Results When Using Sacrificial Agents
Symptoms: The measured hydrogen evolution rate is unstable or decreases unexpectedly, even with sacrificial agents present.
Underlying Cause: The sacrificial agent may be depleted, leading to a resurgence of recombination and photocorrosion. Alternatively, the oxidation products of the sacrificial agent might be adsorbing onto the catalyst's active sites, poisoning them [52].
Solutions:
- Monitor and Replenish Sacrificial Agents:
- Establish a protocol to periodically measure the concentration of the sacrificial agent (e.g., via titration or spectrometry) and replenish it as needed to maintain a constant concentration throughout the experiment.
- Switch to a More Robust Scavenger or Co-catalyst:
- If sulfite is causing issues, consider using a low concentration of Hâ‚‚Oâ‚‚, which has been shown to lower the onset potential for water oxidation on some photoanodes, reducing surface hole accumulation [52].
- The ultimate solution is to move away from sacrificial agents by loading a suitable OER cocatalyst (e.g., Cu₇S₄, carbon-based materials) that can efficiently extract holes for water oxidation, rendering sacrificial agents unnecessary [53] [52].
Experimental Protocols & Data Presentation
Detailed Protocol: Synthesis of Stable Core-Shell Cu₂O/Cu₇S₄ Nanocubes
This protocol is adapted from the method used to achieve a high hydrogen evolution rate of 1689.00 μmol gâ»Â¹ hâ»Â¹ [53].
1. Synthesis of Cu₂O Nanocube Cores: * Reagents: Copper(II) chloride dihydrate (CuCl₂·2H₂O), sodium hydroxide (NaOH), L-ascorbic acid (L-AA), ethanol. * Procedure: a. Dissolve 0.127 g of CuCl₂·2H₂O in 50 mL of deionized water. b. Add 5 mL of an aqueous NaOH solution (1.0 M) under magnetic stirring. c. Heat the mixture to 55°C. d. Quickly inject 5 mL of an aqueous L-AA solution (0.06 M) into the reaction flask. e. Maintain the reaction at 55°C for 3 hours with constant stirring. f. Centrifuge the resulting brick-red precipitate, and wash sequentially with deionized water and ethanol several times. g. Dry the obtained Cu₂O nanocubes in a vacuum oven at 60°C for 6 hours.
2. In-situ Formation of Cu₇S₄ Shell: * Reagents: As-synthesized Cu₂O nanocubes, Sodium sulfide nonahydrate (Na₂S·9H₂O). * Procedure: a. Disperse 20 mg of the synthesized Cu₂O nanocubes in 40 mL of deionized water via sonication. b. Prepare a 10 mL aqueous solution of Na₂S·9H₂O (2 mg/mL). c. Add the Na₂S solution dropwise to the Cu₂O dispersion under vigorous stirring. d. Allow the reaction to proceed at room temperature for 30 minutes. The color will change from brick-red to dark green or black, indicating the formation of the Cu₇S₄ shell. e. Collect the final Cu₂O/Cu₇S₄ product by centrifugation, wash with water and ethanol, and dry under vacuum.
Quantitative Performance of Stabilization Strategies
The following table consolidates performance data from various stabilization strategies reported in the literature, providing a benchmark for comparison.
Table 2: Performance Comparison of Photocatalyst Stabilization Strategies
| Photocatalyst System | Stabilization Strategy | Application | Performance Metric | Key Improvement |
|---|---|---|---|---|
| Cuâ‚‚O/Cu₇Sâ‚„ NCs [53] | Cocatalyst (Cu₇Sâ‚„) shell | Hâ‚‚ Evolution | 1689.00 μmol gâ»Â¹ hâ»Â¹ | 1.5x higher photocurrent density; prolonged hole lifetime |
| CN-306 COF [54] | Molecular engineering (electron-withdrawing group) | Hâ‚‚Oâ‚‚ Production | 5352 μmol gâ»Â¹ hâ»Â¹ | Enhanced electron-hole separation; 7.27% surface quantum efficiency |
| BiVOâ‚„/N:NiFeOx [52] | Heteroatom doping (N) & cocatalyst | Water Oxidation | Photocurrent density: 6.4 mA cmâ»Â² | Electronic reconfiguration for efficient hole transfer |
| Ag/CdO/ZnO-TiOâ‚‚ [23] | Ternary doping (Schottky, Z-scheme, Type II) | Water Splitting | Superior to many functional materials | Synergistic effect to counter electron-hole recombination |
Diagrams and Workflows
Photocatalyst Stabilization Mechanisms
Experimental Workflow for Catalyst Stability Testing
The Scientist's Toolkit: Research Reagent Solutions
Table 3: Essential Reagents for Photocatalyst Synthesis and Stabilization
| Reagent / Material | Function in Research | Example Application |
|---|---|---|
| Copper(II) Chloride Dihydrate (CuCl₂·2H₂O) | Precursor for synthesizing Cu-based photocatalyst cores (e.g., Cu₂O nanocubes) [53]. | Core material for Cu₂O/Cu₇S₄ core-shell structures [53]. |
| Sodium Sulfide Nonahydrate (Na₂S·9H₂O) | Sulfur source for in-situ formation of metal sulfide cocatalysts or protective shells [53]. | Forming a Cu₇S₄ shell on Cu₂O to enhance charge separation and stability [53]. |
| Titanium(IV) Isopropoxide (Ti(OCH(CH₃)₂)₄) | Common metal-organic precursor for the sol-gel synthesis of TiO₂ nanoparticles [23]. | Host material for creating doped TiO₂ systems (e.g., with Ag, CdO, ZnO) [23]. |
| Silver Nitrate (AgNO₃) | Source of silver ions for creating Schottky barriers on semiconductors to trap electrons [23]. | Doping TiO₂ to form metal-semiconductor junctions that suppress charge recombination [23]. |
| Cadmium Acetate Dihydrate (Cd(CH₃COO)₂·2H₂O) | Precursor for cadmium oxide, used to construct Z-scheme photocatalytic systems [23]. | Doping TiO₂ to create a Z-scheme heterojunction for enhanced charge separation [23]. |
| Zinc Acetate Dihydrate (Zn(CH₃COO)₂·2H₂O) | Precursor for zinc oxide, used to form Type II heterojunctions with other metal oxides [23]. | Doping TiO₂ to create a staggered band alignment (Type II) for charge separation [23]. |
| p-Nitrobenzaldehyde | Organic molecule with a strong electron-withdrawing group for molecular-level engineering of COFs/g-C₃N₄ [54]. | Functionalizing covalent organic frameworks (CN-306) to redistribute electron density and improve charge separation [54]. |
| Sodium Sulfite (Na₂SO₃) | Common hole sacrificial agent; rapidly consumes photogenerated holes to protect the catalyst [53] [52]. | Used in activity tests to probe maximum H₂ evolution potential by suppressing recombination and corrosion [53]. |
Addressing Scalability and Cost-Effectiveness for Practical Deployment
Frequently Asked Questions (FAQs)
Q1: What is electron-hole recombination and why is it a critical issue in photocatalytic applications?
Electron-hole recombination is the process by which photo-generated electrons in the conduction band and holes in the valence band recombine, annihilating each other and releasing energy [55] [56]. This is a fundamental challenge in photocatalysis because when these charge carriers recombine instead of migrating to the catalyst surface, they cannot participate in the desired chemical reactions (e.g., pollutant degradation, water splitting) [47]. This significantly reduces the overall quantum efficiency and practical performance of the photocatalytic process, hindering its large-scale deployment [47] [57].
Q2: What are the different types of recombination mechanisms I might encounter in my experiments?
The primary recombination mechanisms are:
- Radiative Recombination (Band-to-Band): An electron directly transitions from the conduction band to the valence band, releasing the energy as a photon. This is common in direct bandgap semiconductors with low defect concentrations [55] [56].
- Non-Radiative Recombination: The recombination energy is released as heat (phonons) rather than light. The main types are:
- Shockley-Read-Hall (SRH) Recombination: Occurs via defect levels (traps) within the band gap, introduced by impurities or crystal imperfections [55] [56].
- Auger Recombination: The energy from recombination is transferred to a third charge carrier (another electron or hole), which gets excited to a higher energy level before relaxing and releasing heat [56] [3].
Q3: My photocatalytic material shows high activity in the lab but is costly to synthesize. How can I make the process more cost-effective for larger-scale applications?
A key strategy is implementing catalyst recovery and recycling systems. The high cost of some photocatalysts can hamper industrial interest [58]. A promising approach is to combine a continuous-flow photoreactor with an integrated nanofiltration unit designed for catalyst recovery [58]. Research has demonstrated that this setup can achieve catalyst recycling rates of over 99%, drastically reducing consumption and increasing the catalyst's turnover number (TON) to well over 8,000, which improves the process viability [58].
Q4: Which characterization techniques are essential for diagnosing recombination problems in a newly synthesized photocatalyst?
A thorough characterization is crucial for linking material properties to performance [57]. Key techniques include:
- Photoluminescence (PL) Spectroscopy: Directly probes the recombination of electron-hole pairs. A high PL intensity often indicates high radiative recombination, which can be undesirable for catalysis, while quenching of the PL signal suggests successful separation of charge carriers [11] [57].
- Diffuse Reflectance UV-Visible Spectroscopy (DRUVS): Used to determine the optical bandgap of the semiconductor via a Tauc plot, which is critical for understanding light absorption [57].
- Electrochemical Impedance Spectroscopy (EIS): Provides information on the charge transfer resistance at the interface. A smaller arc in a Nyquist plot typically indicates more efficient charge separation and a lower recombination rate [11].
- X-ray Photoelectron Spectroscopy (XPS): Reveals the surface elemental composition and chemical states, which can identify defects or surface modifications that act as recombination centers [57].
Troubleshooting Guides
Problem 1: Low Photocatalytic Efficiency
| Symptom | Possible Cause | Diagnostic Experiments | Proposed Solution |
|---|---|---|---|
| Low reaction rate or conversion under optimal light. | High charge carrier recombination due to bulk/surface defects. | Perform PL spectroscopy; a strong emission signal suggests high recombination [11] [57]. | Engineer heterojunctions (e.g., Z-scheme) to separate electrons and holes [11]. Apply surface passivation to tie up unbound bonds that act as traps [3]. |
| Inefficient light absorption. | Collect DRUVS data and construct a Tauc plot to determine the actual bandgap [57]. | Modify the catalyst's composition to tailor the bandgap for visible light absorption [47]. | |
| Poor charge transport to the surface. | Perform EIS; a large arc radius indicates high charge transfer resistance [11]. | Decorate the catalyst on a high-surface-area support to reduce migration distance for charges [47] [11]. |
Problem 2: Poor Catalyst Stability and Reusability
| Symptom | Possible Cause | Diagnostic Experiments | Proposed Solution |
|---|---|---|---|
| Activity drops significantly after few cycles. | Photocorrosion or chemical dissolution. | Use Inductively Coupled Plasma (ICP) spectroscopy on the reaction solution to detect leached metal ions [57]. | Consider a core-shell structure or use more stable, metal-free catalysts like g-C(3)N(4) [11]. |
| Active site poisoning by reactants or products. | Perform XPS on the used catalyst to identify strong adsorption of foreign species on the surface [57]. | Introduce a thermal or washing regeneration step between cycles. Optimize reaction conditions to prevent by-product formation. | |
| Physical loss of catalyst during recovery. | Weigh the catalyst mass recovered after a batch cycle. | Switch to a continuous-flow system with an integrated nanofiltration membrane for near-total catalyst recovery (>99%) [58]. |
Problem 3: Irreproducible Experimental Results
| Symptom | Possible Cause | Diagnostic Experiments | Proposed Solution |
|---|---|---|---|
| Large performance variance between identical experiments. | Inconsistent light source intensity or spectrum. | Use a calibrated radiometer to measure the photon flux at the reactor window for every experiment [57]. | Use a power-stabilized light source and document its operating hours. Regularly clean the reactor window and light enclosure. |
| Poor control of catalyst concentration or mixing. | Systematically study the reaction rate as a function of catalyst concentration to find the optimum [57]. | Standardize catalyst dispersion protocols (e.g., sonication time) and use a magnetic stirrer with a fixed rpm. | |
| Unaccounted for ambient conditions (e.g., temperature, oxygen). | Conduct control experiments where these variables are deliberately changed and monitored. | Perform reactions in a temperature-controlled chamber and carefully control the atmosphere (e.g., purging with O(2) or N(2)). |
Quantitative Data for Performance Comparison
The following table summarizes key metrics from recent research, providing benchmarks for evaluating your own photocatalytic systems.
Table 1: Performance Metrics of Selected Photocatalyst Systems from Literature
| Photocatalyst System | Key Performance Metric | Reported Value | Relevance to Recombination |
|---|---|---|---|
| ZIF-11/g-C(3)N(4) (Z-scheme) [11] | Bandgap (from DRS) | 2.58 eV | Optimal for visible light absorption, a factor in generation rate. |
| BET Surface Area | 174.5 m²/g | Higher surface area provides more active sites and can reduce bulk recombination. | |
| Degradation Efficiency (MB, 60 min) | 72.7% | Overall performance indicator; improved by reduced recombination. | |
| TBADT in Flow with Nanofiltration [58] | Catalyst Recycling Rate | > 99% | Key for cost and scalability, reduces waste. |
| Turnover Number (TON) | > 8,400 | Direct measure of catalyst efficiency and longevity; high TON suggests sustained activity without deactivation. |
Detailed Experimental Protocol: Constructing a Z-Scheme Heterojunction
This protocol outlines the synthesis of a ZIF-11/g-C(3)N(4) Z-scheme heterostructure, a strategy shown to reduce electron-hole recombination effectively [11].
Objective: To fabricate a zeolitic imidazolate framework-11/graphitic carbon nitride (ZIF-11/g-C(3)N(4)) nanocomposite that facilitates direct Z-scheme charge transfer, thereby enhancing charge separation and photocatalytic activity.
Materials:
- Urea (CH(4)N(2)O)
- Zinc acetate dihydrate (C(4)H({10})O(6)Zn·2H(2)O)
- Benzimidazole (C(7)H(6)N(_2))
- Methanol (CH(_3)OH)
- Toluene (C(6)H(5)CH(_3))
- Ammonium hydroxide (NH(_4)OH)
Procedure:
- Synthesis of g-C(3)N(4): Place 16 g of urea in a covered alumina crucible. Heat in a muffle furnace to 550 °C at a ramp rate of 2 °C/min and hold for 4 hours. After cooling to room temperature, collect the resulting light-yellow solid and grind it into a fine powder [11].
- Preparation of Precursor Solutions:
- Solution A: Disperse a specific amount (e.g., 0.3 g) of the as-synthesized g-C(3)N(4) powder in 6.1 mL of methanol. Stir or sonicate for 150 minutes to achieve a homogeneous dispersion.
- Solution B: Dissolve 0.12 g of benzimidazole in a mixture of 6.1 mL methanol, 5.3 mL toluene, and 0.8 mL ammonium hydroxide. Subsequently, add 0.11 g of zinc acetate dihydrate to this solution and stir until fully dissolved [11].
- Formation of the Heterostructure: Slowly add Solution A (the g-C(3)N(4) dispersion) to Solution B under continuous stirring at room temperature. Continue stirring the combined solution for 3 hours to allow the ZIF-11 crystals to nucleate and grow on the surface of the g-C(3)N(4) sheets.
- Product Recovery: Separate the solid product by centrifugation or filtration. Wash the precipitate three times with fresh methanol to remove any unreacted precursors or solvents. Finally, dry the final ZIF-11/g-C(3)N(4) composite at room temperature for 3 hours [11].
The workflow for this synthesis is visualized below.
Synthesis Workflow for ZIF-11/g-C₃N₄ Composite
The Scientist's Toolkit: Essential Reagents & Materials
Table 2: Key Research Reagent Solutions for Photocatalysis Experiments
| Reagent/Material | Function/Explanation | Example Use Case |
|---|---|---|
| Tetrabutylammonium Decatungstate (TBADT) | A homogeneous photocatalyst that operates via Hydrogen Atom Transfer (HAT) to functionalize C(sp³)–H bonds [58]. | Used in continuous-flow systems with nanofiltration for sustainable synthesis of chemical intermediates. |
| Graphitic Carbon Nitride (g-C(3)N(4)) | A metal-free, polymer semiconductor with a suitable bandgap for visible-light activity, high stability, and low cost [11]. | Serves as a base photocatalyst, often coupled with other materials (like ZIF-11) to form heterojunctions that suppress recombination [11]. |
| Zeolitic Imidazolate Frameworks (ZIFs) | A class of metal-organic frameworks (MOFs) with high surface area and tunable porosity, which can act as a co-catalyst or support [11]. | Combined with semiconductors (e.g., g-C(3)N(4)) to create composite photocatalysts that enhance charge separation [11]. |
| Organic Solvent Nanofiltration (OSN) Membrane | A membrane used to separate small molecule products from larger catalyst molecules in the reaction stream [58]. | Integrated into a continuous-flow photoreactor for in-line recovery and recycling of expensive homogeneous catalysts like TBADT [58]. |
| Polyethylene Glycol (PEG) | A polymer used for surface passivation [3]. | Coated onto carbon dots (C-Dots) or other nanomaterials to reduce surface defects that act as non-radiative recombination centers, thereby increasing photoluminescence quantum yield [3]. |
The logical relationship and function of these key components in an advanced photocatalytic system are summarized in the following diagram.
Tool Functionality in Managing Recombination
Performance Benchmarking: Validating and Comparing Reduction Strategies
Frequently Asked Questions (FAQs)
FAQ 1: What are the key quantitative metrics for evaluating photocatalytic hydrogen evolution? The primary quantitative metric is the Hydrogen Evolution Rate (HER), typically reported in micromoles per hour (μmol hâ»Â¹). Accurate reporting requires standardizing the measurement of critical input parameters, especially the active photon flux (AcP)—the number of photons with energy equal to or greater than the photocatalyst's bandgap energy. Using AcP instead of raw light intensity or lamp power can lead to a 90% reduction in prediction error for machine learning models of HER [59].
FAQ 2: How can I accurately measure and report light input for photocatalytic experiments? Do not rely solely on lamp power ratings (W) or light intensity (W mâ»Â²), as they are ambiguous and do not account for the spectral match with your photocatalyst. Instead, you should:
- Identify the specific emission spectrum of your light source.
- Convert the spectral irradiance to spectral photon flux by dividing by the photon energy (Eλ = hc/λ) at each wavelength.
- Integrate the spectral photon flux over the range where the photon energy is equal to or greater than your photocatalyst's bandgap energy (hv ≥ Eg) to obtain the Active Photon Flux (AcP) [59]. This metric unifies data from different experimental setups.
FAQ 3: What are the primary strategies to reduce electron-hole recombination in photocatalysts? A major strategy involves engineering defects in the photocatalyst material. For example, creating oxygen-deficient TiOâ‚‚ (known as black TiOâ‚‚) via hydrogen treatment introduces oxygen vacancies. These vacancies act as electron donors, dramatically improving charge separation and suppressing recombination from microseconds to seconds, which is a key factor behind high photoelectrochemical activity [60].
FAQ 4: My hydrogen evolution rates are low and variable, even when using the same catalyst. What could be wrong? Inconsistent rates are often due to unaccounted-for experimental variables. Focus on these key parameters that significantly influence HER [59]:
- Cocatalyst Properties: The work function and loading amount of the cocatalyst (e.g., Pt, Au, Ni).
- Sacrificial Reagents: The type and concentration of organic hole scavengers (e.g., methanol, glycerol).
- Light Input: Ensure you are using the Active Photon Flux (AcP) for a physically intuitive and accurate basis of comparison.
Troubleshooting Guides
Issue 1: Low Hydrogen Evolution Rate
| Probable Cause | Diagnostic Steps | Recommended Solution |
|---|---|---|
| Rapid electron-hole recombination | Perform transient absorption (TA) spectroscopy to measure charge carrier lifetimes [60]. | Engineer oxygen vacancies or other defects into the photocatalyst to suppress recombination. Consider hydrogen treatment for TiOâ‚‚ [60]. |
| Insufficient or inappropriate cocatalyst | Review the cocatalyst's work function; it should facilitate electron transfer from the semiconductor [59]. | Optimize the loading (wt%) of an effective cocatalyst (e.g., Pt, Au, Ni). The optimal value can be identified via machine learning models [59]. |
| Sub-optimal sacrificial reagent concentration | Systematically test HER rates at different concentrations of the alcohol or other hole scavenger. | Use a concentration that maximizes the rate without being wasteful. Machine learning can identify optimal interactions with other features like AcP [59]. |
| Incorrect photon flux calculation | Verify if your reported light input is the Active Photon Flux (AcP), not just lamp power [59]. | Recalculate your light input by following the AcP protocol: convert your light source's spectrum to photon flux and integrate for energies ≥ bandgap [59]. |
Issue 2: Poor Reproducibility of Kinetic Data
| Probable Cause | Diagnostic Steps | Recommended Solution |
|---|---|---|
| Unstandardized light measurement | Compare the methodology for measuring light input across different experimental batches. | Adopt Active Photon Flux (AcP) as a unifying input feature for all experiments to account for different lamp types and spectra [59]. |
| Inconsistent catalyst synthesis | Characterize different batches of the catalyst for key properties like crystallinity, surface area, and defect concentration. | Standardize synthesis protocols. For hydrogen-treated TiOâ‚‚,ä¸¥æ ¼æŽ§åˆ¶ parameters like temperature, time, and hydrogen pressure is crucial [60]. |
Quantitative Data Tables
Table 1: Key Features Influencing Photocatalytic Hydrogen Evolution Rates
| Feature | Role & Impact on HER | Optimal Range/Type (from model) |
|---|---|---|
| Active Photon Flux (AcP) | Unifying input feature; quantifies photons actually used for excitation. Reduces model error by ~90% [59]. | Model input; specific value depends on setup. |
| Cocatalyst Work Function | Governs electron transfer efficiency from semiconductor to cocatalyst for the reduction reaction [59]. | Optimal value is system-dependent. |
| Cocatalyst Loading | Typically has an optimal value; too low offers few active sites, too high may block light [59]. | Optimized via ML (e.g., for Pt, Au, Ni on TiOâ‚‚) [59]. |
| Alcohol Sacrificial Reagent | Acts as a hole scavenger, inhibiting electron-hole recombination [59] [45]. | Type and concentration are key model features [59]. |
Table 2: Reagent Solutions for Photocatalyst Synthesis and Testing
| Research Reagent | Function in Experiment |
|---|---|
| TiOâ‚‚ Precursors | Base semiconductor material for photocatalyst [59] [60]. |
| Cocatalyst Salts | Sources of metals (e.g., Pt, Au, Ni, Cu) deposited as cocatalysts to enhance HER [59]. |
| Sacrificial Reagents | Methanol, glycerol, ethylene glycol; act as hole scavengers to consume photogenerated holes and improve charge separation [59] [45]. |
| Hydrogen Gas | Used in thermal hydrogen treatment to create oxygen-deficient "black TiOâ‚‚" for suppressed recombination [60]. |
| Sodium Hydroxide | Common electrolyte (e.g., 1 M NaOH) for photoelectrochemical measurements [60]. |
Experimental Protocols
Protocol 1: Calculating Active Photon Flux (AcP)
Purpose: To standardize the light input for photocatalytic reactions, enabling accurate cross-study comparisons [59].
Methodology:
- Obtain Light Source Spectrum: Identify the specific emission spectrum (spectral irradiance in W mâ»Â² nmâ»Â¹) of your lamp from the manufacturer's data.
- Convert to Spectral Photon Flux: At each wavelength (λ), calculate the spectral photon flux (photons sâ»Â¹ mâ»Â² nmâ»Â¹) using the formula:
Spectral Photon Flux = Spectral Irradiance / (hc/λ), wherehis Planck's constant andcis the speed of light. - Integrate for Active Photons: Sum (integrate) the spectral photon flux over all wavelengths where the photon energy is equal to or greater than the bandgap energy of your photocatalyst (λ ≤ 1240/Eg, with Eg in eV). This sum is your Active Photon Flux (AcP).
Protocol 2: Hydrogen Treatment of TiOâ‚‚ to Suppress Recombination
Purpose: To create oxygen-deficient TiOâ‚‚ (H:TiOâ‚‚ or "black TiOâ‚‚") that exhibits efficient spatial charge separation and suppressed electron-hole recombination [60].
Methodology:
- Synthesis of TiOâ‚‚ Nanowires: Prepare rutile TiOâ‚‚ nanoarrays on a substrate (e.g., FTO glass) using a documented method [60].
- Air Annealing: Anneal the samples in air at 550°C for 3 hours (produces A:TiO₂) [60].
- Hydrogen Treatment: Place the air-annealed samples in a furnace and anneal under a hydrogen atmosphere at 350°C for 30 minutes to produce H:TiO₂ [60].
- Validation: Use techniques like transient absorption spectroscopy and XPS to confirm suppressed recombination and the presence of oxygen vacancies, respectively [60].
Conceptual Diagrams
Diagram 1: Photocatalytic Hydrogen Evolution Workflow
Diagram 2: Strategy for Reducing Electron-Hole Recombination
In photocatalytic research, a paramount challenge is the rapid recombination of photogenerated electron-hole pairs, which significantly reduces the quantum efficiency of catalytic reactions. This technical support document provides a comparative analysis of three primary strategies—heterojunction construction, defect engineering, and doping—developed to mitigate charge carrier recombination. Each approach employs distinct mechanisms to enhance charge separation, thereby improving photocatalytic performance for applications ranging from environmental remediation to solar fuel generation. The following sections offer detailed troubleshooting guides, experimental protocols, and FAQs to assist researchers in selecting and optimizing these strategies for their specific photocatalytic systems.
The table below summarizes the core characteristics, mechanisms, and applications of the three primary strategies for managing electron-hole recombination.
Table 1: Comparative Analysis of Strategies to Reduce Electron-Hole Recombination
| Strategy | Fundamental Mechanism | Key Advantages | Inherent Challenges | Exemplary Material Systems |
|---|---|---|---|---|
| Heterojunction Construction [26] | Creates an internal electric field at the interface of two semiconductors to drive spatial charge separation. | Greatly enhanced charge separation; Can tailor redox potentials for specific reactions. | Complex synthesis and interface control; Potential stability issues at the interface. | BiVO₄-based [61], COF-based S-scheme [62], g-C₃N₄/WO₃ [63] |
| Defect Engineering [64] [63] | Introduces atomic-scale vacancies (e.g., O, S) or edge sites that act as charge traps and modify the electronic structure. | Enhances light absorption and surface reactivity; Creates active sites for reactant adsorption/activation. | Requires precise control; Defects can sometimes act as recombination centers. | Oxygen-vacant WO₃ [65], Sulfur-vacant CdS [63], Defect-rich 2D Materials [63] |
| Doping [66] [65] | Incorporates foreign atoms into the host lattice to create impurity energy levels that facilitate electron-hole separation. | Simpler implementation in homogeneous systems; Effective for bandgap tuning. | Risk of introducing recombination centers at high concentrations; Limited improvement in charge spatial separation. | Fe-doped TiO₂ [65], Doped Bi₂WO₆ [66] |
Performance Metrics and Quantitative Comparison
The effectiveness of these strategies is quantitatively assessed using key performance indicators such as charge separation efficiency, reaction rate, and quantum yield. The following table compares the performance outcomes reported in recent studies.
Table 2: Quantitative Performance Comparison of Different Strategies
| Strategy | Material System | Application | Performance Metric | Reported Outcome | Reference |
|---|---|---|---|---|---|
| Doping | 0.213 wt.% Fe-doped TiOâ‚‚ | COâ‚‚ Reduction | CO Production Rate | 35.12 µmol·gâ»Â¹Â·hâ»Â¹ (3.2x higher than pristine TiOâ‚‚) | [65] |
| Heterojunction | 2D Membrane (ZnO-MoSâ‚‚/PVDF) | Dye Degradation (Methylene Blue) | Removal Efficiency | 99.95% in 15 min (vs. 56.89% for ZnO nanopowder) | [63] |
| Defect Engineering | Few-layered porous g-C₃N₄ | Dye Degradation (Rhodamine B) | Degradation Efficiency | 97.46% in 1 hour (vs. 32.57% for bulk g-C₃N₄) | [63] |
| Heterojunction + Defects | g-C₃N₄/WO₃ with O-vacancies | Cr(VI) Reduction | Enhancement Factor | Significant enhancement via synergistic band alignment and vacancy-mediated transfer | [63] |
The Scientist's Toolkit: Essential Reagents and Materials
Table 3: Key Research Reagent Solutions for Photocatalyst Development
| Reagent/Material | Function/Application | Key Characteristics |
|---|---|---|
| Covalent Organic Frameworks (COFs) [62] | Building blocks for S-scheme heterojunctions | Crystalline, porous organic polymers with tunable structures and properties. |
| BiVOâ‚„ [61] | Base semiconductor for heterojunctions | Narrow band gap, good visible light response, non-toxic. |
| Graphitic Carbon Nitride (g-C₃N₄) [63] | 2D photocatalyst for composites and defect engineering | Metal-free, tunable electronic structure, high stability. |
| Fe Dopants (e.g., Fe(NO₃)₃) [65] | Precursor for doping TiOâ‚‚ to create charge-trapping states | Ionic radius of Fe³⺠(0.064 nm) similar to Tiâ´âº (0.068 nm), minimizes lattice distortion. |
| Transition Metal Dichalcogenides (TMDs like MoSâ‚‚) [63] | Component for 2D heterojunctions and defect-rich systems | Layer-dependent bandgap (e.g., ~1.8 eV for monolayer MoSâ‚‚), high surface area. |
Experimental Protocols and Methodologies
Protocol for Doping: Fe-Doped TiOâ‚‚ Nanosheets
This methodology outlines the precise doping of TiOâ‚‚ with Fe to optimize carrier separation, as validated by advanced characterization [65].
Synthesis Procedure:
- Hydrothermal Method: Prepare a series of Fe-doped TiOâ‚‚ nanosheets using a one-step hydrothermal synthesis.
- Precursor Control: Systematically vary the Fe/Ti feed ratio in the precursor solution to control doping concentration. Typical samples achieve Fe mass fractions of 0.147 wt.%, 0.193 wt.%, 0.377 wt.%, and 0.965 wt.% as confirmed by Electron Probe X-ray Micro-Analyzer (EPMA).
- Crystallization: Ensure all synthesized samples crystallize in the anatase phase (confirmed by XRD), with a slight lattice contraction observed due to Fe³⺠substitution.
Key Characterization Techniques:
- X-ray Diffraction (XRD): To confirm phase purity and observe peak shifts indicating lattice incorporation of Fe.
- High-Angle Annular Dark-Field STEM (HAADF-STEM): To visualize the isolated, atomically dispersed Fe atoms (appearing as bright spots) and confirm homogeneous distribution via elemental mapping.
- Femtosecond Transient Absorption Spectroscopy (fs-TAS): A critical technique to quantify carrier dynamics. It directly measures the prolonged electron capture lifetime induced by the Fe-related defect levels, correlating it with enhanced photocatalytic performance.
- Kelvin Probe Force Microscopy (KPFM): To observe spatial charge separation and surface potential changes under photoexcitation.
Protocol for Constructing S-Scheme Heterojunctions with COFs
This protocol details the fabrication of advanced heterojunctions for superior charge separation [62].
Fabrication Steps:
- Material Selection: Select appropriate COF and semiconductor partners based on their band structures and Fermi levels to achieve desired S-scheme alignment.
- In-situ Growth or Hybrid Assembly: Employ methods such as in-situ crystallization of the COF on the pre-formed semiconductor or direct mixing and self-assembly to form an intimate interface.
- Interface Engineering: Optimize synthesis conditions (e.g., temperature, solvent) to ensure strong interfacial contact, which is crucial for effective internal electric field formation and charge transfer.
Key Characterization Techniques:
- In-situ XPS: To monitor shifts in binding energy and confirm the formation of an internal electric field at the interface.
- Electron Spin Resonance (ESR): To track the migration and separation pathways of photogenerated charge carriers.
- DFT Calculations: To theoretically model and predict the band alignment, charge density redistribution, and the S-scheme mechanism.
Protocol for Defect Engineering in 2D Photocatalysts
This methodology focuses on creating atomic-scale defects to modulate electronic structure and charge behavior [63].
Synthesis Strategies:
- Exfoliation and Etching: Use chemical or thermal exfoliation to create thin 2D layers while simultaneously introducing vacancies (e.g., oxygen vacancies in WO₃, sulfur vacancies in MoS₂).
- Post-Synthetic Treatment: Subject materials to specific environments (e.g., inert gas, hydrogen plasma, controlled vacuum annealing) to create and control defect density.
- Dopant-Mediated Defect Formation: Use gap-filling doping (e.g., P doping in CdS) to form high concentrations of specific vacancies [65].
Key Characterization Techniques:
- Spherical Aberration-Corrected STEM: To directly image atomic-scale vacancies and defect sites.
- Synchrotron-based XPS: To analyze surface chemical states and confirm the presence and type of defects.
- Raman Spectroscopy: To detect lattice disorder and strain induced by defect formation.
- Photoluminescence (PL) Spectroscopy: To indirectly probe the efficiency of charge separation and recombination, where a lower PL intensity often indicates suppressed recombination.
Troubleshooting Guides and FAQs
FAQ 1: How do I choose between a Type-II and an S-Scheme heterojunction?
Answer: The choice depends on the redox potential requirements of your target reaction and the band structures of your component materials.
- Choose a Type-II heterojunction when your primary goal is maximizing charge separation. In this configuration, electrons and holes migrate to the semiconductor with the lower conduction band and higher valence band, respectively. This effectively separates charges but may consume the more powerful (i.e., more negative and positive) charge carriers in the process [26].
- Choose an S-Scheme (Schottky-Scheme) heterojunction when you need to maintain the strongest possible redox power for demanding reactions (e.g., water splitting, COâ‚‚ reduction). The S-scheme selectively recombines and depletes the less useful electrons and holes at the interface, while preserving the most energetic electrons in one semiconductor and the most energetic holes in the other. This achieves both high charge separation and strong redox ability [62] [26].
FAQ 2: Why does my doped photocatalyst show lower activity despite successful doping?
Answer: This is a common issue often stemming from non-optimal doping parameters.
- Problem: The doping concentration is too high. While low levels of dopants create beneficial charge-trapping states, high concentrations can form new, efficient recombination centers that counteract the benefits [65].
- Solution: Systematically synthesize a series of samples with finely tuned doping concentrations. Use quantitative carrier dynamics characterization (e.g., fs-TAS, TRPL) to map the relationship between doping level and carrier separation efficiency. There is almost always an optimal "sweet spot" for doping concentration, as demonstrated with 0.213 wt.% Fe in TiOâ‚‚ [65].
FAQ 3: My heterojunction material shows poor performance. What could be wrong?
Answer: Poor performance in heterojunctions is frequently related to the quality of the interface.
- Potential Cause 1: Poor Interfacial Contact. If the two semiconductors do not form an intimate and sufficiently large interface, the internal electric field will be weak, and charge transfer will be inefficient [62] [26].
- Solution: Optimize your synthesis method to promote in-situ growth or ensure thorough mixing at the nanoscale to maximize the contact area.
- Potential Cause 2: Incorrect Band Alignment. The predicted charge transfer pathway (Type-II or S-scheme) may not be established due to miscalculated or mismatched band structures [26].
- Solution: Carefully characterize the band edge positions (conduction band, valence band, Fermi level) of individual components using techniques like UPS and XPS before composite fabrication to ensure thermodynamic feasibility for the desired heterojunction type.
FAQ 4: Can these strategies be combined?
Answer: Yes, and this is a leading edge of research. Combining strategies often yields a synergistic effect.
- Example 1: Constructing a heterojunction using defect-engineered components. For instance, a Z-scheme g-C₃N₄/WO₃ heterojunction showed enhanced Cr(VI) reduction due to synergistic band alignment and oxygen vacancy-mediated charge transfer [63].
- Example 2: Doping a heterojunction photocatalyst. Introducing specific dopants into one component of a heterojunction can further tailor its band structure and improve interfacial charge transfer [66].
Mechanism Workflow and Charge Separation Pathways
The following diagrams illustrate the fundamental mechanisms by which heterojunctions, doping, and defect engineering facilitate electron-hole separation.
High-Throughput Screening and Computational Design of Novel Photocatalysts
FAQ: Fundamental Concepts
What is electron-hole recombination, and why is it a critical issue in photocatalysis?
In photocatalysis, when a semiconductor absorbs light with energy equal to or greater than its bandgap, an electron is excited from the valence band (VB) to the conduction band (CB), leaving behind a positively charged "hole" in the VB. This creates an electron-hole pair, or exciton [67]. Electron-hole recombination is the process where this excited electron falls back into the hole, releasing the absorbed energy as heat or light instead of using it for a chemical reaction [3]. This process is a major bottleneck because it significantly reduces the number of available charge carriers for driving desired redox reactions, such as water splitting or pollutant degradation, thereby lowering the overall quantum efficiency and practical performance of the photocatalyst [68] [69].
How does high-throughput computational screening help design better photocatalysts?
High-throughput screening uses automated first-principles calculations, typically based on Density Functional Theory (DFT), to rapidly evaluate hundreds or thousands of potential materials for their photocatalytic properties [70] [71]. This approach allows researchers to:
- Identify Stable Structures: Calculate formation energies and binding energies to predict synthesizable materials [70].
- Predict Electronic Properties: Determine band gaps, band edge positions (for redox reactions), and band alignment in heterostructures [70] [71].
- Assess Optical Performance: Compute optical absorption spectra to gauge light-harvesting capability [70].
- Discover New Catalytic Sites: Screen single-atom co-catalysts to find those that improve charge separation and reduce activation barriers for reactions [71]. This method accelerates the discovery cycle by prioritizing the most promising candidates for experimental validation.
What is a type-II heterostructure, and how does it suppress recombination?
A type-II heterostructure is formed by vertically stacking two different semiconductor monolayers. Their band structures align in a "staggered" fashion, meaning the conduction band minimum (CBM) and valence band maximum (VBM) are localized in different layers [70]. This creates a built-in electric field at the interface that drives photogenerated electrons to one layer and holes to the other. This spatial separation across different physical layers drastically reduces the probability of electron-hole recombination, extending charge carrier lifetime and enhancing photocatalytic efficiency [70].
Troubleshooting Guides
Issue 1: Poor Charge Separation in Material
Problem: Low quantum yield due to rapid electron-hole recombination in your photocatalyst, leading to inefficient catalytic reactions.
Solution Steps:
- Design a Type-II Heterostructure: Use computational screening to pair two semiconductors with staggered band alignment. For example, screening identified MoTeâ‚‚/Tlâ‚‚O and MoSeâ‚‚/WSeâ‚‚ as effective type-II heterostructures [70].
- Incorporate Single-Atom Co-catalysts (SACs): Introduce single atoms (e.g., Cobalt on an Indium site, CoIn, or Ytterbium interstitials, Ybáµ¢, in ZnInâ‚‚Sâ‚„) which act as electron sinks or reaction sites, trapping one type of charge carrier and facilitating separation [71].
- Engineer Defects to Form Hole Polarons: Create disordered pores or specific defects on the catalyst surface (e.g., in KTaO₃) to enhance carrier-phonon coupling. This can lead to the formation of hole polarons, which effectively localize holes and prevent their recombination with electrons [69].
Verification:
- Photoluminescence (PL) Spectroscopy: A decrease in PL intensity in the modified material indicates reduced radiative recombination [11].
- Electrochemical Impedance Spectroscopy (EIS): A smaller arc radius in the Nyquist plot suggests a lower charge transfer resistance and improved charge separation [11].
Issue 2: Inaccurate Band Gap and Band Alignment Predictions
Problem: Standard DFT calculations underestimate band gaps, leading to unreliable predictions of a material's light-absorption range and redox potentials.
Solution Steps:
- Select an Advanced Exchange-Correlation Functional: Employ the hybrid HSE06 functional instead of the standard PBE (Perdew-Burke-Ernzerhof) functional for more accurate electronic structure calculations, as demonstrated in high-throughput studies [70].
- Calculate Band Edge Positions: Align the calculated conduction band minimum (CBM) and valence band maximum (VBM) with standard redox potentials. For water splitting at pH=0, ensure CBM is more negative than -4.44 eV (Hâº/Hâ‚‚) and VBM is more positive than -5.67 eV (Oâ‚‚/Hâ‚‚O) [70].
- Validate with Experimental Data: When available, compare computed optical absorption spectra and band gaps with experimental UV-Vis Diffuse Reflectance Spectroscopy (DRS) data to calibrate your computational methods [11].
Issue 3: Low Catalytic Activity Despite Good Charge Separation
Problem: Your photocatalyst shows excellent charge separation properties but the surface reaction kinetics are slow, limiting overall gas evolution or pollutant degradation rates.
Solution Steps:
- Screen for Effective Cocatalysts: Load nanoparticles or single atoms that serve as active sites for the target reaction. High-throughput screening can identify cocatalysts that lower the Gibbs free energy of key steps, like the Hydrogen Evolution Reaction (HER) [71].
- Analyze Reaction Free Energy: Compute the free energy profile of the catalytic reaction (e.g., ΔGH for HER) on different surface sites. A near-zero ΔGH is ideal [70].
- Use Sacrificial Agents: In experimental validation, employ hole scavengers (e.g., methanol, triethanolamine) to irreversibly consume photogenerated holes. This leaves more electrons available for the reduction reaction (e.g., Hâ‚‚ evolution), allowing you to isolate and optimize the half-reaction efficiency [68].
Experimental Protocols & Data
Detailed Workflow for High-Throughput Screening
The diagram below illustrates the integrated computational and experimental workflow for discovering efficient photocatalysts.
Computational Methodology (Based on [70] [71]):
- Software: Quantum Espresso package or similar DFT code.
- Parameters:
- Pseudopotentials: Norm-conserving or ultrasoft pseudopotentials.
- Cut-off Energy: 50 Ry for plane-wave basis set (convergence test required).
- k-point grid: Monkhorst-Pack 12x12x1 for 2D materials.
- Convergence Threshold: Energy 10â»â´ Ry, Force 10â»Â³ Ry/a.u.
- vdW Correction: Use DFT-D method for van der Waals interactions in heterostructures.
- Vacuum Layer: >15 Ã… along non-periodic direction.
- Analysis:
- Band Structure & DOS: To determine band gap and character.
- Work Function & Band Alignment: To establish type-II nature.
- Optical Absorption: From the complex dielectric function.
Quantitative Screening Data
The following table summarizes key properties for top-performing photocatalyst heterostructures identified through high-throughput screening, illustrating how they meet the criteria for efficient water splitting while suppressing recombination.
Table 1: Computed Properties of Selected High-Performance Photocatalysts from Screening Studies
| Material System | Band Gap (eV) | Band Alignment Type | Visible Light Absorption Coefficient (cmâ»Â¹) | HER Free Energy (ΔG_H, eV) | Key Recombination Suppression Mechanism |
|---|---|---|---|---|---|
| MoTe₂/Tl₂O heterostructure [70] | HSE06 calculated | Type-II | > 0.6 × 10ⶠ| < 0.1 (barrierless) | Intrinsic interlayer electric field |
| MoSe₂/WSe₂ heterostructure [70] | HSE06 calculated | Type-II | > 0.6 × 10ⶠ| < 0.1 (barrierless) | Intrinsic interlayer electric field |
| ZIF-11/g-C₃N₄ composite [11] | 2.58 (experimental) | Z-Scheme | Not specified | Not tested for HER | Z-scheme charge transfer |
| KTaO₃ with disordered pores [69] | Not specified | Not applicable | Not specified | Not applicable | Hole polaron formation |
The Scientist's Toolkit: Essential Research Reagents & Materials
Table 2: Key Materials and Their Functions in Photocatalyst Development and Testing
| Material / Reagent | Function in Research | Example Use Case |
|---|---|---|
| Transition Metal Dichalcogenides (TMDCs) | Semiconducting monolayers for constructing heterostructures. | MoSâ‚‚, WSâ‚‚, MoSeâ‚‚, WSeâ‚‚ used as components in type-II vdWHs [70]. |
| Graphitic Carbon Nitride (g-C₃N₄) | Metal-free, visible-light-active polymer semiconductor. | Combined with ZIF-11 to form a Z-scheme heterojunction for dye degradation [11]. |
| Zeolitic Imidazolate Frameworks (ZIFs) | Microporous materials providing high surface area and tunable functionality. | ZIF-11 used as a porous support and co-catalyst in composite photocatalysts [11]. |
| Single-Atom Co-catalysts (SACs) | Isolated metal atoms on a support that provide highly active sites and trap charge carriers. | Cobalt (CoIn) and Ytterbium (Ybáµ¢) in ZnInâ‚‚Sâ‚„ to improve HER activity and charge separation [71]. |
| Sacrificial Agents | Electron donors or hole scavengers that consume one type of charge carrier to study the other. | Methanol, triethanolamine (TEA), and Na₂S/Na₂SO₃ used in H₂ evolution experiments [68]. |
Technical Support Center
Frequently Asked Questions (FAQs)
Q1: Why does my photocatalyst's performance drop significantly when tested with real industrial wastewater compared to synthetic lab solutions?
A1: Performance drops in real wastewater are primarily due to complex matrices and competitive species. Industrial effluents often contain:
- Scavenging Ions: Inorganic anions (e.g., Clâ», SO₄²â», CO₃²â») can scavenge photogenerated holes or hydroxyl radicals (•OH), reducing their availability for target pollutant degradation [72].
- Organic Matter: Natural Organic Matter (NOM) competes with target pollutants for active sites on the photocatalyst surface and for reactive oxygen species (ROS), shielding the target pollutant [72].
- Suspended Solids: These can block light penetration, reducing the number of photons reaching the photocatalyst surface, and coat the catalyst, preventing contact with pollutants [72].
Troubleshooting Guide:
- Pre-treatment is key: Employ filtration to remove suspended solids and use coagulation or sedimentation to reduce turbidity [72].
- Optimize catalyst loading: Increase the photocatalyst dose to account for site competition and scavenging effects.
- Characterize the effluent: Analyze the wastewater's pH, ionic strength, and composition to tailor the photocatalytic process accordingly.
Q2: My photocatalyst shows high charge carrier recombination in photoluminescence (PL) analysis. What are the most effective strategies to mitigate this in a practical setting?
A2: High charge carrier recombination is a common bottleneck. Effective, practically viable strategies include:
- Constructing Heterojunctions: Coupling two semiconductors with appropriate band structures can significantly enhance electron-hole separation. A Z-scheme heterojunction, in particular, effectively separates charge carriers while maintaining high redox power, as demonstrated in the ZIF-11/g-C₃N₄ system [11].
- Surface Passivation: Passivating surface defects with organic ligands or polymers (e.g., Polyethylene Glycol, PEG) can "trap" non-radiative recombination pathways, thereby increasing the photoluminescence quantum yield (PLQY) and charge carrier lifetime [3].
- Morphological Control: Designing low-dimensional nanostructures like quantum dots, nanowires, or two-dimensional sheets can improve charge carrier mobility and reduce the distance carriers must travel to the surface, minimizing recombination chances [73].
Q3: How can I verify that improved performance is due to reduced electron-hole recombination and not just increased surface area?
A3: To deconvolute these effects, a combination of characterization techniques is required:
- Photoluminescence (PL) Spectroscopy: A direct method. A decrease in PL intensity indicates a reduction in the recombination of photogenerated electrons and holes [11].
- Electrochemical Impedance Spectroscopy (EIS): A smaller arc radius in a Nyquist plot suggests a lower charge transfer resistance and more efficient separation of charge carriers [11].
- Transient Photoluminescence (TRPL): Measures the carrier lifetime. A longer-lived decay indicates a slower recombination rate [73].
- BET Surface Area Analysis: Quantifies the specific surface area. By comparing catalysts with similar surface areas but different modifications, you can isolate the effect of recombination reduction [73].
Experimental Protocol: Evaluating a Z-Scheme Photocatalyst in Complex Effluents
This protocol is adapted from a study on ZIF-11/g-C₃N₄ for dye degradation [11].
1. Objective To synthesize and characterize a Z-scheme heterojunction photocatalyst and evaluate its performance and charge separation efficiency in both synthetic and real wastewater matrices.
2. Materials Synthesis
- Synthesis of g-C₃N₄: Place 16 g of urea in a covered alumina crucible. Heat in a muffle furnace to 550°C at a ramp rate of 2°C/min and hold for 4 hours. A yellow powder of g-C₃N₄ will be obtained [11].
- Synthesis of ZIF-11/g-C₃N₄ Composite: a. Disperse a specific amount (e.g., 0.3 g) of g-C₃N₄ in 6.1 mL of methanol and stir for 150 minutes (Solution A). b. Dissolve 0.12 g of benzimidazole in a mixture of 6.1 mL methanol, 5.3 mL toluene, and 0.8 mL ammonia. Then, add 0.11 g of zinc acetate dihydrate (Solution B). c. Add Solution A to Solution B and stir at room temperature for 3 hours. d. Centrifuge the solid product, wash it three times with methanol, and dry at room temperature [11].
3. Characterization (Pre-Validation)
- Structural & Morphological: Use XRD and FTIR to confirm chemical structure and bonding. Use FESEM/TEM to observe morphology and successful composite formation [11].
- Optical & Electronic: Use UV-Vis DRS to determine the bandgap. Use XPS to analyze surface composition and chemical states [11].
- Charge Separation Efficiency:
- Photoluminescence (PL): Compare the PL emission intensity of the composite with its individual components. A lower intensity indicates suppressed recombination [11].
- Electrochemical Impedance Spectroscopy (EIS): Measure the charge transfer resistance. A smaller arc radius in the EIS Nyquist plot suggests more efficient charge separation [11].
4. Performance Testing in Complex Matrices
- Setup: Use a batch photoreactor (e.g., Pyrex vessel) with a visible light source (e.g., 120 W lamp) [11].
- Procedure: a. Prepare two reaction solutions: (i) a synthetic pollutant solution (e.g., 5 ppm Methylene Blue in distilled water) and (ii) a filtered real industrial effluent spiked with the same pollutant. b. For each experiment, add 0.1 g/L of the photocatalyst to 200 mL of the reaction solution. c. Stir in the dark for 60 minutes to establish adsorption-desorption equilibrium. d. Turn on the light and take samples at regular intervals. e. Centrifuge the samples and analyze the supernatant using UV-Vis spectroscopy to determine pollutant concentration. f. For a more robust validation, measure the Total Organic Carbon (TOC) removal rate after a longer period (e.g., 5 hours) to assess mineralization efficiency [11].
Table 1: Key Performance Metrics for Z-Scheme Photocatalyst Validation
| Metric | Description | Target/Example Value | Significance in Real-World Validation |
|---|---|---|---|
| Degradation Efficiency | % removal of target pollutant after set time. | e.g., 72.7% for MB in 60 min [11] | Indicates initial catalytic activity. |
| Mineralization Efficiency (TOC) | % reduction in Total Organic Carbon. | e.g., 66.5% after 5 hours [11] | More rigorous; confirms pollutant is broken down to COâ‚‚ and Hâ‚‚O, not just transformed. |
| Rate Constant (k) | Kinetic rate constant from the first-order model. | Higher value indicates faster degradation. | Allows for quantitative comparison of reaction speeds between different catalysts or conditions. |
| Stability (Cycle Test) | Performance retention over multiple reuse cycles. | >3 consecutive cycles with minimal activity loss [11] | Critical for economic feasibility and practical application. |
The Scientist's Toolkit: Essential Research Reagents & Materials
Table 2: Key Reagents for Photocatalyst Development and Testing
| Research Reagent | Function in Experimentation | Application Context |
|---|---|---|
| g-C₃N₄ | A metal-free, visible-light-active polymer semiconductor. Serves as a base photocatalyst or a component in heterojunctions [74] [11]. | Used for pollutant degradation, water splitting, and as a sustainable alternative to metal-based catalysts. |
| ZIF-11 (Zeolitic Imidazolate Framework-11) | A crystalline porous material with a high surface area. Acts as a co-catalyst or scaffold to improve charge separation and adsorption [11]. | Often combined with semiconductors like g-C₃N₄ to form Z-scheme heterojunctions for enhanced activity. |
| Polyethylene Glycol (PEG) | A polymer used for surface passivation. Reduces surface defects that act as non-radiative recombination centers [3]. | Coating photocatalysts like carbon dots (C-Dots) to increase photoluminescence quantum yield (PLQY). |
| Urea | A low-cost, nitrogen-rich precursor for the thermal synthesis of g-C₃N₄ [11]. | Standard starting material for the facile production of g-C₃N₄ photocatalysts. |
| Scavenging Ions (e.g., Clâ», SO₄²â», CO₃²â») | Used in controlled experiments to simulate complex water matrices and study recombination pathways. They compete for charge carriers [72]. | Essential for validating catalyst robustness and understanding performance limitations in real effluents. |
Visualization: Z-Scheme Charge Transfer Mechanism
The following diagram illustrates the Z-scheme electron transfer pathway in a heterojunction photocatalyst, a key strategy for reducing electron-hole recombination.
Z-Scheme Charge Transfer Mechanism: This diagram illustrates the electron (eâ») and hole (hâº) flow in a Z-scheme heterojunction. Both semiconductors absorb light, generating electron-hole pairs. Instead of a simple transfer, the electrons from the conduction band of Semiconductor B combine with the holes in the valence band of Semiconductor A at the interface. This direct recombination pathway effectively separates the most energetic electrons (in CB1) and the most powerful holes (in VB2), allowing them to participate in highly efficient reduction and oxidation reactions, respectively [11].
A central challenge in semiconductor photocatalysis is the rapid recombination of photogenerated electron-hole pairs, which significantly limits efficiency by preventing these charge carriers from reaching the catalyst surface to drive desired redox reactions [75] [44]. This recombination problem manifests in multiple forms, including bulk recombination (within the photocatalyst material) and surface recombination, ultimately reducing the quantum yield of photocatalytic processes [3] [44].
Heterostructure engineering has emerged as a powerful strategy to spatially separate electrons and holes, thereby extending their lifetime and enhancing photocatalytic performance [75] [23]. This case study provides a direct technical comparison of binary, ternary, and quaternary heterostructures, offering researchers practical guidance for selecting and implementing these advanced material architectures in energy and environmental applications.
Performance Comparison of Heterostructure Architectures
Table 1: Direct Quantitative Comparison of Heterostructure Photocatalysts
| Heterostructure Type | Specific Material System | Key Performance Metric | Reported Efficiency/Performance | Reference System for Comparison |
|---|---|---|---|---|
| Binary | ZnInâ‚‚Sâ‚„/MIL-53-NHâ‚‚ | Hâ‚‚Oâ‚‚ Production in pure water/air | 743 μmol·Lâ»Â¹ in 2h | ~2.3x higher than individual components [76] |
| Ternary | CdS/ZnInâ‚‚Sâ‚„/MIL-53-NHâ‚‚ | Hâ‚‚Oâ‚‚ Production in pure water/air | 1792 μmol·Lâ»Â¹ in 2h | 41.7x higher than MIL-53-NH2 alone; 2.4x higher than binary Z/M [76] |
| Binary | ZIF-11/g-C₃N₄ | MB Degradation (5 ppm) | 72.7% in 60 min | Significant improvement over individual components [11] |
| Ternary | Ag/CdO/ZnO-TiO₂ | Hydrogen production via water splitting | Superior performance at optimal temperature (40°C) | Surpassed many functional materials; outperformed binary doping systems [23] |
| Binary (Type II) | CuWOâ‚„/CuS | RhB Dye Degradation | 100% in 90 min | Significant improvement over individual components (CuWOâ‚„: 2.74 eV & CuS: 3.19 eV) [75] |
Table 2: Advantages and Technical Challenges of Different Heterostructures
| Heterostructure Type | Charge Transfer Mechanism | Key Advantages | Technical Challenges |
|---|---|---|---|
| Binary | Type-II, Z-scheme | Simpler synthesis, proven charge separation, established protocols | Compromised redox potential (Type-II), limited light absorption, single-path charge transfer [75] [23] |
| Ternary | Multistep transfer, Z-scheme | Enhanced light absorption, multistep charge separation, superior interfacial compatibility | Complex synthesis, interfacial compatibility critical, optimized component ratios required [76] |
| Quaternary | Complex multistep pathways | Maximum light harvesting, sophisticated charge separation pathways | Extremely complex synthesis, multiple interface management, potential charge trapping at interfaces [75] |
Experimental Protocols for Heterostructure Synthesis
Binary Heterostructure Synthesis: ZIF-11/g-C₃N₄
Methodology: Simple solution-based assembly at room temperature [11]
- g-C₃N₄ Dispersion: Disperse 0.3 g of pre-synthesized g-C₃N₄ in 6.1 mL methanol with 150 minutes of stirring (Solution A)
- ZIF-11 Precursor: Dissolve 0.12 g benzimidazole in 6.1 mL methanol, 5.3 mL toluene, and 0.8 mL ammonia, then add 0.11 g zinc acetate (Solution B)
- Combination: Add Solution A to Solution B with continuous stirring for 3 hours at room temperature
- Recovery: Separate solid by centrifugation, wash three times with methanol, and dry at room temperature for 3 hours
Critical Parameters: Component ratio, mixing sequence, solvent composition, drying conditions [11]
Ternary Heterostructure Synthesis: CdS/ZnInâ‚‚Sâ‚„/MIL-53-NHâ‚‚
Methodology: Sequential building block approach [76]
- MIL-53-NHâ‚‚ Synthesis: Prepare via solvothermal method using aluminum chloride hexahydrate and 2-aminoterephthalic acid in DMF
- ZnIn₂S₄ Growth: Hydrothermally grow ZnIn₂S₄ lamellae along the MIL-53-NH₂ framework using zinc chloride, indium chloride tetrahydrate, and thioacetamide precursors at 120°C for 2 hours
- CdS Deposition: Deposit CdS nanoparticles on ZnInâ‚‚Sâ‚„/MIL-53-NHâ‚‚ surface using cadmium acetate and thiourea via hydrothermal treatment
- Post-processing: Collect by centrifugation, wash with ethanol and water, dry at 60°C overnight
Critical Parameters: Strict sequence adherence (MIL-53-NH₂ → ZnIn₂S₄ → CdS), reaction temperature, precursor concentrations, and intermediate washing [76]
Technical Support Center: Troubleshooting Common Experimental Issues
Frequently Asked Questions (FAQs)
Q1: Why does my ternary heterostructure show lower performance than its binary components?
A: This performance inversion typically stems from poor interfacial compatibility between components, which creates charge trapping sites rather than facilitating smooth charge transfer [76]. Solution approaches include:
- Verify synthesis sequence: Ensure correct building block assembly order (Component A → B → C)
- Optimize mass ratios: Systematically vary component ratios (e.g., 1:1:1, 1:2:1, 1:1:2)
- Characterize interfaces: Use TEM and XPS to examine interfacial bonding and element distribution [76]
Q2: How can I confirm whether my heterostructure follows Type-II or Z-scheme mechanism?
A: Mechanism confirmation requires multiple complementary characterization techniques [75] [23]:
- Radical trapping experiments: Use specific scavengers (e.g., EDTA for hâº, BQ for •Oâ‚‚â»)
- Band alignment analysis: Measure VB/XPS and Tauc plots for band positions
- Photodeposition: Observe noble metal (Au, Pt) and metal oxide (PbOâ‚‚, MnOâ‚‚) deposition sites
- In-situ characterization: Employ SPV (surface photovoltage) and EPR (electron paramagnetic resonance) [75]
Q3: What causes poor reproducibility in quaternary heterostructure synthesis?
A: Quaternary systems exhibit complexity with four components and multiple interfaces [75]. Improve reproducibility through:
- Precursor standardization: Use consistent precursor sources, purity grades, and storage conditions
- Strict parameter control: Maintain identical temperature ramping rates, mixing speeds, and aging times
- Systematic optimization: Employ design of experiments (DoE) rather than one-factor-at-a-time approaches
- Intermediate characterization: Analyze each synthesis stage with XRD and BET to identify variance sources [75] [76]
Troubleshooting Guide for Common Problems
Table 3: Troubleshooting Common Heterostructure Experimental Issues
| Problem | Potential Causes | Diagnostic Tests | Solutions |
|---|---|---|---|
| Low photocatalytic activity | High charge recombination, poor interfacial contact, inappropriate band alignment | PL spectroscopy, EIS, time-resolved fluorescence | Optimize component ratios, introduce bridge components, try alternative synthesis methods |
| Inconsistent batch-to-batch performance | Uncontrolled synthesis parameters, precursor decomposition, impurity variation | XRD crystallinity check, BET surface area, EDS elemental analysis | Standardize precursors,ä¸¥æ ¼æŽ§åˆ¶åˆæˆå‚æ•°, implement rigorous quality control for intermediates |
| Structural instability during reaction | Weak interfacial bonds, chemical corrosion, mechanical stress | Pre/post-reaction XRD, SEM/TEM morphology comparison, ICP-MS leaching analysis | Apply protective coatings, optimize crystallinity, adjust reaction pH/temperature |
| Poor visible light response | Large band gap, inefficient light harvesting | UV-Vis DRS, band gap calculation, IPCE measurements | Incorporate narrow bandgap semiconductors, implement dye sensitization, create defect states |
Heterostructure Charge Transfer Mechanisms
Diagram 1: Charge Transfer and Reduction Pathways in Heterostructure Photocatalysts. This diagram illustrates the fundamental challenge of electron-hole recombination in single semiconductors and how different heterostructure architectures provide solutions for enhanced charge separation.
Research Reagent Solutions: Essential Materials for Heterostructure Synthesis
Table 4: Essential Research Reagents for Heterostructure Photocatalyst Development
| Reagent Category | Specific Examples | Function in Heterostructure Synthesis | Application Notes |
|---|---|---|---|
| Metal Precursors | Zinc acetate, Cadmium acetate, Indium chloride, Aluminum chloride | Provide metal cation sources for semiconductor frameworks | Purity (>99%) critical for reproducibility; hygroscopic salts require dry storage [76] [11] |
| Organic Linkers | Benzimidazole, 2-aminoterephthalic acid | Form coordination frameworks (MOFs, ZIFs), structure-directing agents | Determines pore structure and surface functionality [11] |
| Sulfur Sources | Thioacetamide (TAA), Thiourea | Provide sulfur anions for metal sulfide formation | Decomposition kinetics affect nanocrystal size and morphology [76] |
| Solvents | Methanol, Toluene, DMF, Water | Reaction medium, influencing crystallization kinetics | Anhydrous grades preferred for reproducible nucleation [11] |
| Structure-Directing Agents | Ammonium hydroxide, Polyvinyl pyrrolidone (PVP) | Control morphology, particle size, prevent aggregation | Concentration significantly impacts final architecture [11] [23] |
| Carbon Nitride Precursors | Urea, Melamine, Thiourea | Source for g-C₃N4 synthesis via thermal polymerization | Heating rate and temperature critical for optimal condensation [11] |
This technical comparison demonstrates that moving from binary to ternary heterostructures can significantly enhance photocatalytic performance by reducing electron-hole recombination through multistep charge transfer mechanisms [76]. However, this performance gain comes with increased synthetic complexity and stricter interfacial compatibility requirements.
Recommended research directions based on this analysis include:
- Advanced characterization: Develop in-situ and operando methods to directly observe charge transfer dynamics in complex heterostructures
- Interface engineering: Focus on molecular-level control of interfacial bonds to minimize charge trapping
- Machine learning approaches: Implement predictive modeling for optimal component selection and synthesis parameter optimization [44]
- Scalability studies: Translate laboratory-scale successes to practically applicable material quantities
The strategic selection of heterostructure architecture should balance performance requirements with synthetic feasibility, with ternary systems currently offering the optimal compromise for most advanced photocatalytic applications.
Conclusion
Suppressing electron-hole recombination is paramount for unlocking the full potential of photocatalysis. This review has synthesized key strategies, demonstrating that heterojunction construction, defect engineering, and emerging approaches like electron spin control synergistically enhance charge separation. Future research must focus on intelligent material design guided by computational screening, the development of in situ characterization techniques, and the creation of adaptive, multi-functional systems. For biomedical and clinical research, these advancements promise more efficient photocatalytic platforms for drug synthesis, pathogen inactivation, and wound disinfection, paving the way for sustainable technological breakthroughs.
References
- 1. Advances in Composite Photocatalysts for Efficient ... [https://www.mdpi.com/2073-4344/15/9/893]
- 2. Kinetics and mechanisms of charge transfer processes in ... [https://www.sciencedirect.com/science/article/pii/S1389556712000457]
- 3. Electron-Hole Recombination - an overview [https://www.sciencedirect.com/topics/chemistry/electron-hole-recombination]
- 4. Defect density modulation of La2TiO5: An effective method ... [https://www.sciencedirect.com/science/article/abs/pii/S0021979721009292]
- 5. A Review of Synthesis Methods, Modifications, and ... [https://pmc.ncbi.nlm.nih.gov/articles/PMC11191136/]
- 6. Etched BiVO4 photocatalyst with charge separation ... [https://www.nature.com/articles/s41467-025-59076-8]
- 7. Fundamentals of Photocatalysis [https://www.linkedin.com/pulse/fundamentals-photocatalysis-muhammed-a-mahmoud]
- 8. Recent prospects, challenges and advancements of ... [https://www.oaepublish.com/articles/wecn.2025.03]
- 9. Recombination processes [https://pv-manufacturing.org/metrology/recombination-processes/]
- 10. An Overview of Dynamic Descriptions for Nanoscale Materials ... [https://pmc.ncbi.nlm.nih.gov/articles/PMC11926325/]
- 11. Reduced electron/hole recombination in Z-scheme ... [https://www.nature.com/articles/s41598-023-49315-7]
- 12. Recent Breakthroughs in Overcoming the Efficiency Limits ... [https://www.mdpi.com/2073-4344/15/11/1067]
- 13. Cage escape governs photoredox reaction rates and ... [https://www.nature.com/articles/s41557-024-01482-4]
- 14. Time-Resolved Photoluminescence (TRPL) [https://www.swabianinstruments.com/applications/time-resolved-photoluminescence/]
- 15. Time-resolved ARPES - Shen Laboratory - Stanford University [https://arpes.stanford.edu/research/tool-development/time-resolved-arpes]
- 16. Mechanistic investigations of emerging type-II, Z-scheme ... [https://www.sciencedirect.com/science/article/abs/pii/S0925838824022709]
- 17. Heterojunction Nanomedicine - PMC [https://pmc.ncbi.nlm.nih.gov/articles/PMC9008793/]
- 18. Design of S-Scheme CuInS2/CeO2 Heterojunction for ... [https://pmc.ncbi.nlm.nih.gov/articles/PMC11803712/]
- 19. A novel type-II–II heterojunction for photocatalytic ... [https://www.nature.com/articles/s41598-024-60250-z]
- 20. Forming heterojunction: an effective strategy to enhance ... [https://www.nature.com/articles/srep29327]
- 21. Defect Tolerance via External Passivation in the ... [https://pmc.ncbi.nlm.nih.gov/articles/PMC12232298/]
- 22. Defect-modulated oxygen adsorption and Z-scheme ... [https://www.nature.com/articles/s41467-025-64166-8]
- 23. Synergistic doping with Ag, CdO, and ZnO to overcome ... [https://pmc.ncbi.nlm.nih.gov/articles/PMC10661415/]
- 24. Architecting TiO2@ZrBTB hollow shell nanostructure for ... [https://www.sciencedirect.com/science/article/abs/pii/S0013935125024284]
- 25. Dual S-scheme heterojunction nanocomposite-driven ... [https://link.springer.com/article/10.1007/s42114-025-01470-3]
- 26. Heterojunction photocatalysts: where are they headed? [https://pubs.rsc.org/en/content/articlehtml/2025/lf/d5lf00037h]
- 27. Electron migration pathways in S-scheme GaP-TiO2 ... [https://www.sciencedirect.com/science/article/pii/S1359645425005610]
- 28. Verifying the Unique Charge Migration Pathway in ... [https://pmc.ncbi.nlm.nih.gov/articles/PMC12021120/]
- 29. Direct evidence of multichannel-improved charge-carrier mechanism for enhanced photocatalytic H2 evolution | Scientific Reports [https://www.nature.com/articles/s41598-017-12203-y]
- 30. MOFs as platforms for multiscale structural regulation: new frontiers in photocatalyst design [https://www.oaepublish.com/articles/microstructures.2024.171]
- 31. Insights into spin polarization regulated exciton dissociation and charge separation of C3N4 for efficient hydrogen evolution and simultaneous benzylamine oxidation | Nano Research [https://link.springer.com/article/10.1007/s12274-023-5574-5]
- 32. Boosting photocatalytic activity through tuning electron spin states and external magnetic fields - ScienceDirect [https://www.sciencedirect.com/science/article/abs/pii/S1005030222000664]
- 33. Electron paramagnetic resonance [https://en.wikipedia.org/wiki/Electron_paramagnetic_resonance]
- 34. Scientists Create Magnetic Nanohelices To Control ... [https://scitechdaily.com/scientists-create-magnetic-nanohelices-to-control-electron-spin-at-room-temperature/]
- 35. Electric control of spin transitions at the atomic scale [https://www.nature.com/articles/s41467-023-42287-2]
- 36. Bi2MoO6-based photocatalysts: engineering strategies for ... [https://pmc.ncbi.nlm.nih.gov/articles/PMC12584979/]
- 37. The synthesis of a Bi2MoO6/Bi4V2O11 heterojunction ... [https://pmc.ncbi.nlm.nih.gov/articles/PMC9078112/]
- 38. Recent Advances in g-C3N4-Based Materials and Their ... [https://pmc.ncbi.nlm.nih.gov/articles/PMC9823828/]
- 39. Energy conversion and loss in heterojunction photocatalysts [https://www.sciencedirect.com/science/article/abs/pii/S2451929425003109]
- 40. 2. Band alignment in heterostructures — QTCAD ... [https://docs.nanoacademic.com/qtcad/theory/band_alignment/]
- 41. Heterojunction [https://en.wikipedia.org/wiki/Heterojunction]
- 42. Electron Extraction Optimization for Carbonâ€Based Hole†... [https://pmc.ncbi.nlm.nih.gov/articles/PMC12232247/]
- 43. 27%-efficiency silicon heterojunction cell with 98.6% cell-to ... [https://www.nature.com/articles/s41467-025-64465-0]
- 44. Optimizing photocatalysis via electron spin control [https://pubs.rsc.org/en/content/articlehtml/2025/cs/d4cs00317a]
- 45. Principles of Photocatalysts and Their Different Applications [https://pmc.ncbi.nlm.nih.gov/articles/PMC10618379/]
- 46. Verifying the relationships of defect site and enhanced ... [https://www.nature.com/articles/s41598-022-15557-0]
- 47. Challenges of photocatalysis and their coping strategies [https://www.sciencedirect.com/science/article/pii/S2667109322002160]
- 48. Recent prospects, challenges and advancements of ... [https://www.oaepublish.com/articles/eceh.2025.03]
- 49. Advanced photocatalytic degradation of POPs and other ... [https://pubs.rsc.org/en/content/articlehtml/2025/ra/d5ra04336k?page=search]
- 50. Simultaneous value-added utilization of photogenerated ... [https://www.nature.com/articles/s41467-025-61223-0]
- 51. Impact of electron – hole on the... recombination mechanism [https://link.springer.com/article/10.1007/s10971-024-06385-x]
- 52. Modulation of photogenerated holes for enhanced ... [https://www.oaepublish.com/articles/microstructures.2022.23]
- 53. Enhanced light harvesting and electron-hole separation for ... [https://www.sciencedirect.com/science/article/abs/pii/S0926337319300426]
- 54. Enhancing photocatalytic efficiency through surface ... [https://www.nature.com/articles/s41545-025-00480-4]
- 55. Electron-Hole Recombination [https://eng.libretexts.org/Bookshelves/Materials_Science/Supplemental_Modules_(Materials_Science)/Electronic_Properties/Electron-Hole_Recombination]
- 56. Carrier generation and recombination [https://en.wikipedia.org/wiki/Carrier_generation_and_recombination]
- 57. Photocatalytic Activity: Experimental Features to Report in ... [https://www.mdpi.com/1996-1944/11/10/1990]
- 58. Bringing photocatalysis from laboratory to industry - HIMS [https://hims.uva.nl/content/news/2022/10/bringing-photocatalysis-from-laboratory-to-industry.html]
- 59. Predicting the rates of photocatalytic hydrogen evolution over ... [https://pubs.rsc.org/en/content/articlehtml/2024/ey/d3ey00246b]
- 60. Efficient Suppression of Electron–Hole Recombination in ... [https://pmc.ncbi.nlm.nih.gov/articles/PMC3871891/]
- 61. Recent advances in BiVO 4 -based heterojunction ... [https://pubs.rsc.org/en/content/articlehtml/2025/cc/d4cc06798c]
- 62. COF-Based S-Scheme Heterojunction Photocatalyst [https://pubmed.ncbi.nlm.nih.gov/40970807/]
- 63. Harnessing atomic-scale defect engineering in 2D ... [https://pmc.ncbi.nlm.nih.gov/articles/PMC12445102/]
- 64. Recent advances in rational design of defect-engineered ... [https://www.sciencedirect.com/science/article/pii/S0360319925053984]
- 65. The Function of Photocatalytic Performance and Carrier ... [https://pmc.ncbi.nlm.nih.gov/articles/PMC12225004/]
- 66. Doping vs. heterojunction: A comparative study of the ... [https://www.sciencedirect.com/science/article/pii/S1566736723001073]
- 67. Photocatalysis [https://en.wikipedia.org/wiki/Photocatalysis]
- 68. Semiconductor photocatalysts for hydrogen evolution [https://pubs.rsc.org/en/content/articlehtml/2025/cc/d5cc04459f?page=search]
- 69. Hole Polaron-Mediated Suppression of Electron ... [https://pubmed.ncbi.nlm.nih.gov/39212648/]
- 70. High-Throughput Screening of 2D Photocatalyst ... [https://arxiv.org/html/2508.17483v1]
- 71. High-throughput screening of single atom co-catalysts in ... [https://pubs.rsc.org/en/content/articlelanding/2024/ma/d4ma00616j]
- 72. The photocatalytic process in the treatment of polluted water [https://pmc.ncbi.nlm.nih.gov/articles/PMC9527146/]
- 73. Transformative strategies in photocatalyst design: merging computational methods and deep learning [https://www.oaepublish.com/articles/jmi.2024.48]
- 74. The challenge and opportunity of organic semiconductors in photocatalysis [https://www.oaepublish.com/articles/microstructures.2024.175]
- 75. Comparative insights into CuS and Bi 2 S 3 -based ... [https://link.springer.com/article/10.1007/s42452-025-07600-2]
- 76. Construction of ternary hierarchical heterostructures with ... [https://www.sciencedirect.com/science/article/abs/pii/S0925838824035497]